Details
-
Bug
-
Status: Closed (View Workflow)
-
 Critical
-
Resolution: Fixed
-
10.6.17, 10.11.7, 11.4.1
-
None
Description
This is similar to regressions I found with CPU-bound sysbench (MDEV-33966), but I opened a separate issue because this occurs with IO-bound Insert Benchmark.
I ran an IO-bound Insert Benchmark (IO-bound because the working set and database are much larger than memory) on a small server (8 cores, 16G RAM) to compare MariaDB LTS releases for 10.2, 10.3, 10.4, 10.5, 10.6, 10.11 and upcoming 11.4 with MySQL 5.6, 5.7 and 8.0.
A result for a CPU-bound benchmark is here which covers a test that uses a smaller database that can be cached and isn't IO-bound. In the cased case, MariaDB doesn't have large regressions from 10.2 to 11.4. Here, with an IO-bound setup there are regressions.
The IO-bound tests were run for 1 and 4 clients:
- all DBMS - 1 client and 4 clients
- all MariaDB LTS - 1 client and 4 clients
- all MySQL - 1 client and 4 clients
- MariaDB vs MySQL - 1 client and 4 clients
- MariaDB 10.11 - 1 client and 4 clients
- MariaDB 11.4 - 1 client and 4 clients
The way I label results context on the DBMS version and my.cnf
- ma101107_rel.cz11a_bee - MariaDB 10.11.7 with the cz11a_bee config that uses innodb_flush_method=O_DIRECT_NO_FSYNC and innodb_change_buffering=none
- ma101107_rel.cz11b_bee - MariaDB 10.11.7 with the cz11b_bee config that uses innodb_flush_method=O_DIRECT and innodb_change_buffering=none
- ma110401_rel.cz11b_bee - MariaDB 10.11.7 with the cz11b_bee config that uses innodb_flush_method=O_DIRECT and the InnoDB change buffer has been removed
- my8036_rel.cz11a_bee - MySQL 8.0.36 with the cz11a_bee config that uses innodb_flush_method=O_DIRECT_NO_FSYNC and innodb_change_buffering=all
- my8036_rel.cz11d_bee - MySQL 8.0.36 with the cz11d_bee config that uses innodb_flush_method=O_DIRECT_NO_FSYNC and innodb_change_buffering=none
Note that the cz11d_bee config for MySQL 8.0.36 is similar to the cz11a_bee config for MariaDB.
My claim about the regressions is based on the following
- start with the MariaDB vs MySQL comparison for 1 client and 4 clients and the results for MySQL 8.0.36 (my8036_rel.cz11a_bee and my8036_rel.cz11d_bee) are much better than for MariaDB 10.11.7 (ma101107_rel.cz11a_bee) and 11.4.1 (ma110401_rel.cz11b_bee).
- then look at results for MariaDB LTS releases with 1 client and 4 clients and see some regressions from ma100433 (10.4.33) to ma100524 (10.5.24) and larger regressions from ma100524 to ma100617 (10.6.17)
- then look at the HW metrics for MariaDB LTS releases from the 1 client setup. These are values from vmstat and iostat normalized by query and insert rates to understand HW efficiency. For the write heavy benchmark steps from 10.4.33 through 10.6.17 I see a ~20% increase in context switches per insert (cspq) and ~20% decrease in CPU per insert (cpupq) – see for l.i1 and for l.i2. Most of the change is from 10.5.24 to 10.6.17. I assume this is a result of the changes in 10.6 to replace some mutexes and rw-locks from spinning to not-spinning. So there is less CPU burned, but more lock waiters are going to sleep.
- the read-write benchmark steps also show a similar pattern as the write rate increases. See the 1 client results for range queries and point queries when the background write rate is 1000/s. Although here I see an increase in cspq (more context switches per query == more threads going to sleep) but not a large decrease in cpupq (CPU per query)
Attachments

Issue Links
- blocks
-
-
- Closed
-
- relates to
-
-
- Stalled
-
-
-

- Closed
-
-
-
- Closed
-
Activity
Starting with MariaDB Server 10.6, index_lock is defined as a non-spinning variant. The following patch should enable spin loops for dict_index_t::lock no matter which cmake -DPLUGIN_PERFSCHEMA parameter is in use:
diff --git a/storage/innobase/include/srw_lock.h b/storage/innobase/include/srw_lock.h
|
index 98c256d3b73..bcf2e57fd5b 100644
|
--- a/storage/innobase/include/srw_lock.h
|
+++ b/storage/innobase/include/srw_lock.h
|
@@ -404,7 +404,7 @@ typedef srw_spin_lock_low srw_spin_lock;
|
class ssux_lock
|
{
|
PSI_rwlock *pfs_psi;
|
- ssux_lock_impl<false> lock;
|
+ ssux_lock_impl<true> lock;
|
|
ATTRIBUTE_NOINLINE void psi_rd_lock(const char *file, unsigned line);
|
ATTRIBUTE_NOINLINE void psi_wr_lock(const char *file, unsigned line);
|
diff --git a/storage/innobase/include/sux_lock.h b/storage/innobase/include/sux_lock.h
|
index 7a7f93b6787..f0ff2cde228 100644
|
--- a/storage/innobase/include/sux_lock.h
|
+++ b/storage/innobase/include/sux_lock.h
|
@@ -285,7 +285,7 @@ class sux_lock final
|
typedef sux_lock<ssux_lock_impl<true>> block_lock;
|
|
#ifndef UNIV_PFS_RWLOCK
|
-typedef sux_lock<ssux_lock_impl<false>> index_lock;
|
+typedef sux_lock<ssux_lock_impl<true>> index_lock;
|
#else
|
typedef sux_lock<ssux_lock> index_lock;
|
|
|
I checked that the bool spinloop=true variant srw_mutex_impl<true>::wr_lock_try is being invoked in an index operation (specifically, a btr_cur_t::search_leaf() that was eventually followed by a call to btr_compress()).
From my small server with low concurrency, the patch doesn't fix the problem. The tl;dr is that MariaDB appears to spin for no more than 10,000 cycles before putting threads to sleep while upstream MySQL often spins for more than 100,000 cycles. My CPU in this case is AMD Ryzen 7 7735HS with Radeon Graphics running at 1.6+ GHz. Lets round that up to 2 GHz and then I will claim that MariaDB spins for up to 5 microseconds while MySQL spins for 100+ microseconds.
In summary, your busy-wait loop doesn't wait long enough.
Results are here and the servers tested are:
- ma100433_rel.cz11a_c8r32 - MariaDB 10.4.33
- ma100524_rel.cz11a_c8r32 - MariaDB 10.5.24
- ma100617_rel.cz11a_c8r32 - MariaDB 10.6.17
- ma100617_rel.cz11apur1_c8r32 - MariaDB 10.6.17 with innodb_purge_threads =1 while others used =4
- ma100617_rel_nops.cz11a_c8r32 - MariaDB 10.6.17 with most of the perf schema disabled at compile time
- ma100617marko_rel.cz11a_c8r32 - MariaDB 10.6.17 with your patch.
Note that your change to sux_lock.h doesn't matter because it is in a block of code guarded by:
#ifndef UNIV_PFS_RWLOCK
There are a few small differences:
- default for innodb_spin_wait_delay is 4 in MariaDB vs 6 in MySQL
- MySQL uses ut_delay(ut_rnd_interval(0, srv_spin_wait_delay)); while MariaDB doesn't appear to use anything like ut_rnd_interval so the delay with MySQL varies while with MariaDB it is (or well, should be, read below) fixed
On this CPU my_cpu_relax_multiplier is set to 100 so that this expression == 100
my_cpu_relax_multiplier / 4 * srv_spin_wait_delay
And because of the use of ut_rnd_interval for MySQL, that picks a value of [0, ... 6] which is then multiplied by 50, so the number of PAUSE instructions is expected to be 100 per round with MariaDB vs one of [0, 50, 100, 150, 200, 250, 300] with MySQL.
So up to this point I assume that MySQL busy loops should be ~1.5X longer on average vs MariaDB. But that is not what happens in practice. The problem appears to be in srv_mutex_impl<spinlock>::wait_and_lock and most iterations in the busy-wait for loop use the "if" block and srw_pause isn't called in that case.
I hacked in code to monitor what happens per-call in ::wait_and_lock (see here). This code:
- prints something per call only when srw_pause was called
- prints "X cycles" - X is total time in cycles for that call
- "loops A, B" - A is number of times the "if" block was taken and "B" is the number of times the "else" block was taken and srw_pause is only called in the else block
- "waits R, S" - measured in the for loop that follows the busy wait loop where R is the number of times the "if" block was taken in which there is a call to ::wait to put the thread to sleep and where S is the number of times the "else" block was taken.
Typical output is below and I have only selected cases for which R=1 so that there was an attempt to put the thread to sleep. But even in such cases:
- the total number of cycles is small, less than 9000
- the busy wait loop has A=29 (29 times it used the "if" branch without a call to srw_pause) and B=1 (1 time it used the "else" branch, and called srw_pause)
spin 8960 cycles, loops 29, 1 and waits 1, 1
spin 8608 cycles, loops 29, 1 and waits 1, 1
spin 8864 cycles, loops 29, 1 and waits 1, 1
spin 8800 cycles, loops 29, 1 and waits 1, 1
Thank you for the update. This seems to be a bug that was introduced in MDEV-26467, which followed up MDEV-24142 and MDEV-24167.
You mention two earlier MariaDB specific changes that are related to this:
In MDEV-19845, we made an adjustment to the changed latency of the PAUSE instruction in the Intel Skylake microarchitecture. I would have wanted to add a start-up message about the chosen value of my_cpu_relax_multiplier. (MDEV-19929), but the idea was rejected at that time. I remember reading that the latency of the PAUSE instruction would be rather inconsistent between different CPU implementations and that on some AMD implementations the latency would be something like 40 cycles, while Intel Skylake radically changed the latency from about 10 to 100 cycles. If I remember it correctly, the latency was reduced again in the next Intel microarchitecture (Cascade Lake).
In MDEV-14482, the spin loop logic was simplified to remove memory bottleneck related to updating the global state of a random number generator (ut_rnd_interval), which was used for determining how long each thread would spin before suspending themselves. This could have been more of an issue on POWER or ARM, which MySQL has traditionally cared less about.
Your instrumentation shows that the spin loop logic indeed is missing a call to srw_pause() when it is re-reading the lock word to see if it might be useful to attempt a read-modify-write operation to acquire the lock. Intel documentation recommends to read the lock word in such loops, and not to blindly attempt the read-modify-write. Can you please try the following patch?
diff --git a/storage/innobase/sync/srw_lock.cc b/storage/innobase/sync/srw_lock.cc
|
index 651ac4dcb7e..a4363df5124 100644
|
--- a/storage/innobase/sync/srw_lock.cc
|
+++ b/storage/innobase/sync/srw_lock.cc
|
@@ -316,10 +316,10 @@ void srw_mutex_impl<spinloop>::wait_and_lock()
|
if (!((lk= lock.fetch_or(HOLDER, std::memory_order_relaxed)) & HOLDER))
|
goto acquired;
|
#endif
|
- srw_pause(delay);
|
}
|
if (!--spin)
|
break;
|
+ srw_pause(delay);
|
}
|
}
|
|
|
The other calls to srw_pause() seem to be fine.
Would this patch alone be sufficient to address the issue, or would we additionally have to enable the spin lock component of dict_index_t::lock?
By the way, I am using some inline assembler, because until recently, both GCC and clang would translate any std::atomic::fetch_or() (or basically anything else than fetch_add() or fetch_sub() to an utterly inefficient loop around lock cmpxchg. The best operations that I could employ on this ISA were the i80386 lock bts and the i80486 lock xadd. For atomically setting or clearing a bit, I sometimes use lock xadd, which is actually toggling a bit and potentially any further bits that are more significant.
Recent ISA extensions and compilers could be worth another specialization. This note about GCC 13 mentions CMPccXCHG and INT-RAO.
Testing the patch now. But with respect to the following I am not sure what you are asking. Is the question whether the usage by btr should use the template with spinloop=true? My first test will just add the patch that you suggest to move where srw_pause is called.
"Would this patch alone be sufficient to address the issue, or would we additionally have to enable the spin lock component of dict_index_t::lock?"
I don't think MySQL adjusts the value based on CPU architecture but I prefer the MariaDB approach.
The adjusted value should be written to the DB error log, exposed as a variable or in SHOW status output. I'd rather not have to use gdb to figure this out in production.
Recent upstream InnoDB doesn't read or write memory in the renamed ut::random_from_interval_fast. It uses my_timer_cycles() as the somewhat random input. I am not suggesting that MariaDB changes in this regard.
Thank you. I’m asking whether the second patch (in my previous comment dated 2024-06-03) alone is sufficient for addressing this, or whether the first patch (in an earlier comment 2024-05-20) is also needed.
I filed https://github.com/MariaDB/server/pull/3302 for implementing MDEV-19929. An architecture-specific status variable could be more useful, and in fact I do not see much reason against making it settable.
I see that there exists no simple machine instruction mapping of my_timer_cycles() to some exotic or obsolescent ISA, such as ARMv7 or older, MIPS, or SuperH. If there is no vsyscall implementation of gethrtime(), it could be expensive. If that function is not implemented, the constant value 0 would be returned. The MariaDB fork of InnoDB does use that function for choosing a shard in ib_counter_t or ulint_ctr_64_t, with a run-time fallback in get_rnd_value() of replacing the value 0 with pthread_self(). That condition I think we should optimize away and move the fallback logic to the mysys layer, say, in a my_rnd_value() function. For this use, should we actually prefer rdrand to rdtsc whenever it is available? The answer appears to be a big fat no.
For the record, I checked the following program with gdb:
#define _GNU_SOURCE
|
#include <unistd.h>
|
int main() { return gettid()+gettid(); } |
I added two calls because the first one would adjust the Procedure Lookup Table (PLT), which would obfuscate the debugging a little. On the second call, the gettid@plt simply jumps to __GI_gettid in /lib/x86_64-linux-gnu/libc.so.6:
mov $0xba,%eax
|
syscall
|
ret
|
Based on this, there is no vsyscall (linux-vdso.so.1) implementation of gettid() for AMD64, although it would seem to be rather trivial to implement. For the sharded counter, we would be happy with anything that would return a reasonably unique thread identifier. I think that on this architecture, we should actually have a good enough thread identifier in the fs register. In MDEV-21212 we had experimented with thread_local, but that particular approach did not seem to work back then.
Marko - for
"Thank you. I’m asking whether the second patch (in my previous comment dated 2024-06-03) alone is sufficient for addressing this, or whether the first patch (in an earlier comment 2024-05-20) is also needed."
After tests that use both patches then I can repeat tests only using the second patch. But to be sure about the patch names, the first is "use the spinloop=true template more often" and the second is "move srw_pause to do more spinning". I don't think the second will have a big impact in my case without also having the first because the btr contention I found prior to applying any patches is with the spinloop=false template.
mdcallag, I will wait for the results of testing the second patch (to srw_pause) without the first patch.
Related to my comments earlier today, I filed MDEV-34296 and MDEV-34297. Their impact will probably be less noticeable.
Using both patches, a small server and the Insert Benchmark:
1) Results with both batches were similar to only using the first patch -> doesn't solve problem
2) When wait_and_lock does the full 30 rounds with a call to srw_pause(100) each round the total time in wait_and_lock is ~200,000 cycles or ~7,000 cycles per round or ~70 cycles per call to PAUSE
3) When I increase innodb_spin_wait_delay from 4 (default) to 8 then the time in wait_and_lock increases from ~200,000 to ~400,000 cycles when it does the full 30 rounds
4) For MySQL 8.0.36 with innodb_spin_wait_delay=6 the average time in the busy-wait loop of rw_lock_sx_lock_func is ~300,000 cycles
5) The CPU in this case is AMD Ryzen 7 7735HS
I will repeat the test with both patches using innodb_spin_wait_delay =4 and =8 to confirm whether both patches help, and as part of that I will look at the PMP stack traces
Reading a bit more code, and my knowledge of how to do a spinlock is out of date but:
1) MySQL has a read barrier prior to the while loop (see here) but MariaDB does not. Instead, MariaDB does its first read of the lock word with std::memory_order_relaxed (see here) and I assume that means that MariaDB might initially be operating on a stale version of the lock word (I am searching Google as I write this via this search)
2) MySQL doesn't have a read barrier within the while loop between calls ut_delay and it isn't clear to me that things in ut_delay or ut::random_from_interval_fast imply a read barrier. With MariaDB the reads within the loop are done with std::memory_order_relaxed. So I wonder whether a read-barrier is needed there, but neither MySQL nor MariaDB do that. The Postgres equivalent, LWLock, is using compare-exchange (see here and also here) so I wonder if both MySQL and MariaDB can stay in that loop too long by reading stale values, subject to whether the CPU has a stronger memory model (like Intel) or weaker (like ARM).
3) In the MariaDB source here you use "*this" rather than the address of this->lock and I assume you expect *this to point to the same memory. My c++ skills are out of date, but that was just confusing to me.
This should have been point 4, but I think it is the most important so I split it off. With the code as written, before I moved srw_pause out of the else block, when the high bit is set (HOLDER) meaning the mutex is locked then the busy wait loop can just quickly iterate 30 times each time going through the if block and then falling through to where the thread goes to sleep. This isn't good.
Then I moved srw_pause out of the else block and that didn't help. Looking closer at this code, it seems reasonable that the change (lets call it patch 2) also won't be good because a common pattern will be:
1) enter the "if" block and read the lock word
2) call srw_pause at the end of the loop
3) do the next loop iteration, using the "if" block if the lock word has the locked bit set when read prior to srw_pause or the "else" block otherwise
And the problem here is that there is too much time between step 1 and step3 in the case there the locked bit (HOLDER) wasn't set when read in step 1. If you then are able to get lock the mutex in step 3 then you just waited for no reason in step 2. Or if you waited, another thread might lock the mutex in that window when you could have locked it.
So now I will try with this diff, in addition to the first patch that uses the spinloop=true variant in more cases. This diff makes the loop look like test & test & set.
Thank you for taking a deeper look at this. My understanding is that the os_rmb practically is a no-op on IA-32 or AMD64, if it is this implementation that is being used according to the start-up message:
#define HAVE_MEMORY_BARRIER
|
#define os_rmb __atomic_thread_fence(__ATOMIC_ACQUIRE)
|
#define os_wmb __atomic_thread_fence(__ATOMIC_RELEASE)
|
#define IB_MEMORY_BARRIER_STARTUP_MSG \
|
"GCC builtin __atomic_thread_fence() is used for memory barrier" |
I checked with https://godbolt.org that no AMD64 code at all is being emitted for this. This definition of os_rmb ought to be similar to writing
std::atomic_thread_fence(std::memory_order_acquire);
|
which when targeting a Total Store Ordering platform is a mere ‘compiler barrier’, preventing the compiler from reordering some operations, as explained in https://en.cppreference.com/w/cpp/atomic/memory_order. On ARMv8 both ‘acquire’ alternatives would seem to emit the instruction dmb ishld. Interestingly, multiple consecutive occurrences would translate into just one dmb ishld. A ‘release’ barrier would be dmb ish on the ARMv8.
As far as I understand, std::memory_order_relaxed should be sufficient as long as we only care about the contents of one cache line, or if we are accessing something within the critical section of some lock. If we care about consistently accessing multiple cache lines, we need something stronger than relaxed. The IA-32 and AMD64, similar to the SPARC, traditionally follow Total Store Order (TSO) model. With TSO, basically any loads and stores expect std::memory_order_seq_cst are indistinguishable, as you can see in https://www.cl.cam.ac.uk/~pes20/cpp/cpp0xmappings.html. Note that the examples do not cover read-modify-write operations such as std::atomic::fetch_add().
I’m looking forward to seeing your results with the revised fix.
From the Insert Benchmark on a small server with 1 client (low concurrency) and an IO-bound workload the latest change that combines the first patch (use spinloop=true more often) with my adjustments mentioned above to the busy-wait loop
... the problem has yet to be solved
From the Insert Benchmark on a small server with an IO-bound workload and 1 client
Results are inlined below and are easier to read in my gist that preserves formatting. The "v3" below means a binary that includes both patches and the change I hoped would fix it.
- IPS (insert rate) drops starting in 10.6, and CPU utilization (cpu/s) also drops so the server is just more idle – threads are not getting scheduled as fast as possible or spin less and go to sleep sooner
- from the two results with the "v3" changes the CPU utilization increases (cpu/s) as does CPU/insert (cpupq). And the "v3" change along with innodb_spin_wait_delay=8 has CPU/insert (cpupq) twice larger than "v3" with the default value for innodb_spin_wait_delay (=4). So all of the extra CPU overhead in the run with innodb_spin_wait_delay=8 went to busy-wait spinning. Which implies that the busy-wait loop isn't working as expected.
- with some basic instrumentation I confirmed that threads using the busy-wait loop are able to exit it in fewer than 30 rounds and the time in that loop is a function of the number of rounds executed
Legend:
- IPS - average rate for inserts/s during l.i1 (random writes) benchmark step
- cs/s - average rate for context switches/s from vmstat
- cpu/s - average rate for CPU utilization (us+sy) from vmstat
- cs/q - cs/s divided by IPS
- cpu/q - cpu/s divided by IPS and then multiplied by a constant
IPS cs/s cpu/s cs/q cpu/q dbms
1998 67162 16.2 33.62 .008096 10.4.33
2048 93293 13.2 45.55 .006444 10.5.24
1481 65430 10.6 44.12 .007154 10.6.17
1513 62899 14.1 41.56 .009297 10.6.17, v3
1453 56729 15.6 39.03 .017010 10.6.17, v3 and innodb_spin_wait_delay=8
For this setup I started another round of tests for the same DBMS versions I used above, but with PMP stack traces collected so I can get a better idea of what is going on.
From sysbench on a big server (2 sockets, 12 real cores/socket) and the microbenchmark (update-index) that shows the perf regression in 10.6 I collected and aggregated thread stacks collected by PMP. The results are here and the results are not good for the "v3" patch even though I think the change to the busy-wait loop is correct.
With the "v3" patch I see far too many threads going to sleep via syscall,srw_mutex_impl<true>::wait
So clearly something is wrong
When this round of tests finish, I will run another round with that uses my changes to the busy-wait loop, but doesn't use the first patch that makes the spinloop=true variant get used more often. I will also try a build with SUX_LOCK_GENERIC defined.
Defined SUX_LOCK_GENERIC, then I look at preprocessor output and I see this which is good:
typedef pthread_mutex_wrapper<true> srw_spin_mutex;
typedef pthread_mutex_wrapper<false> srw_mutex;
But I also see this which makes me wonder whether defining SUX_LOCK_GENERIC prevents usage of the custom code added in 10.6
template<bool spinloop>
class ssux_lock_impl final
{
srw_mutex_impl<spinloop> writer;
class ssux_lock
{
PSI_rwlock *pfs_psi;
ssux_lock_impl<false> lock;
The SUX_LOCK_GENERIC is for those platforms where no futex like system call has been implemented; after MDEV-26476 the most prominent one is macOS. With SUX_LOCK_GENERIC, some functionality will be limited. For example, lock_sys_t::hash_latch::wait() should become a new bottleneck for lock_sys.rec_hash, and there is only a pure spinlock option for buf_pool.page_hash (see page_hash_latch::read_lock_wait()). Also sizeof(buf_block_t) would grow quite a bit; I had managed to roughly halve its size between 10.2 and 10.6.
My implementation of rw-lock or the S/U/X lock divides the lock into two components, each of which have their own futex wait queue in the operating system kernel. The first component is a mutex, and the second component is a rw-lock. An exclusive lock (X) maps to (X,X), that is, exclusively locking both components. A shared lock (S) maps to (Ø,S), that is, only acquiring a shared lock on the second component. An update lock (U), which called SX in MySQL 5.7, needs to map to (X,Ø) or (X,S), that is, acquiring the mutex component and possibly acquiring a shared lock. I seem to remember that it currently is (X,S); it could be simplified if that is the case.
I think that the wait for a read lock can be optimized in the spinloop=true case:
template<bool spinloop> |
void ssux_lock_impl<spinloop>::rd_wait() |
{
|
for (;;) |
{
|
writer.wr_lock();
|
bool acquired= rd_lock_try(); |
writer.wr_unlock();
|
if (acquired) |
break; |
}
|
}
|
For the spinloop=false case it makes sense to wait for the ‘writer‘ or ‘mutex’ component of the lock to be available. It seems to me that we could actually assert that acquiring the second component succeeds each time.
For spinloop=true we had better implement some specialized logic that attempts to lock only the second component for a while, before falling back to writer.wr_lock(), incrementing the lock word, and writer.wr_unlock().
I tried a few more variations, but results are still bad. Data below is also here with good formatting.
This is from IO-bound Insert Benchmark with one client on a small server and from the l.i1 benchmark step that does random inserts and deletes.
Legend:
- IPS - inserts/s
- cs/s - context switches /s from vmstat
- cpu/s - CPU utilization from vmstat, sum of us + sy
- cs/o - cs/s / IPS
- cpu/o - (cpu/s / IPS) * large_constant
{{IPS cs/s cpu/s cs/o cpu/o version
1998 67162 16.2 33.6 8096 10.4.33
2048 93293 13.2 45.6 6444 10.5.24
1481 65340 10.6 44.1 7154 10.6.17
1513 62899 14.1 41.6 9297 10.6.17 with patch to use spinloop=true and rewrite of busy-wait loop
1453 56729 15.6 39.0 10701 10.6.17 same as above and innodb_spin_wait_delay=8
1529 63838 13.5 41.8 8835 10.6.17 with rewrite of busy-wait loop and innodb_spin_wait_delay=8
1447 56338 15.7 38.9 10819 10.6.17 with patch to use spinloop=true and SUX_LOCK_GENERIC defined and innodb_spin_wait_delay=8
1541 63488 13.6 41.2 8823 10.6.17 with SUX_LOCK_GENERIC defined and innodb_spin_wait_delay=8}}
I filed https://github.com/MariaDB/server/pull/3317.
The U lock indeed was covering more than just the "mutex" component. I improved the spin loops based on your experiment, and also rewrote ssux_lock_impl<spinloop>::rd_wait().
It is possible that with these improvements, enabling the spin loops on dict_index_t::lock is not helpful, given that there could now be significantly fewer context switches related to buf_page_t::lock. Therefore, I would like you to test that separately (baseline, the two changesets, and all three changesets).
It occurred to me that there is one more optimization possibility in ssux_lock_impl<spinloop>::rd_wait(). I will post a comment to https://github.com/MariaDB/server/pull/3317 about that.
What changes can be tested? Naming the diffs here:
- always-pause : my diff that changes the busy-wait loop in ::wait_and_lock
- more-spinloop : your diff that changes ssux_lock_impl<false> -> ssux_lock_impl<true> in two places
MDEV-34178- your pending PR to simplify U-lock code, also known as PR 3317, which includes both the always-pause and more-spinloop diffs
I assume the things to test are:
1) as-is : 10.6.17 unchanged
2) all-three : always-pause + more-spinloop + MDEV-34178
3) only-two : always-pause + MDEV-34178 (excluding the more-spinloop diff)
My comment was referring to the 3 change sets (commits) that were introduced in the initial version of https://github.com/MariaDB/server/pull/3317. I will revise it with my additional idea and run some performance tests myself. There is also MDEV-32176 that could be interesting to test.
https://github.com/Dmitree-Max/sysbench-iibench does not appear to be compatible with the Sysbench that is packaged in Debian, so I conducted some simple 64-thread, 120-second oltp_read_write tests on my dual-socket workstation (2×2×10 threads), with the data stored on NVMe. I tested with an innodb_log_file_size that is larger than the final LSN on server shutdown, so there would be no checkpoint flushing during the workload. The loadavg during the test was close to 60.
I got somewhat mixed results. For a case where the data fits in the buffer pool, the spin loop on index_lock appeared to slightly improve the throughput. For a slightly I/O bound case (buffer pool about 50% to 75% of the data size), it was the opposite: 15383.64tps without the spin loops and 15312.97tps with them. The regression is less than 1%. I think that we would benefit from running a broader selection of benchmarks, on dedicated hardware.
I ran one more test, with the original spin loop logic and with a smaller buffer pool, and only simplifying the U locks: 15312.60tps. Not a big difference, so running some broader tests on some dedicated servers would definitely help.
There currently are 4 change sets in https://github.com/MariaDB/server/pull/3317; this revision to the spin loops being the top. I think that it would be interesting to test the following:
- the base 10.6 revision (alternatively, you can reuse the results from whatever 10.6 revision you already have tested, but apply the following changes to test 2 further variants)
- all changes of PR#3317, and
- all changes, except the change that enables the spin loops
I always compile sysbench from source so it uses the client libraries that I also compiled. I also have never used that iibench variant, but I am glad it exists.
I think that the patch groupings I plan to test match what you described in the previous comment – first bullet point is "as-is", second bullet point is "all-three" and third bullet point is "only-two".
Results for the latest patch(es) are not good. But it will take a few days to get all results from the big server.
On a big server (2 sockets, 12 cores/socket) I ran sysbench with 16 threads and a cached database. Results for as-is, only-two and all-three (using names from above) were the same with one exception. On the update-index microbenchmark, the only-two build only gets ~2/3 of the throughput compared to as-is and all-three. But tests need another 1 or 2 days.
On a small server (8 cores) I ran IO-bound Insert Benchmark with 1 client and results for as-is, only-two and all-three were similar. Some iostat and vmstat results are here for the l.i1 benchmark step (random writes) for which there is a regression. This has results for 10.5, 10.6 and then 10.6 with a few different patches. The interesting thing is the context switch rate (cs/s) in 10.6 is about 2/3 of the rate in 10.5 while the rate of context switches per operation (cs/q) doesn't change as much. So something in 10.6 is slower about letting threads run when they are ready to run – see here for 10.5 and here for 10.6.
Unless you are building with cmake -DPLUGIN_PERFSCHEMA=NO, my improvement of psi_wr_lock() could be helpful. I also realized that my revised rd_wait() was suboptimal and incorrect, so I revised it further.
Tests on the small server with the Insert Benchmark are still running to include the latest updates to PR 3317.
I tried the updated PR on a big server (2 cores, 12 cores/socket) using sysbench and the the problem didn't go away. Although on this server, the regression starts in 10.5 not 10.6, so the mutex/rw-lock changes are not the suspect.
For results see here
I don't use -DPLUGIN_PERFSCHEMA=NO
marko Very nice improvement! I have carefully checked all the 4 commits and things look alright functionally and is expected to improve performance. Not sure if it could pull up the reading for mdcallag tests fully but should improvement things overall.
I can start another round of tests in a few days but ...
1) I wrote a few comments above from 5 days ago (see here) that I tested the updated version of the patch and it didn't fix the problems I see
2) Do you have any tests on your side to indicate that things are better? If not, then life is much harder for Marko. It should be easy for him and others to confirm their performance changes are good for performance.
mdcallag, I may have misinterpreted your previous comment that things seem to be improving a bit. In the highlighted result the only thing that seems to regress from 10.5 (column 3) is the update-one_range=100. Everything else seems to be better compared to 10.5. There does not appear to be a column for plain 10.6 results.
The regression from 10.4 to 10.5 (or 10.4 to 10.6) needs to be studied separately.
I hope that axel can schedule some performance tests soon.
I get confused two because there are 3 problems and my focus has been on two of them:
- problem 1 - extra read IO from storage for redo log (have not spent time on this recently)
- problem 2 - sysbench perf regressions on big server that arrive in 10.5
- problem 3 - IO-bound Insert Benchmark perf regressions on small server that arrive in 10.6
Soon I will have some results for IO-bound Insert Benchmark on the big server. It might be that the 10.4 -> 10.5 perf regressions on the big server dominate the 10.5 -> 10.6 problems. Or it might be that the 10.5 -> 10.6 problems with the Insert Benchmark don't occur on the big server. I don't know yet.
But my long open request is for benchmark results from your side that either reproduce these problems or fail to reproduce them.
Second request - can someone give me the git URL to the point in time from which I should compile MariaDB to re-test?
Your problem 1 is MDEV-33894 (reintroducing innodb_log_write_ahead_size). I got some rr replay to study for some stress test failures, mostly related to concurrent SET GLOBAL innodb_log_file_size). I think that it should be in a good enough shape for your testing. That would be pull request 3327. This one (improving the 10.6 futex-based srw_lock and ssux_lock) is pull request 3317.
According to some preliminary results that axel shared with me, enabling the spin loops on dict_index_t::lock does significantly improve the throughput in some workloads, but it also can cause regressions for others. Based on recent experience in MDEV-32374, I think that this may also depend on the CPU implementation. I ended up enabling the spin loops.
The cmake -DPLUGIN_PERFSCHEMA≠NO bug only affected the futex-based rw-locks on POSIX-like platforms (not Microsoft Windows). The Microsoft SRWLOCK or the POSIX rw_lock_t were not affected. By the way, on GNU/Linux on x86-64, both rw_lock_t and mysql_mutex_t (including the PERFORMANCE_SCHEMA tag) are 56 bytes. Their futex-based counterparts would be 8 or 4 bytes.
I expect axel to share some performance results once the test battery has run to completion.
I think that the mapping of the remaining trouble is as follows:
- problem 1:
MDEV-33894(10.11+ lost innodb_log_write_ahead_size) - problem 2: MDEV-33966 (it does mention 10.5 as well)
- problem 3: (maybe a follow-up ticket will be needed)
I think that a reasonable next step could be to merge this fix from 10.6 to 10.11 and to update MDEV-33894 based on that, and for mdcallag to test that. For write workloads, 10.11 is expected to perform better than 10.6 thanks to the removal of the log_sys.mutex bottleneck in MDEV-27774.
mdcallag, we may have to re-disable or adjust the spin loops on dict_index_t::lock, because the improvement in some test scenarios or workloads might not compensate for the regressions in others.
I have merged these change to 10.11 and updated the MDEV-33894 pull request 3327 (branch 10.11-MDEV-33894). This should allow your testing to move on a bit.
To be clear, is it OK for me to try https://github.com/MariaDB/server/commits/10.11-MDEV-33894 ?
I can do that for both big and small servers using both sysbench and the Insert Benchmark, but the focus is on the small server with an IO-bound Insert Benchmark because that is where the problems were observed in 10.6 related to the rw-lock & mutex changes.
I have run the regression test suite on two commits in branch 10.6-MDEV-34178 and compared it to recent 10.6. Commit bcfc2e50243 (blue) was run on different hardware that seems to be a bit slower. It shows roughly the same performance than vanilla 10.6. Commit 96b39fb6cbe (green) has some additional spinlocks enabled. This one has improvements for 9010, but regressions in other tests (writes, TPC-C). It seems the spinlocks need tuning.
Attached: MDEV-34178_g1_g2.pdf![]()
mdcallag, yes, I think that we should move on to MDEV-33894 as the next step. Hopefully it will bring a more obvious improvement.
This finds nothing for me: git branch -a | grep 34178
I can test 10.6-MDEV-34178 once that reaches public github
For the results in the pdf above, can you share a few more details on the server and workload?
mdcallag this branch was on public github, but it was merged into 10.6: 5b26a07698b92f58e5d1f55c7929b0e25d1a586b
The test cases are here: https://github.com/hgxl64/mariadb-benchmarks/tree/master/regressiontest. The command line used was
cd .../regressiontest
|
. profile
|
run_community_git.sh --branch 10.6-MDEV-34178 --commit bcfc2e50243
|
The hardware this was run on is a Supermicro machine with this cpu:
g1:~/regressiontest$ lscpu
|
Architecture: x86_64
|
CPU(s): 12
|
On-line CPU(s) list: 0-11
|
Thread(s) per core: 2
|
Core(s) per socket: 6
|
Socket(s): 1
|
NUMA node(s): 1
|
Vendor ID: GenuineIntel
|
CPU family: 6
|
Model: 158
|
Model name: Intel(R) Xeon(R) E-2236 CPU @ 3.40GHz
|
Stepping: 10
|
CPU MHz: 4500.027
|
CPU max MHz: 4800.0000
|
CPU min MHz: 800.0000
|
BogoMIPS: 6799.81
|
this config was used to distribute the cpu between MariaDB and sysbench
g1:~/regressiontest$ cat config/g1
|
#
|
# specific for host g1
|
#
|
config_variable CPU_MASK_SYSBENCH --physcpubind=8-11
|
config_variable CPU_MASK_MYSQLD --physcpubind=0-7
|
config_variable NCPU 8
|
config_variable SYSBENCH sysbench-eh
|
Thanks for the info. I will add a 10.6 build from this point in time soon (a few days).
With respect to the HW setup. I disable hyperthreads, while you enable it. I don't think you are doing it wrong, but from past efforts results had a bit less variance for me when HT was disabled.
I also don't pin sysbench clients and MariaDB to separate cores. In a perfect world I would have separate hosts for the benchmark client and DBMS with a predictable network between them but my world isn't perfect. I have yet to run tests to determine whether pinning is needed for my use cases.
I am not claiming that you are doing it wrong, I just wanted to point out the differences. And it is good that we are doing things different in this regard – we get more coverage from that.
Added results from another regression test run. This one uses the old suite and was run on cheetah01 (16core/32HT, 128G RAM, SATA SSD, Ubuntu18.04). This suite was already in use for 10.2.44 (~2 years ago). It shows nearly no difference between vanilla 10.6 and MDEV-34178. And 10.2.44 is some times slower, some times faster.
Attachment: MDEV-34178.pdf![]()
a very measurable difference between t_writes-innodb-single-2, on some concurrency. if you increase threads beyond 256, it would probably be scaling even worse than 10.2
Even worse than than is t_oltp-innodb-single-2 . going from 180 ktps to 130ktps is not "almost" the same, it is 30% worse. For the first time, not even in 10.2, it shows negative scalability
t_writes-innodb-multi-2 also shows negative scalability, for the first time.
By sysbench I assume you mean the classic oltp_read_write.lua
I don't see big regressions for it (oltp_read_write.lua) from 10.2 -> 10.11
https://gist.github.com/mdcallag/17c17419674019fb41b5af1ffe655504#file-gistfile1-txt-L52-L53
I do see big regressions for other microbenchmarks and index-update is the worst where 10.2 gets about 3X more updates/s than 10.6
https://gist.github.com/mdcallag/17c17419674019fb41b5af1ffe655504#file-gistfile1-txt-L54
I am refactoring the code to move the template<bool spinloop> parameter from data types to member functions. This will allow some more flexibility, such as introducing a function pointer for the currently used dict_index_t::lock acquisition methods. Similar to MDEV-33515, we might want to introduce a parameter such as SET GLOBAL innodb_index_spin_loops that would be 0 by default, that is, a non-spinning variant would be used.
We should also keep in mind that there are two components in the index tree latches: the ‘mutex’ for the writer and the ‘rw-lock’ for the readers. It could make sense to enable the spin loops for x_lock(), u_lock(), s_lock() independently. Intuitively, we might think that ‘pessimistic’ B-tree operations that require the writer ‘mutex’ are usually preceded by reads that will already have populated the buffer pool, and therefore it should be unlikely that a ‘pessimistic’ operation has to wait for a file operation. Multi-page operations like btr_cur_t::search_leaf() should be more likely to involve page reads. It might make sense for dict_index_t::lock::s_lock() to spin, hoping that the ‘pessimistic’ operation be completed and the x_lock() released quickly. The x_lock() perhaps had better suspend itself straight away some readers exist. Whether x_lock() and u_lock() should spin on the writer ‘mutex’ is yet another decision. We could also expose this as member function template parameters. For x_lock() there are two possible spin loops, regarding writer and readers. Based on profiling data of futile spin loops, we could theoretically disable the spin loops in those call sites where we think it is unlikely to help. But, the impact of such tweaking could be highly dependent on the workload.
I filed MDEV-34431 and pull request for the refactoring. It would be useful to get some stack traces of the most prominent spin loops on dict_index_t::lock.
Marko - is this a request for me? I still don't know how to tag people here.
Switched from XFS to ext4, although that shouldn't matter here, and repeated cached sysbench with 4 and 16 clients on the 24-core (2-socket, 12 cores/socket) server. Results are here and my summary is that modern MariaDB has problems with concurrency.
- The results for modern MariaDB relative to older MariaDB are worse at 16 clients than at 4 clients
- The biggest regression are from 10.4 -> 10.5
Comparing a few of the microbenchmarks:
- update-index is the worst case, in 10.11 relative QPS is 1.11 at 4 clients vs 0.44 at 16 clients
- read-write with range=100 (the "classic" sysbench workload), in 10.11 relative QPS is 0.96 at 4 clients vs 0.85 at 16 clients
mdcallag, maybe you can share here the exact my.cnf and exact sysbench invocation, for the test cases in question?
I do not run benchmarks Linux, so I can't use the "bunch of bash scripts", i.e your framework . But I do have a Windows, and port of sysbench, Vtune, can create flamegraphs with 4 different programs, that so I can give it a try here. Generally, I think it makes sense to document exact server and sysbench parameters, in performance related bug reports, since everyone understands them, and it makes it simpler to reproduce problems.
Command lines, my.cnf for 10.11.7 and a few notes are here
You will need to clobber some of the upstream sysbench Lua scripts with the ones in this directory.
Now it is my turn to ask. Do you have any results from the same benchmark run across multiple MariaDB LTS releases (10.2, 10.3, 10.4, 10.5, 10.6, 10.11, 11.4) as I have shared? At this point I assume my results are accurate and there have been serious regression for MariaDB's InnoDB going back to 10.5 or 10.4.
Thanks mdcallag! I did run update_index 10.4 against current 10.11 with your settings. I had to scale down factor 2, i.e half of the bufferpool, log_file_size, and sysbench table-size, since there is less memory on my PC. I did found a regression and filed MDEV-34458 based on my findings, since I was running it with cold bufferpool, and warming up (reading into bufferpool) took a very long time.
Now, to the results, 10.11 is actually faster for me, by ~14% if I fix the slow warmup MDEV-34458
by reverting 90b95c6149c72f43aa2324353a76f370d018a5ac
The results are
| version | tps | latency ms 95% |
|---|---|---|
| 10.4 | 43008.84 | 0.52 |
| 10.11 | 49075.17 | 0.36 |
Those numbers of course are not the full disclosure.
The workload is "bursty", and there are hiccups with tps going to 0 every now and then,whenever buffer pool flush happens, probably, either CPU or SSD is maxed out, like in the attached screenshot
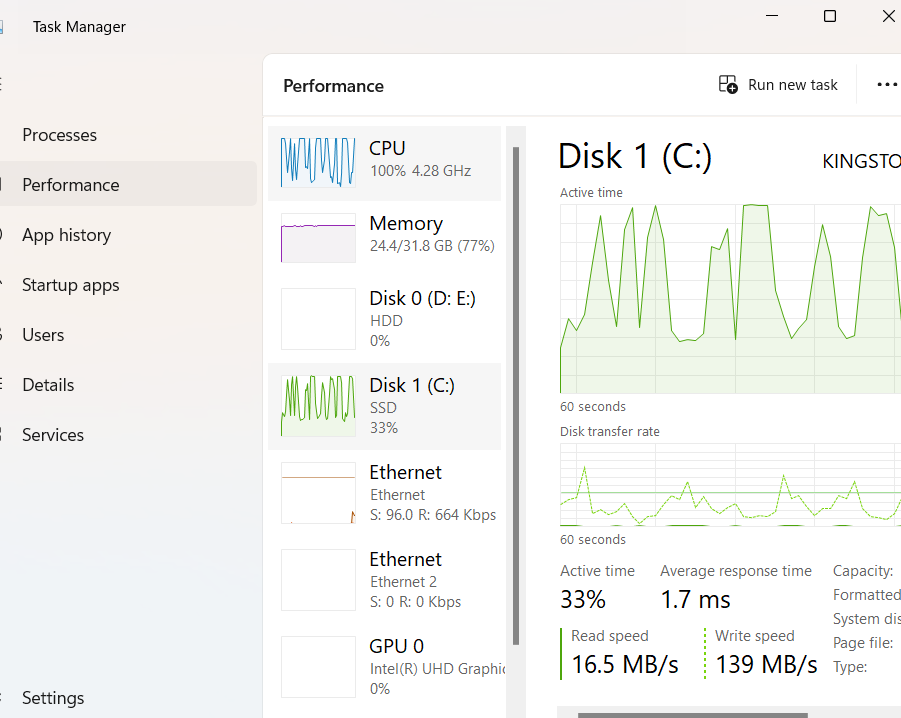
I'm attaching update_index_10.4.txt![]() and update_index_10.11.txt
and update_index_10.11.txt![]() for the full output.
for the full output.
As for request to run those benchmarks on supported released versions, axel would be the right guy to ask, and I believe he is already planning or doing it. Axel has better hardware, and he's benchmarking professional. While I'm an amateur, running sysbench as development aid mostly, but not in a structured fashion.
As for update_index, I run it quite often, but usually with all defaults. except bufferpool size and log_file_size, and mostly in-memory , i.e with data size equal half of bufferpool or somesuch. MAybe with innodb_flush_method=O_DIRECT on downlevel versions, if I'm on Linux.
With that, I did not notice a slowdown of update_index from 10.4, it is actually faster in in configurations I tried. It is a different benchmark from yours, it is barely touching bufferpool and flushing, mostly concurrency and log writing, but I think it improved starting with 10.5, especially on higher thread counts. As Marko mentioned, we never run xfs, that could have regressed, I almost never use innodb_log_file_at_trx_commit=2, and up to this benchmark, never tested binlog writing. I also forgot that sysbench distribution by default is not "uniform" ![]()
What size is your server and how many clients (threads, connections) did you use wlad?
Also
MDEV-34178(this issue) was opened for problems I see with an IO-bound Insert Benchmark with low concurrency on a small server. I have yet to repeat the benchmark on a large server- MDEV-33966 was opened for problems I see with a cached sysbench, especially update-index, on large servers (24 cores, 32 cores) with high concurrency (maybe 16+ threads on 24-core server, ~24 threads on 32-core server). I don't notice problems with sysbench on a small server. In fact, the results were excellent leading to a blog post that was well received by the community. And MDEV-33966 is open because I can't write such a blog post for MariaDB + sysbench on a large server, the results aren't good.
So I am confused about the result you provided. If sysbench is the issue, then the updates should go to MDEV-33966, but any reproduction attempt requires a larger server.
mdcallag, it is a 16 core Alder Lake, Intel64 Family 6 Model 151 Stepping 2 GenuineIntel ~3187 Mhz,
with 32GB RAM and KINSGTON SVNS 1000G disk , with my.cnf you shared in https://gist.github.com/mdcallag/26569df8fc3197dd5117e588fc383e1a, except I commented out paths and downsized bufferpool and redo log like this
innodb_buffer_pool_size=23G # from 45G
|
innodb_log_file_size=25G # from 50G
|
The sysbench command line is
sysbench --db-driver=mysql --range-size=100 --table-size=5000000 --tables=8 E:\marks_tools\sysbench.lua\lua\oltp_update_index.lua ...
|
while you were using
sysbench --db-driver=mysql --range-size=100 --table-size=10000000 --tables=8 /home/mdcallag/sysb/share/sysbench/oltp_update_index.lua ...
|
In the same snippet your shared, so there is half of the data compared to your benchmark.
I run benchmark with 16 threads, as you do, as you can see from the attached
update_index_10.11.txt![]() , and I am using --report-interval=1, and --histogram, since it provides more insight in what's going on, including periodic hiccups with tps=0
, and I am using --report-interval=1, and --histogram, since it provides more insight in what's going on, including periodic hiccups with tps=0
In other words, I scaled your parameters factor 2, bufferpool is half of the size, redo log is half of the size, --table-size is half of yours. because I do not have 64GB RAM, but 32GB RAM
It is not a small server, and I do own have anything larger, so I'm sorry, I can't reproduce this exactly.
Other people might have larger servers, but I have to work with what I got.
Is that 16 vCPUs (as in 8 real cores with HT enabled) or 16 real cores?
I wish the world, including myself, would agree on what to call these things - HW threads, vCPUs, etc – when HT is enabled on Intel or SMT is enabled on AMD.
On my servers with 8 real cores I mostly test with 1 thread. Sometimes I go up to 4. I have not tested at 8 threads on them so I don't know how bad the regression is there and I prefer to not enable SMT or HT on them to get 16 vCPUs. On my large servers with 24 or 32 real cores I definitely see big regressions at 16+ threads and not so much at 4 threads (and I don't have recent tests on them at 8 threads).
In the past you mentioned running with extra high thread counts (maybe up to 1024). I don't do that, it is great that someone else does (more coverage) but I usually avoid it because I usually find enough problems to document without over-subscribing (saturating) the CPU.
It is a real 16 cores, hyperthreading is off here. One peculiarity is that those cores are not equal, it is this hybrid architecture with efficiency and performance cores.
I do run extra high thread counts, especially when testing/looking for regressions with thread-handling=pool-of-threads - extra high concurrency is the reason it exists in first place. This allows to find small things, like mutex contention in MDEV-32176, sometimes more interesting architectural bugs, like spinning TTAS mutex around write and flush redo log already eats 20+% of the overall CPU time in log_write_up_to with 16 client threads, and this spinning contention only grows with number of threads. So far we scaled well, also on Axel's benchmarks, who runs one or two benchmarks on high threads, and I see no reason we would not continue like this.
Higher thread count benchmarks, especially with pool-of-threads is btw the use case for pinning server and sysbench to different CPUs, or OS scheduler gets confused.
Thanks for the fix for MDEV-33894 I was able to show that MariaDB is ~10% faster than MySQL on a medium server (16 cores). But those results also show a large increase in mutex contention (context switch rates) in 10.5 and 10.11 for some of the microbenchmarks. Either this or MDEV-33966 is the issue.
See https://smalldatum.blogspot.com/2024/07/sysbench-on-medium-server-mariadb-is.html
Results from the Insert Benchmark a c2d-highcpu-32 server with 32 vCPU, 16 cores (HT / SMT disabled), 64G RAM, Ubuntu 22.04 and storage is ext4 (data=writeback) using SW RAID 0 over 2 locally attached NVMe devices. For more results from upstream MySQL with InnODB see here. I tested MariaDB versions 10.2.44, 10.3.39, 10.4.34, 10.5.25, 10.6.18, 10.11.8, 11.4.2, 11.5.1 and 10.6.0. I also builds of 10.11, 11.4, 11.5 and 11.6 with the fix for MDEV-33894 (labeled as the builds as of July 7 2024). My usage of the Insert Benchmark is explained here.
Summary:
- MariaDB is getting slower over time (from 10.2 -> 11.4). The regression is large for writes and not as large for reads. The root cause for the regressions is likely the changes to InnoDB in MariaDB
- For modern MySQL (8.0.37) vs modern MaraiDB, MySQL gets ~2X more throughput for writes. For reads MySQL and MariaDB get similar troughput for queries on a cached workload. I can't judge MariaDB throughput for queries on the IO-bound workload because it fails to sustain the target background write rate.
- MySQL benefits a lot from the change buffer, modern MariaDB doesn't have it and I disable it for older MariaDB versions to make it easier to spot other perf regressions.
Results are here for a workload where the database is cached:
- using MariaDB 10.2 as the comparison base
- using MariaDB 10.6 as the comparison base
- using upstream MySQL 8.0.37 as the comparison base
Results are here for a workload where the database is larger than memory:
- using MariaDB 10.2 as the comparison base
- using MariaDB 10.6 as the comparison base
- using upstream MySQL 8.0.37 as the comparison base
Summary of the cached database results for l.i0 (load in key order, no secondary indexes):
- throughput drops in 10.3.39, 10.5.25, 10.11.8, see here.
- The throughput drop in 10.3.39 is from CPU overhead (see cpupq which is CPU per insert and increases by 1.5X), in 10.5.25 is from mutex contention (see cspq which is context switches per insert and increases by 9X). The vmstat and iostat metrics are here
- throughput is slightly worse with the fix for
MDEV-33894for 10.11 and 11.4 but those builds include other changes that are not in 10.11.8 and 11.4.2 and the vmstat metrics show more CPU overhead - throughput in upstream MySQL 8.0.37 is ~2X modern MariaDB (10.11, 11.4), see here. The CPU overhead (cpupq is CPU per insert) is 1.5X or more larger in MariaDB. The context switch rate (cspq is context switches per insert) is 4X or more larger in MariaDB. The metrics are here
Summary of the IO-bound database results for l.i0 (load in key order, no secondary indexes):
- throughput drops in 10.3.39, 10.5.25, 10.11.8, see here.
- The throughput drop in 10.3.39 is from CPU overhead (see cpupq which is CPU per insert and increases by 1.5X), in 10.5.25 is from mutex contention (see cspq which is context switches per insert and increases by 9X). The vmstat and iostat metrics are here
- throughput is slightly worse with the fix for
MDEV-33894for 10.11 and 11.4 but those builds include other changes that are not in 10.11.8 and 11.4.2 and the vmstat metrics show that with the fix there is more CPU overhead but the unexpected disk reads go away - throughput in upstream MySQL 8.0.37 is ~2X modern MariaDB (10.11, 11.4), see here. The CPU overhead (cpupq is CPU per insert) is 1.5X or more larger in MariaDB. The context switch rate (cspq is context switches per insert) is 4X or more larger in MariaDB. The metrics are here
Summary of the cached database results for l.i1 (write-only with secondary index maintenance):
- throughput drops in 10.5.25, see here
- the throughput drop in 10.5 is from CPU overhead is up by ~1.3X (cpupq is CPU per insert), context switch rate is up by ~17X (cspq is context switches per insert), write-amp is up by ~2.2X (wkbpi is KB written to storage per insert), see here
- throughput in upstream MySQL 8.0.37 is ~1.6X modern MariaDB (10.11, 11.4), see here. The CPU overhead (cpupq is CPU per insert) is ~1.15X or more larger in MariaDB. The context switch rate (cspq is context switches per query) is ~3X or more larger in MariaDB. The metrics are here.
Summary of the IO-bound database results for l.i1 (write-only with secondary index maintenance):
- throughput drops in 10.3 but then increases in 10.5, 10.6 and 11.4. Where there are increases the CPU overead (cpupq) and context switch rate (cqpq) have decreased, see the metrics
- throughput in upstream MySQL 8.0.37 is ~2.5X modern MariaDB, see here. Context switches (cspq is context switches per query) are ~4X larger in MariaDB. Write-amp (wkbpi is KB written to storage per insert) are ~2X larger in MariaDB. Reads (rpq is reads from storage per insert) are ~4X larger in MariaDB because there is no change buffer. Metrics are here.
Summary of the cached database results for qr100, qr500, qr1000 (range queries with concurrent writes):
- qrX means X writes/s/client where X is 100, 500 or 1000
- thoughput is steady until 11.5, then drops, see here. There is a slight increase in CPU overhead (cpupq is CPU per query), see here for qr100, here for qr500, and here for qr1000.
- thoughput in upstream MySQL 8.0.37 is similar to modern MariaDB, see here but write-amp (wkbpi is KB written to storage per write) is larger for MySQL, see here.
Summary of the IO-bound database results for qr100, qr500, qr1000 (range queries with concurrent writes):
- qrX means X writes/s/client where X is 100, 500 or 1000
- MariaDB 10.2, 10,3, 10.4 and 10.5 were unable to sustain the target background write rate (1000/s per client with 8 clients) which means they failed that benchmark step. The reason is probably because upstream MySQL used the change buffer and upstream MySQL was able to sustain the targets.
- for throughput in upstream MySQL 8.0.37 vs modern MariaDB, they are similar for qr100, upstream MySQL is ~10% faster for qr500 and while there is variance results are mostly similar for qr1000
- Metrics are here for MariaDB for qr100, for qr500 and for qr1000 and CPU overhead (cpupq is CPU per query) increases over time.
Summary of the cached database results for qp100, qp500, qp1000 (point queries with concurrent writes):
- qpX means X writes/s/client where X is 100, 500 or 1000
- MariaDB throughput drops in 10.3, 10.4 and 11.5. The CPU overhead (cpupq is CPU per query) increases in 11.5. The metrics are here for qp100, for qp500 and for qp1000.
- throughput in modern MySQL (8.0.37) is between 10% and 15% less than in modern MariaDB, see here because MariaDB uses less CPU per query, see cpupq for qp100, for qp500 and for qp1000.
Summary of the IO-bound database results for qp100, qp500, qp1000 (point queries with concurrent writes):
- qpX means X writes/s/client where X is 100, 500 or 1000
- no MariaDB versions were able to sustain the target background write rates for qp1000 (1000/s per client with 8 clients) which means they failed that benchmark step. The reason is probably because upstream MySQL used the change buffer and upstream MySQL was able to sustain the targets.
- MariaDB throughput drops in 10.3, 10.4, 10.6 and 11.5. In some cases the CPU overhead increased. The metrics are here for qp100, for qp500 and for qp1000,
- throughput in modern MySQL (8.0.37) is ~15% less than in modern MariaDB for qp100 and ~20% less for qp500 because MariaDB uses less CPU per query. The metrics are here for qp100, for qp500 and for qp1000.
mdcallag Can you please answer my email or here regarding start parameters for Insert Benchmark iq.sh?
Kirill - I am not sure what you mean by parameters.
The my.cnf I have been using for small server (8 cores, 32G RAM) with MariaDB are here.
An example command line from such a small server to run the benchmark is: bash ra.sh ~/d . nvme1n1 no 0 1 1800 yes 30 50
It is possible to run the insert benchmark without using my helper scripts.
Note:
- those scripts (iq.sh, np.sh, ra.sh, ra1.sh) are messy. Anyone trying to use them must be brave (or must be me)
- but those scripts also make it easier for me to compare many different configs and/or different DBMS and then generate reports like these
Hi mdcallag !
I created ~/d folder and tried to run your test as: bash ra.sh ~/d . sda2 no 0 1 1800 yes 30 50
Attached to this jira are files test_output1.txt and test_output_sudo2.txt.
Looks like test requires some data structure under ~/d and also in /data/m/fbmy/
Can you please advise how to prepare the data for test?
Thanks,
Kirill
That command line assumes databases are installed in ~/d, but that can be changed on the command line.
The scripts also assume that the database directory is in /data/m – /data/m/pg for postgres, /data/m/my for MySQL, /data/m/fbmy for MyRocks
That can be changed by editing r.sh.
For me the database dir is in /data because I use a separate storage device for databases as those tend to wear out in a few months and must be replaced, but I don't want to lose other files when that happens.
mdcallag For 'databases' - are they populated with any data? If yes where can I find it?
Or have you mentioned database binaries in ~/d and database data folder in /data... ?
The scripts do the "prepare" phase with sysbench which loads the database.
You invoke r.sh
And r.sh can call cmp_in.sh here
Then cmp_in.sh can call all_small.sh here
Then the first time that all_small.sh calls run.sh it passes the value of "$setup" and when that is non-zero (see cmp_in.sh which passes the value 1 for it) then run.sh does the prepare phase with sysbench
Hi mdcallag! Sorry to bother you again.
I have only two days before my vacation and it would be great if we will be able to resolve the task to run your test at our machine before it.
Can you please provide detailed answers for my questions?
1. What should be prepared before run your code?
a) user? it looks like some login/psw are hardcoded in your test.
b) what do you mean as 'databases are installed in ~/d'? as I see your code creates and deletes data under this folder so it doesn't look to be standard MDB data folder. Please let me know what should I create in this folder.
c) for /data/m, should I use /data/m/my also for MDB InnoDB or any other subfolder? again is it standard MDB data folder under /data/m/.../ or any else?
d) how it correlates with ~/d?
e) to run only MDB test should I comment/delete some of your code?
2. I have run /mytools/bench/sysbench.lua/r.sh 100 100 100 100 sda2 0 0
but it fails
output is in attached test_output3.txt
3. May we connect via slack, zoom or some messenger for faster communications?
4. May we have a session to start your test at our machine?
Thanks in advance.
> 1. What should be prepared before run your code?
> a) user? it looks like some login/psw are hardcoded in your test.
> b) what do you mean as 'databases are installed in ~/d'? as I see your code creates and deletes data > under this folder so it doesn't look to be standard MDB data folder. Please let me know what should I > create in this folder.
A possibly incomplete list of assumptions:
- username = "root", password = "pw"
- my Lua scripts are to be used see here. These are similar to upstream but there are a few differences. I haven't tried to push them to upstream.
- database code (binaries, help files, libs, etc) installed under $some_directory and $some_directory is a command-line arg to r.sh. I use ~d and a CMake file I use to build MariaDB to be installed like that is here. Because I do tests for Postgres, MySQL and MariaDB they all get installed in ~/d. An example of currently installed builds on one of my servers is here and I try to be careful about naming. For example I use prefixes: 'ma' for MariaDB, 'my' for MySQL, 'pg' for Postgres. I also encode the version, (sometimes) git hash, (sometimes) date of the build, and info on the CMake build type ('rel' = Release, 'rel_o2nofp' = Release but with -O2 and -fno-omit-frame-pointer)
- database directory (redo log, data files, etc) is one of /data/m/pg for Postgres, /data/m/my for MySQL, /data/m/fbmy for MyRocks. This can be changed by editing r.sh
- assuming a database is installed in ~/d/$version (CMAKE_INSTALL_PREFIX = ~/d/$version) then ~/d/$version must also contain two files – ini.sh to initialize from scratch a database and down.sh to shut one down. Note that these files hardcode the data directories (/data/m/...). And examples of ini.sh and down.sh for MySQL 5.7 are here and for MariaDB 10.6 and 10.11 are here
> c) for /data/m, should I use /data/m/my also for MDB InnoDB or any other subfolder? again is it standard MDB data folder under /data/m/.../ or any else?
I use /data/m/my for MariaDB and MySQL. That directory gets wiped by my script at the start of a test so be careful.
> d) how it correlates with ~/d?
/data/m/... is for database files (redo, *.ibd, transaction logs)
From one my.cnf ...
tmpdir=/data/m/my
log_bin=/data/m/my/binlogs/bl
datadir=/data/m/my/data
innodb_data_home_dir=/data/m/my/data
innodb_data_file_path=ibdata1:512M:autoextend
innodb_log_group_home_dir=/data/m/my/txlogs
/d is for database binaries, etc ( -DCMAKE_INSTALL_PREFIX=/d/my8037_rel for example)
Unfortunately, we have overloaded the word "database".
> e) to run only MDB test should I comment/delete some of your code?
First, edit this so that only cmp_in.sh is called, or add your own cmp_ma.sh
Then assuming you use cmp_ma.sh, edit this section so there is one line per $version.$config that you want to test where $version is a subdirectory of ~d (assuming you used ~/d) and $config is ~/d/$version/etc/my.cnf.
From this code there is "ma100524_rel_withdbg.z11a_c8r32" which means
- ma100524_rel_withdbg -> MariaDB 10.5.24, installed in ~/d/ma100524_rel_withdbg, and CMAKE_BUILD_TYPE was RelWithDebInfo
- z11a_c8r32 -> uses ~/d/ma100524_rel_withdbg/etc/my.cnf.cz11a_c8r32. To be clear that this is not a typo, just a bad decision I made years ago, is that the "z11a_c8r32" is the suffix of the my.cnf file to be appended to "my.cnf.c" to get the ful name of the file. By bad decision I mean the ".c" part.
> 2. I have run /mytools/bench/sysbench.lua/r.sh 100 100 100 100 sda2 0 0
> but it fails output is in attached test_output3.txt
I ignore all but the first error.
- Do you have something installed in /home/kperov/d/fbmy5635
- I assume you didn't edit r.sh and the end still has multiple lines that call cmp_pg.sh and cmp_rx.sh. See my comments above.
> 3. May we connect via slack, zoom or some messenger for faster communications?
Speaking via Zoom is great for me
> 4. May we have a session to start your test at our machine?
I am not sure what this means. If you want me to login to some host, then I can share my public key with you or you can share other login credentials.
It might be easier just to start with what all_small.sh does.
Run tests in a sequence that is interesting. For me that means:
- load database
- after the load let the database reduce writeback debt
- run read-only tests
- run write-mostly tests
- reduce writeback debt
- run read-only tests
- run a few more write-only tests
You can follow this approach without buying into all of my conventions about where things are installed and where the database data files exist. You can avoid using my Lua files, or any of my shell scripts. This approach is valuable while my shell scripts are a bit of a mess.
Note that I run read-only tests before and then again after the write-mostly tests because most storage engines get slower after writes because there is b-tree fragmentation or something similar with an LSM.
The "reduce writeback debt" has evolved over time. For MyRocks that means to flush the memtable and then empty the L0 (compact it into L1). For Postgres and jInnoDB that means to force page writeback. The code is here
Oh no, I got confused and answered many questions about sysbench rather than the Insert Benchmark.
At a high level my answers don't have to change:
- if you have a host to which I can login and set things up then I can try that
- my scripts are messy and will be hard for others to use
- database code is installed in subdirectories of ~/d and data files in /data/m/my, /data/m/pg, ...
- you don't have to use my scripts to use the Insert Benchmark
For my usage of the Insert Benchmark I use a sequence of steps that is useful to me, see here
- l.i0 -> load database
- l.x -> create secondary indexes
- l.i1, l.i2 -> do inserts + deletes as fast as possible
- wait for writeback debt to reduce (see above)
- qr100 -> do range queries as fast as possible with 100 inserts/s done in the background
- qp100 -> do point queries as fast as possible with 100 inserts/s done in the background
- qr500 -> do range queries as fast as possible with 500 inserts/s done in the background
- qp500 -> do point queries as fast as possible with 500 inserts/s done in the background
- qr1000 -> do range queries as fast as possible with 1000 inserts/s done in the background
- qp1000 -> do point queries as fast as possible with 1000 inserts/s done in the background
ra.sh calls ra1.sh and you need to edit ra1.sh to only invoke the (DBMS version, config) that you want to test – see here
But an alternative is to just start with these command lines and build up your scripts around them so you can avoid all of my assumptions and shell scripts. This example is from a setup that uses 1 client and 1 table. Depending on the benchmark step there are up to 3 concurrent connections per client (1 for queries, 1 for inserts, 1 for deletes).
Command lines from a run with 10 clients is here and note there are 10 Python processes per benchmark step (one per client)
I suspect the alternative – just start with my command lines, build your own scripts around them – will work better for you.
mdcallag Hi Mark! Thank you very much for your clarifications, I was able to run tests and get results.
Can you please provide me some more information about Insert Benchmark?
In command lines here: https://gist.github.com/mdcallag/c55d7ac3b4796545894773359e1894d0 , I see some numbers, but in test description you wrote you used 800M rows.
What were real numbers for initial rows and every test for the results you published?
How much time a test for one DB takes at your machine?
Thanks in advance!
@kirill.perov@mariadb.com I run the Insert Benchmark in two ways:
- cached - data fits in DBMS cache
- IO-bound - data is many times larger than memory
I have test servers with 16G, 32G, 64G and 128G of RAM so the number of rows for both cached and IO-bound depends on the amount of RAM in a server.
For time to run the test, the benchmark is a sequence of steps.
- l.i0 - loads database before secondary indexes are created, time to run is a function of the number of rows to load
- l.x - creates 3 secondary indexes per table, time to run is a function of the table size
- l.i1, l.i2 - does random inserts & deletes, time to run is a function of the number of writes (see --max-rows here). Another factor is for "time to run" is the value of --rows-per-commit and I use 50 for l.i1 vs 5 for l.i2 because the time run is larger when --rows-per-commit is smaller
- qr100, qp100, qr500, qp500, qr1000, qp1000 - (see here) the time to run is fixed. I usually configure this to be either 1800 or 3600 seconds per benchmark step. The time to run per step is:
--max-rows / --inserts-per-second
For a given benchmark step from above, the number of writes done in that step is fixed. That is by design, but also explains the possibly odd math I show above to determine how long qr100, qp100, ..., qp1000 will run
Time to finish estimates assume:
- sync_binlog=0, innodb_flush_log_at_trx_commit=2
- qr100->qp1000 each run for 1800 seconds
From a small server (8 cores, 32G RAM)
- with a cached workload, 20M rows, 1 client it takes ~5 hours to finish
- with an IO-bound workload, 800M rows, 1 client it takes ~8 hours to finish.
From a large server (48 cores, 128G RAM)
- with a cached workload, 10M rows/table, 20 clients it takes ~12 hours to finish.
- with an IO-bound workload, 200M rows/table, 20 clients it takes ~16 hours to finish
Now I have results from a large server (ax162-s from Hetzner, 48 cores, AMD SMT disabled, 128G RAM, 2 NVMe devices with SW RAID 1, insert benchmark run with 20 clients) and the summary is:
- MariaDB has large perf regressions for writes
- MariaDB has smaller perf regressions for point and range queries
- I will next get results for MySQL 8.0.39 with the change buffer disabled to match what modern MariaDB has
For a refresher, there is a comment above with results from a medium server (32 vCPU, HT disabled, 16 cores, 64G RAM, insert benchmark run with 8 clients). The summary from the medium server is ...
— Results from the medium server in August
On the medium server, for MariaDB 11.4.2 relative to 10.2.44 with a cached database:
- writes are a lot slower in 11.4.2 (10.2.44 is almost 2X faster on the initial load, l.i0)
- range query perf is similar between 11.4.2 and 10.2.44
- point queries are ~10% slower in 11.4.2
On the medium server, for MariaDB 11.4.2 relative to 10.2.44 with an IO-bound database:
- the initial load (l.i0) is almost 2X slower in 11.4.2
- random writes (l.i1, l.i2) are ~1.5x and ~7X faster in 11.4.2
- range query perf has some variance but is up to 10% slower in 11.4.2
- point query perf, when only looking at the cases where the target background write rate was sustained, is odd. For qp100 it is ~20% slower in 11.4.2 but for qp500 it is almost 2X faster in 11.4.2
- all MariaDB releases failed to sustain the target background write rate during qp1000 and some (10.2 to 10.5) failed during qr1000
On the medium server, for modern MariaDB (10.6, 10.11, 11.4) relative to MySQL 8.0.37 with a cached database:
- MySQL is up to 2X faster for writes
- MySQL and MariaDB have similar perf for range queries
- MariaDB is ~13% faster for point queries
On the medium server, for modern MariaDB (10.6, 10.11, 11.4) relative to MySQL 8.0.37 with an IO-bound database:
- MySQL is up to 2X faster for some writes (l.i0, l.i1) but MariaDB is ~5X faster for other (l.i2). This is odd.
- For range queries MariaDB starts out with similar perf to MySQL in qr100 but the advantage for MySQL becomes large in qr500 and qr1000. Perhaps this is from the change buffer.
- For point queries MariaDB is between 15% and 28% faster for qp100 and qp500 but things go bad in qp1000
- all MariaDB releases failed to sustain the target background write rate during qp1000
— Results from the large server today
Results are here for:
- cached database, MariaDB only, 10.2.44 as the base case
- IO-bound database, MariaDB only, 10.2.44 as the base case
- cached database, MariaDB only, 10.3.39 as the base case
- IO-bound database, MariaDB only, 10.3.39 as the base case
- cached database, modern MariaDB vs MySQL 8.0.39
- IO-bound database, modern MariaDB vs MySQL 8.0.39
I focus on results using MariaDB 10.3.39 as the base case and results for MariaDB vs MySQL. The results with MariaDB 10.2.44 as the base case
can be hard to read because some of the range and point query results are lousy for 10.2.44 so the relative QPS values for the releases after
10.2.44 become too large.
For a cached database, MariaDB only using 10.3.39 as the base case:
- Writes - almost 2X faster in 10.3.39 than 11.4.3. There is a huge regression in 10.5.26.
- Range queries - up to 9% slower in 11.4.3
- Point queries - up to 8% slower in 11.4.3
For an IO-bound database, MariaDB only using 10.3.39 as the base case:
- Writes, initial load (l.i0) - almost 2X faster in 10.3.39 than 11.4.3. There is a huge regression in 10.5.26
- Writes, random (l.i1, l.i2) - l.i1 is ~13% slower in 11.4.3 but l.i2 is ~1.3X faster in 11.4.3
- Range queries - ignoring qr500 and qr1000 because the target write rate wasn't sustained, range queries are ~2X faster in 11.4.3 than 10.3.39
- Point queries - ignoring qp500 and qp1000 because the target write rate wasn't sustained, point queries have similar perf between 11.4.3 and 10.3.39
- MariaDB was unable to sustain the target background write rate in qr500, qp500, qr1000 and qp1000. It was (500*2*20)/s for qr500 and qp500 and then (1000*2*20) for qr1000 and qp1000.
For a cached database, MariaDB 10.11.9 and 11.4.3 vs MySQL 8.0.39:
- Writes - MySQL is ~4X faster than MariaDB for l.i0 and l.i1 and ~2X faster for l.i2 (MySQL uses the change buffer, MariaDB does not)
- Range queries - MySQL is up to ~5% faster than MariaDB
- Point queries - MariaDB is up to 18% faster than MySQL
For an IO-bound database, MariaDB vs MySQL 8.0.39:
- Writes - MySQL is up to 5X faster than MariaDB for l.i0 and l.i1 while MariaDB is ~1.3X faster for l.i2 (MySQL uses the change buffer, MariaDB does not)
- For range and poin queries MySQL and MariaDB have similar perf on qr100 and qp100. I can't compare results for qr500, qp500, qr1000 or qp1000 because MariaDB fails to sustain the target write rates
- MySQL fails to sustain the target background write rate during qp1000 (MySQL uses the change buffer, MariaDB does not)
- MariaDB fails to sustain the target background write rates during qr500, qp500, qr1000 and qp1000 (MySQL uses the change buffer, MariaDB does not)
mdcallag Hi Mark! Have you ever tried to measure fluctuations for your Insert Benchmark test?
In my experiments some of your tests show continuous growing of average results - so final result is dependent of test time.
And also I see big enough fluctuations (up to 50%) in some tests.
Updated result from the large server. For the MySQL 8.0.39 vs modern MariaDB I now use MySQL 8.0.39 with innodb_change_buffering=none as the base case. Results are here:
Results don't change that much. Things that were a problem in MariaDB remain a problem when compared to MySQL, although results on the IO-bound workload for MySQL don't look as great when the change buffer is disabled.
@kirill.perov@mariadb.com can you be more specific
The perf reports that I publish include links to charts with QPS reported per 1-second interval. To find them grep for "Graphs for performance per 1-second interval"
From looking at the charts now I tend to see more variance in the MariaDB results, and variance isn't good.
This is my last big batch of results from the Insert Benchmark because my contract for testing InnoDB has run out. I have results from a big server (48 cores) and a small server (8 cores).
There are 1 to 3 concurrent connections per client and at most 2 busy connections per client. On the big server the test is run with 20 clients. On the small server the test is run with 1 and 6 clients.
The test is also repeated with cached (database fits in InnoDB block cache) and IO-bound (working set is larger than memory) workloads.
The my .cnf files are in subdirectories here for the small server and here for the big server. I try to make them as similar as possible – for example, the InnoDB change buffer is disabled for the older versions that still supported it.
For the big server with a cached workload the base case is MariaDB 10.4.34 and I tested the latest version from each LTS release after that.
- range queries (qr*) has no regression from 10.4 to 11.7
- point queries (qp*) has a small regression (11.7.1 gets about 87% of the QPS vs 10.4.34)
- initial load (l.i0) shows a large regression (11.7.1 gets 56% of the throughput vs 10.4.34). Most of the regression arrived in 10.5 and the root cause might be CPU overhead which increased a lot from 10.4 through 10.11 (see here
- random inserts+deletes (l.i1, l.i2) has a large regression (11.7.1 gets <= 68^% of the throughput vs 10.4.34). Most of the regression arrived in 10.5 and CPU overhead might be the root cause (see here)
For the big server with an IO-bound workload the base case is MariaDB 10.4.34
- none of the versions were able to sustain the target insert rates for qr500 & qp500 (10000/s) or for qr1000 & qp1000 (20000/s), see here and look at the third table
- range query performance (qr*) improved from 10.4 to 11.7 but that is harder to judge given the failure to sustain the target write rates
- point query performance is also hard to judge given the target write rate failures, but for qp100 MariaDB 11.7 does the same as 10.4, and then 11.7 has regressions for qp500 and qp1000
- the initial load (l.i0) which isn't IO-bound is similar to the result above for the cached workload. There is a large regression from 10.4 to 11.7, most of that arrived in 10.5 and CPU overheads might be the issue see cpupq here
- the l.i1 and l.i2 steps that do random inserts+deletes have a small regression for l.i1 and no regression for l.i2
For the small server with a cached workload and 1 client – see here the base case is MariaDB 10.2.44
- there is a small regression for the initial load (l.i0) where 11.7.1 gets 88% of the throughput vs 10.2.44
- there are small regressions for range queries (qr*) where 11.7.1 gets ~90% of the throughput vs 10.2.44
- there are medium regressions for point queries (qp*) where 11.7.1 gets ~80% of the throughput vs 10.2.44
- for random inserts+deletes (l.i1, l.i2) 11.7.1 gets ~10% more throughput than 10.2.44
- MariaDB 11.7.1 and MySQL 8.0.40 have similar performance
For the small server with a cached workload and 6 client – see here the base case is MariaDB 10.2.44
- there is a small regression for the initial load (l.i0) where 11.7.1 gets 85% of the throughput vs 10.2.44
- there are no regressions for range queries (qr*)
- there are small regressions for point queries (qp*) where 11.7.1 gets ~90% of the throughput vs 10.2.44
- for random inserts+deletes (l.i1, l.i2) 11.7.1 gets less throughput than 10.2.44 on l.i1 but more on l.i2
- MariaDB 11.7.1 and MySQL 8.0.40 have similar performance except on the l.i1 and l.i2 steps (random inserts + deletes) where MariaDB is about 2X faster
For the small server with an IO-bound workload and 1 client – see here
the base case is MariaDB 10.2.44
- there is a small regression for the initial load (l.i0) where 11.7.1 gets 89% of the throughput vs 10.2.44
- there are small regressions for range queries (qr*) where 11.7.1 gets ~90% of the throughput vs 10.2.44
- there are no regressions for point queries (qp*)
- for random inserts+deletes (l.i1, l.i2) 11.7.1 gets about 80% of the throughput vs 10.2.44. A large part of this regression arrived in 11.4
- for MariaDB 11.7.1 vs MySQL 8.0.40, MariaDB is faster on the initial load (l.i0), MySQL is faster on random inserts + deletes (l.i1, l.i2), MySQL is faster on range queries and they are similar on point queries
For the small server with an IO-bound workload and 6 clients – see here
the base case is MariaDB 10.2.44
- MariaDB doesn't sustain the target write rates (6000/s) for the qr1000 and qp1000 steps with 10.5, and 11.4 through 11.7
- there is a medium regression for the initial load (l.i0) where 11.7.1 gets 81% of the throughput vs 10.2.44
- there are medium regressions for range queries (qr*) where 11.7.1 gets 91%, 81% and 82% of the throughput vs 10.2.44. Recent versions don't sustain the target write rate for qr1000.
- there are medium regressions for point queries (qr*) where 11.7.1 gets 101%, 71% and 71% of the throughput vs 10.2.44. Recent versions don't sustain the target write rate for qp1000.
- for random inserts+deletes (l.i1, l.i2) 11.7.1 gets 30% and 78% of the throughput vs 10.2 for l.i1 and l.i2. From the metrics for l.i1 nothing stands out as CPU/operation (cpupq) and context switches/operation (csps) don't change much. Starting in 11.4 the average context switch rate (csps) and the average CPU utilization (cpups) starting both drop a lot. I assume there is some kind of stall (perhaps mutex contention) or thread scheduling issue. I will repeat a few tests to get thread stacks with PMP.
- for MariaDB 11.7.1 vs MySQL 8.0.40, perf is similar on the initial load (l.i0), MySQL is faster on random inserts + deletes (l.i1, l.i2), MySQL is a lot faster on point and range queries.
The previous comment mentions there is a large regression for the l.i1 benchmark step that arrives in 11.4 for the IO-bound workload with 6 clients on a small server. This gist has thread stacks collected by PMP (they are aggregated over many samples to compare 11.10.10 and 11.4.4. What I see for 11.4.4 is that the most frequent stacks are from buffer pool flushing not keeping up (see here) in 11.4.4 but that doesn't show up for 10.11.10 (see here)
Thank you, mdcallag. Indeed, it looks like only 11.4.4 but not 10.11.10 (you typoed "11.10.10" once) is blocking because of running out of buffer pool. Apart from the removal of the change buffer (MDEV-29694), there shouldn’t be anything obvious in 11.4 that should make InnoDB slower. In fact, it is expected to be the opposite due to changes like MDEV-30216 and MDEV-32042.
If you had enabled innodb_change_buffering in 10.11, that could be the simple explanation. But I saw innodb_change_buffering=none in some …/etc/my.cnf that I checked in https://github.com/mdcallag/mytools/blob/master/bench/conf/arc/oct24/c32r128/.
If this is an apples-to-apples comparison (the change buffer is disabled in both), then we may have to experiment with some "hybrid" builds (such as applying the InnoDB from 10.11 to MariaDB Server 11.4 or vice versa) in order to narrow down the cause of this regression.
All of the my.cnf I use have innodb_change_buffering=none unless I call it out. I try to make the configurations as similar as possible.
I tested (IO-bound, not IO-bound) X (big server, small server). And for the small server test at 1 and 6 clients. The problem only shows up on (IO-bound, small server, 6 clients). In most cases I try to avoid over-subscribing the CPU where that means the number of busy connections is >= number of CPU cores. But in the 6 client case it is possible that I did over-subscribe which is why the problem only shows up on that case.
Looking at the insert rate by time during l.i1 for 10.11.10 and for 11.4.4 what I see is that things go bad fast for 11.4.4.
Comparing MariaDB 10.11.7 and 11.4.1 with MySQL 8.0.36:
The common issue appears to be the changes in MariaDB 10.6 with the introduction of no-spinning for some mutexes and/or rw-locks