Details
-
Bug
-
Status: Closed (View Workflow)
-
 Critical
-
Resolution: Fixed
-
10.6.11, 10.6.13, 10.6.14
-
Ubuntu 22.04
-
PERF - Sprint 2023.06
Description
Consider the following MTR test case:
openxs@ao756:~/dbs/maria10.5/mysql-test$ cat suite/innodb/t/pt_large.test
|
source include/have_innodb.inc;
|
source include/have_partition.inc;
|
set default_storage_engine=innodb;
|
delimiter ||;
|
set use_stat_tables=NEVER||
|
|
|
create table tp (id int, c1 date, c2 int, c3 text, primary key(id, c1)) partition by range (to_days(c1)) (partition p1 values less than (734874), partition p2 values less than (735240), partition prest values less than (1000000))||
|
|
|
select @now := now(6)||
|
|
|
for i in 1..50000 do execute immediate concat('insert into tp (id, c1, c2, c3) values (', i,', "2023-01-02", 1, repeat("a", 2000))'); execute immediate concat('insert into tp (id, c1, c2, c3) values (', i,', "2023-01-01", 2, repeat("b", 2000))'); end for||
|
|
|
select timestampdiff(microsecond, @now, now(6))||
|
|
|
--query_vertical show table status like 'tp';
|
|
|
#flush tables for export||
|
#--query_vertical show engine innodb status;
|
|
|
select @now := now(6)||
|
analyze format=json select distinct(c1) from tp partition (prest)
|
as t1||
|
select timestampdiff(microsecond, @now, now(6))||
|
|
|
select @now := now(6)||
|
analyze format=json select distinct(c1) from tp partition (prest)
|
as t1||
|
select timestampdiff(microsecond, @now, now(6))||
|
|
|
--query_vertical show engine innodb status;
|
|
|
select @now := now(6)||
|
drop table tp||
|
select timestampdiff(microsecond, @now, now(6))||
|
On a slow laptop with slow HDD, like this:
openxs@ao756:~/dbs/maria10.5/mysql-test$ pt-summary | more
|
# Percona Toolkit System Summary Report ######################
|
Date | 2023-04-02 15:22:06 UTC (local TZ: EEST +0300)
|
Hostname | ao756
|
Uptime | 5:09, 2 users, load average: 0,15, 1,21, 1,90
|
Platform | Linux
|
Release | Ubuntu 22.04.2 LTS (jammy)
|
Kernel | 5.15.0-58-generic
|
Architecture | CPU = 64-bit, OS = 64-bit
|
Threading | NPTL 2.35
|
SELinux | No SELinux detected
|
Virtualized | No virtualization detected
|
# Processor ##################################################
|
Processors | physical = 1, cores = 2, virtual = 2, hyperthreading = no
|
Speeds | 1x1000.000, 1x142.277
|
Models | 2xIntel(R) Pentium(R) CPU 987 @ 1.50GHz
|
Caches | 2x2048 KB
|
# Memory #####################################################
|
Total | 3,7G
|
Free | 1,3G
|
Used | physical = 665,1M, swap allocated = 980,0M, swap used = 362,3M, vir
|
tual = 1,0G
|
...
|
and in other I/O-bound cases, we see that 10,5 allows to run a query that scans the entire partition via PRIMARY KEY fast enough no matter how many times we try:
openxs@ao756:~/dbs/maria10.5/mysql-test$ ./mtr --mysqld='--innodb_flush_log_at_trx_commit=0' --mysqld='--innodb_buffer_pool_size=128M' --suite=innodb pt_large
|
Logging: ./mtr --mysqld=--innodb_flush_log_at_trx_commit=0 --mysqld=--innodb_buffer_pool_size=128M --suite=innodb pt_large
|
VS config:
|
vardir: /home/openxs/dbs/maria10.5/mysql-test/var
|
Checking leftover processes...
|
mysql-test-run: WARNING: Found non pid file 'mysqld.err' in '/home/openxs/dbs/maria10.5/mysql-test/var/run'
|
- found old pid 90976 in 'mysqld.2.pid', killing it...
|
process did not exist!
|
Removing old var directory...
|
Creating var directory '/home/openxs/dbs/maria10.5/mysql-test/var'...
|
Checking supported features...
|
MariaDB Version 10.5.20-MariaDB
|
- SSL connections supported
|
Collecting tests...
|
Installing system database...
|
|
|
==============================================================================
|
|
|
TEST RESULT TIME (ms) or COMMENT
|
--------------------------------------------------------------------------
|
|
|
worker[1] Using MTR_BUILD_THREAD 300, with reserved ports 16000..16019
|
set default_storage_engine=innodb;
|
set use_stat_tables=NEVER||
|
create table tp (id int, c1 date, c2 int, c3 text, primary key(id, c1)) partition by range (to_days(c1)) (partition p1 values less than (734874), partition p2 values less than (735240), partition prest values less than (1000000))||
|
select @now := now(6)||
|
@now := now(6)
|
2023-04-02 17:20:30.960954
|
for i in 1..50000 do execute immediate concat('insert into tp (id, c1, c2, c3) values (', i,', "2023-01-02", 1, repeat("a", 2000))'); execute immediate concat('insert into tp (id, c1, c2, c3) values (', i,', "2023-01-01", 2, repeat("b", 2000))'); end for||
|
select timestampdiff(microsecond, @now, now(6))||
|
timestampdiff(microsecond, @now, now(6))
|
104310397
|
show table status like 'tp';||
|
Name tp
|
Engine InnoDB
|
Version 10
|
Row_format Dynamic
|
Rows 100009
|
Avg_row_length 4476
|
Data_length 447709184
|
Max_data_length 0
|
Index_length 0
|
Data_free 5242880
|
Auto_increment NULL
|
Create_time 2023-04-02 17:20:30
|
Update_time 2023-04-02 17:22:15
|
Check_time NULL
|
Collation latin1_swedish_ci
|
Checksum NULL
|
Create_options partitioned
|
Comment
|
Max_index_length 0
|
Temporary N
|
select @now := now(6)||
|
@now := now(6)
|
2023-04-02 17:22:15.272766
|
analyze format=json select distinct(c1) from tp partition (prest)
|
as t1||
|
ANALYZE
|
{
|
"query_block": {
|
"select_id": 1,
|
"r_loops": 1,
|
"r_total_time_ms": 483.4085944,
|
"temporary_table": {
|
"table": {
|
"table_name": "t1",
|
"partitions": ["prest"],
|
"access_type": "index",
|
"key": "PRIMARY",
|
"key_length": "7",
|
"used_key_parts": ["id", "c1"],
|
"r_loops": 1,
|
"rows": 100007,
|
"r_rows": 100000,
|
"r_table_time_ms": 439.0825011,
|
"r_other_time_ms": 44.31424626,
|
"filtered": 100,
|
"r_filtered": 100,
|
"using_index": true
|
}
|
}
|
}
|
}
|
select timestampdiff(microsecond, @now, now(6))||
|
timestampdiff(microsecond, @now, now(6))
|
484134
|
select @now := now(6)||
|
@now := now(6)
|
2023-04-02 17:22:15.757233
|
analyze format=json select distinct(c1) from tp partition (prest)
|
as t1||
|
ANALYZE
|
{
|
"query_block": {
|
"select_id": 1,
|
"r_loops": 1,
|
"r_total_time_ms": 496.110545,
|
"temporary_table": {
|
"table": {
|
"table_name": "t1",
|
"partitions": ["prest"],
|
"access_type": "index",
|
"key": "PRIMARY",
|
"key_length": "7",
|
"used_key_parts": ["id", "c1"],
|
"r_loops": 1,
|
"rows": 100007,
|
"r_rows": 100000,
|
"r_table_time_ms": 451.8577746,
|
"r_other_time_ms": 44.20580505,
|
"filtered": 100,
|
"r_filtered": 100,
|
"using_index": true
|
}
|
}
|
}
|
}
|
select timestampdiff(microsecond, @now, now(6))||
|
timestampdiff(microsecond, @now, now(6))
|
497149
|
show engine innodb status;||
|
Type InnoDB
|
Name
|
Status
|
=====================================
|
2023-04-02 17:22:16 0x7f518bdb4640 INNODB MONITOR OUTPUT
|
=====================================
|
Per second averages calculated from the last 46 seconds
|
-----------------
|
BACKGROUND THREAD
|
-----------------
|
srv_master_thread loops: 0 srv_active, 0 srv_shutdown, 100 srv_idle
|
srv_master_thread log flush and writes: 100
|
----------
|
SEMAPHORES
|
----------
|
OS WAIT ARRAY INFO: reservation count 1043
|
OS WAIT ARRAY INFO: signal count 1000
|
RW-shared spins 386, rounds 6780, OS waits 101
|
RW-excl spins 1455, rounds 22817, OS waits 613
|
RW-sx spins 54, rounds 1501, OS waits 47
|
Spin rounds per wait: 17.56 RW-shared, 15.68 RW-excl, 27.80 RW-sx
|
------------
|
TRANSACTIONS
|
------------
|
Trx id counter 200033
|
Purge done for trx's n:o < 200033 undo n:o < 0 state: running
|
History list length 39
|
LIST OF TRANSACTIONS FOR EACH SESSION:
|
---TRANSACTION 421463270588624, not started
|
0 lock struct(s), heap size 1128, 0 row lock(s)
|
--------
|
FILE I/O
|
--------
|
Pending flushes (fsync) log: 0; buffer pool: 0
|
40609 OS file reads, 57765 OS file writes, 2112 OS fsyncs
|
878.26 reads/s, 16384 avg bytes/read, 539.03 writes/s, 19.83 fsyncs/s
|
-------------------------------------
|
INSERT BUFFER AND ADAPTIVE HASH INDEX
|
-------------------------------------
|
Ibuf: size 1, free list len 0, seg size 2, 0 merges
|
merged operations:
|
insert 0, delete mark 0, delete 0
|
discarded operations:
|
insert 0, delete mark 0, delete 0
|
0.00 hash searches/s, 2450.10 non-hash searches/s
|
---
|
LOG
|
---
|
Log sequence number 464003121
|
Log flushed up to 464003121
|
Pages flushed up to 461484600
|
Last checkpoint at 461484600
|
0 pending log flushes, 0 pending chkp writes
|
1497 log i/o's done, 14.28 log i/o's/second
|
----------------------
|
BUFFER POOL AND MEMORY
|
----------------------
|
Total large memory allocated 136314880
|
Dictionary memory allocated 866232
|
Buffer pool size 8065
|
Free buffers 0
|
Database pages 8065
|
Old database pages 2957
|
Modified db pages 395
|
Percent of dirty pages(LRU & free pages): 4.897
|
Max dirty pages percent: 90.000
|
Pending reads 0
|
Pending writes: LRU 0, flush list 0
|
Pages made young 893, not young 58427
|
8.07 youngs/s, 1269.30 non-youngs/s
|
Pages read 40595, created 25867, written 55933
|
878.26 reads/s, 238.65 creates/s, 521.60 writes/s
|
Buffer pool hit rate 959 / 1000, young-making rate 0 / 1000 not 58 / 1000
|
Pages read ahead 0.00/s, evicted without access 0.00/s, Random read ahead 0.00/s
|
LRU len: 8065, unzip_LRU len: 0
|
I/O sum[35628]:cur[37550], unzip sum[0]:cur[0]
|
--------------
|
ROW OPERATIONS
|
--------------
|
0 read views open inside InnoDB
|
Process ID=0, Main thread ID=0, state: sleeping
|
Number of rows inserted 100000, updated 0, deleted 0, read 200000
|
933.26 inserts/s, 0.00 updates/s, 0.00 deletes/s, 4347.73 reads/s
|
Number of system rows inserted 0, updated 0, deleted 0, read 0
|
0.00 inserts/s, 0.00 updates/s, 0.00 deletes/s, 0.00 reads/s
|
----------------------------
|
END OF INNODB MONITOR OUTPUT
|
============================
|
|
|
select @now := now(6)||
|
@now := now(6)
|
2023-04-02 17:22:16.255774
|
drop table tp||
|
select timestampdiff(microsecond, @now, now(6))||
|
timestampdiff(microsecond, @now, now(6))
|
238777
|
innodb.pt_large 'innodb' [ pass ] 105738
|
--------------------------------------------------------------------------
|
The servers were restarted 0 times
|
Spent 105.738 of 122 seconds executing testcases
|
|
|
Completed: All 1 tests were successful.
|
while with 10.6 (maybe because of history list length etc issues as per MDEV-29401) we often get 5 or more times slower execution of the query:
openxs@ao756:~/dbs/maria10.5/mysql-test$ cd ../../maria10.6/mysql-test/
|
openxs@ao756:~/dbs/maria10.6/mysql-test$ cp ../../maria10.5/mysql-test/suite/innodb/t/pt_large.test suite/innodb/t/
|
openxs@ao756:~/dbs/maria10.6/mysql-test$ ./mtr --mysqld='--innodb_flush_log_at_trx_commit=0' --mysqld='--innodb_buffer_pool_size=128M' --suite=innodb pt_large
|
Logging: ./mtr --mysqld=--innodb_flush_log_at_trx_commit=0 --mysqld=--innodb_buffer_pool_size=128M --suite=innodb pt_large
|
VS config:
|
vardir: /home/openxs/dbs/maria10.6/mysql-test/var
|
Checking leftover processes...
|
Removing old var directory...
|
Creating var directory '/home/openxs/dbs/maria10.6/mysql-test/var'...
|
Checking supported features...
|
MariaDB Version 10.6.13-MariaDB
|
- SSL connections supported
|
Collecting tests...
|
Installing system database...
|
|
|
==============================================================================
|
|
|
TEST RESULT TIME (ms) or COMMENT
|
--------------------------------------------------------------------------
|
|
|
worker[1] Using MTR_BUILD_THREAD 300, with reserved ports 16000..16019
|
set default_storage_engine=innodb;
|
set use_stat_tables=NEVER||
|
create table tp (id int, c1 date, c2 int, c3 text, primary key(id, c1)) partition by range (to_days(c1)) (partition p1 values less than (734874), partition p2 values less than (735240), partition prest values less than (1000000))||
|
select @now := now(6)||
|
@now := now(6)
|
2023-04-02 17:24:05.101340
|
for i in 1..50000 do execute immediate concat('insert into tp (id, c1, c2, c3) values (', i,', "2023-01-02", 1, repeat("a", 2000))'); execute immediate concat('insert into tp (id, c1, c2, c3) values (', i,', "2023-01-01", 2, repeat("b", 2000))'); end for||
|
select timestampdiff(microsecond, @now, now(6))||
|
timestampdiff(microsecond, @now, now(6))
|
127794694
|
show table status like 'tp';||
|
Name tp
|
Engine InnoDB
|
Version 10
|
Row_format Dynamic
|
Rows 97501
|
Avg_row_length 4807
|
Data_length 468697088
|
Max_data_length 0
|
Index_length 0
|
Data_free 5242880
|
Auto_increment NULL
|
Create_time 2023-04-02 17:24:05
|
Update_time 2023-04-02 17:26:12
|
Check_time NULL
|
Collation latin1_swedish_ci
|
Checksum NULL
|
Create_options partitioned
|
Comment
|
Max_index_length 0
|
Temporary N
|
select @now := now(6)||
|
@now := now(6)
|
2023-04-02 17:26:12.897397
|
analyze format=json select distinct(c1) from tp partition (prest)
|
as t1||
|
ANALYZE
|
{
|
"query_block": {
|
"select_id": 1,
|
"r_loops": 1,
|
"r_total_time_ms": 23488.31341,
|
"temporary_table": {
|
"table": {
|
"table_name": "t1",
|
"partitions": ["prest"],
|
"access_type": "index",
|
"key": "PRIMARY",
|
"key_length": "7",
|
"used_key_parts": ["id", "c1"],
|
"r_loops": 1,
|
"rows": 97499,
|
"r_rows": 100000,
|
"r_table_time_ms": 23361.07277,
|
"r_other_time_ms": 127.2287723,
|
"filtered": 100,
|
"r_filtered": 100,
|
"using_index": true
|
}
|
}
|
}
|
}
|
select timestampdiff(microsecond, @now, now(6))||
|
timestampdiff(microsecond, @now, now(6))
|
23437366
|
select @now := now(6)||
|
@now := now(6)
|
2023-04-02 17:26:36.335328
|
analyze format=json select distinct(c1) from tp partition (prest)
|
as t1||
|
ANALYZE
|
{
|
"query_block": {
|
"select_id": 1,
|
"r_loops": 1,
|
"r_total_time_ms": 22864.82057,
|
"temporary_table": {
|
"table": {
|
"table_name": "t1",
|
"partitions": ["prest"],
|
"access_type": "index",
|
"key": "PRIMARY",
|
"key_length": "7",
|
"used_key_parts": ["id", "c1"],
|
"r_loops": 1,
|
"rows": 97499,
|
"r_rows": 100000,
|
"r_table_time_ms": 22738.28402,
|
"r_other_time_ms": 126.5225293,
|
"filtered": 100,
|
"r_filtered": 100,
|
"using_index": true
|
}
|
}
|
}
|
}
|
select timestampdiff(microsecond, @now, now(6))||
|
timestampdiff(microsecond, @now, now(6))
|
22815438
|
show engine innodb status;||
|
Type InnoDB
|
Name
|
Status
|
=====================================
|
2023-04-02 17:26:59 0x7f24c4dcf640 INNODB MONITOR OUTPUT
|
=====================================
|
Per second averages calculated from the last 55 seconds
|
-----------------
|
BACKGROUND THREAD
|
-----------------
|
srv_master_thread loops: 0 srv_active, 0 srv_shutdown, 167 srv_idle
|
srv_master_thread log flush and writes: 167
|
----------
|
SEMAPHORES
|
----------
|
------------
|
TRANSACTIONS
|
------------
|
Trx id counter 200050
|
Purge done for trx's n:o < 200050 undo n:o < 0 state: running but idle
|
History list length 12406
|
LIST OF TRANSACTIONS FOR EACH SESSION:
|
---TRANSACTION (0x7f24c5878b80), not started
|
0 lock struct(s), heap size 1128, 0 row lock(s)
|
--------
|
FILE I/O
|
--------
|
Pending flushes (fsync) log: 0; buffer pool: 0
|
41656 OS file reads, 78854 OS file writes, 2646 OS fsyncs
|
744.46 reads/s, 16384 avg bytes/read, 86.42 writes/s, 3.02 fsyncs/s
|
-------------------------------------
|
INSERT BUFFER AND ADAPTIVE HASH INDEX
|
-------------------------------------
|
Ibuf: size 1, free list len 0, seg size 2, 0 merges
|
merged operations:
|
insert 0, delete mark 0, delete 0
|
discarded operations:
|
insert 0, delete mark 0, delete 0
|
0.00 hash searches/s, 0.00 non-hash searches/s
|
---
|
LOG
|
---
|
Log sequence number 464394282
|
Log flushed up to 464394282
|
Pages flushed up to 460080075
|
Last checkpoint at 460080075
|
0 pending log flushes, 0 pending chkp writes
|
1518 log i/o's done, 1.93 log i/o's/second
|
----------------------
|
BUFFER POOL AND MEMORY
|
----------------------
|
Total large memory allocated 136314880
|
Dictionary memory allocated 859944
|
Buffer pool size 8112
|
Free buffers 41
|
Database pages 8071
|
Old database pages 2996
|
Modified db pages 858
|
Percent of dirty pages(LRU & free pages): 10.576
|
Max dirty pages percent: 90.000
|
Pending reads 0
|
Pending writes: LRU 0, flush list 0
|
Pages made young 194, not young 59379
|
0.13 youngs/s, 1075.18 non-youngs/s
|
Pages read 41642, created 26850, written 76855
|
744.46 reads/s, 31.96 creates/s, 83.94 writes/s
|
Buffer pool hit rate 784 / 1000, young-making rate 0 / 1000 not 311 / 1000
|
Pages read ahead 0.00/s, evicted without access 2.44/s, Random read ahead 0.00/s
|
LRU len: 8071, unzip_LRU len: 0
|
I/O sum[46204]:cur[8322], unzip sum[0]:cur[0]
|
--------------
|
ROW OPERATIONS
|
--------------
|
0 read views open inside InnoDB
|
Process ID=0, Main thread ID=0, state: sleeping
|
Number of rows inserted 100000, updated 0, deleted 0, read 200000
|
119.40 inserts/s, 0.00 updates/s, 0.00 deletes/s, 3636.30 reads/s
|
Number of system rows inserted 0, updated 0, deleted 0, read 0
|
0.00 inserts/s, 0.00 updates/s, 0.00 deletes/s, 0.00 reads/s
|
----------------------------
|
END OF INNODB MONITOR OUTPUT
|
============================
|
|
|
select @now := now(6)||
|
@now := now(6)
|
2023-04-02 17:26:59.152604
|
drop table tp||
|
select timestampdiff(microsecond, @now, now(6))||
|
timestampdiff(microsecond, @now, now(6))
|
88100
|
innodb.pt_large 'innodb' [ pass ] 174209
|
--------------------------------------------------------------------------
|
The servers were restarted 0 times
|
Spent 174.209 of 199 seconds executing testcases
|
|
|
Completed: All 1 tests were successful.
|
Execution plans, data, settings (other than defaults) are all the same. But if we try many times the problem is obvious. On 10.5:
openxs@ao756:~/dbs/maria10.5/mysql-test$ ./mtr --mysqld='--innodb_flush_log_at_trx_commit=0' --mysqld='--innodb_buffer_pool_size=128M' --repeat=10 --suite=innodb pt_large | grep -e "r_total_time_ms" -e 'History'
|
"r_total_time_ms": 491.6631284,
|
"r_total_time_ms": 507.3302068,
|
History list length 50
|
"r_total_time_ms": 485.4183206,
|
"r_total_time_ms": 544.7983346,
|
History list length 42
|
"r_total_time_ms": 497.4036018,
|
"r_total_time_ms": 542.3594439,
|
History list length 19
|
"r_total_time_ms": 485.4261564,
|
"r_total_time_ms": 504.1408094,
|
History list length 21
|
"r_total_time_ms": 491.8014112,
|
"r_total_time_ms": 506.5794441,
|
History list length 30
|
"r_total_time_ms": 506.0841696,
|
"r_total_time_ms": 512.9175432,
|
History list length 19
|
"r_total_time_ms": 527.1490708,
|
"r_total_time_ms": 509.8647148,
|
History list length 46
|
"r_total_time_ms": 492.577935,
|
"r_total_time_ms": 505.5527027,
|
History list length 5
|
"r_total_time_ms": 527.909722,
|
"r_total_time_ms": 507.3815736,
|
History list length 29
|
"r_total_time_ms": 494.5920197,
|
"r_total_time_ms": 503.798489,
|
History list length 39
|
we see always small History list length and predictable, stable execution time. Now on 10.6 the situation is very different:
openxs@ao756:~/dbs/maria10.6/mysql-test$ ./mtr --mysqld='--innodb_flush_log_at_trx_commit=0' --mysqld='--innodb_buffer_pool_size=128M' --repeat=10 --suite=innodb pt_large | grep -e "r_total_time_ms" -e 'History'
|
"r_total_time_ms": 24131.43297,
|
"r_total_time_ms": 22605.21843,
|
History list length 0
|
"r_total_time_ms": 22972.90129,
|
"r_total_time_ms": 22860.8124,
|
History list length 4165
|
"r_total_time_ms": 24148.09257,
|
"r_total_time_ms": 23086.00005,
|
History list length 0
|
"r_total_time_ms": 24145.83615,
|
"r_total_time_ms": 22688.66274,
|
History list length 10288
|
"r_total_time_ms": 26353.22961,
|
"r_total_time_ms": 23047.84638,
|
History list length 0
|
"r_total_time_ms": 23301.57555,
|
"r_total_time_ms": 22777.66788,
|
History list length 16120
|
"r_total_time_ms": 23641.375,
|
"r_total_time_ms": 22868.85873,
|
History list length 0
|
"r_total_time_ms": 23898.78684,
|
"r_total_time_ms": 22960.07185,
|
History list length 15286
|
"r_total_time_ms": 24282.99769,
|
"r_total_time_ms": 22952.89102,
|
History list length 10849
|
"r_total_time_ms": 24413.22993,
|
"r_total_time_ms": 22775.74191,
|
History list length 2030
|
|
Attachments


Issue Links
- is caused by
-
-

- Closed
-
- relates to
-
-
- Closed
-
-
-

- Closed
-
-
-
- Confirmed
-
-
MDEV-11378 AliSQL: [Perf] Issue#23 MERGE INNODB AIO REQUEST
-
- Open
-
-
-
- Closed
-
Activity
| Field | Original Value | New Value |
|---|---|---|
| Attachment | pt_large.test [ 69347 ] |
| Fix Version/s | 10.4 [ 22408 ] | |
| Fix Version/s | 10.5 [ 23123 ] | |
| Fix Version/s | 10.6 [ 24028 ] | |
| Fix Version/s | 10.3 [ 22126 ] |
| Fix Version/s | 10.3 [ 22126 ] | |
| Fix Version/s | 10.4 [ 22408 ] | |
| Fix Version/s | 10.5 [ 23123 ] |
| Assignee | Marko Mäkelä [ marko ] |
| Priority | Major [ 3 ] | Critical [ 2 ] |
| Status | Open [ 1 ] | In Progress [ 3 ] |
I can reproduce a measurable difference between the currently latest 10.5 and 10.6 RelWithDebInfo when running the test on RAM disk:
| version | run time |
|---|---|
| 10.5 | 9.5 to 10.3 seconds |
| 10.6 | 12.4 to 14.0 seconds |
This includes the test setup time. I’ll drill down to the actual difference.
To narrow this down, I ported InnoDB from 10.6 to MariaDB 10.5 as follows:
git checkout 6c196090c8c265bfd93df1e2ee6b18cda2b1d2d8
|
git checkout 485a1b1f116f0c5e73fce3a97ffdac84c861b3c2 tpool storage/innobase extra include/aligned.h include/my_atomic_wrapper.h
|
git checkout HEAD extra/comp_err.c
|
patch -p1<<"EOF"
|
diff --git a/storage/innobase/handler/ha_innodb.cc b/storage/innobase/handler/ha_innodb.cc
|
index f102789d7ab..66125ac5d52 100644
|
--- a/storage/innobase/handler/ha_innodb.cc
|
+++ b/storage/innobase/handler/ha_innodb.cc
|
@@ -1989,45 +1989,6 @@ static int innobase_wsrep_get_checkpoint(handlerton* hton, XID* xid);
|
#define normalize_table_name(a,b) \
|
normalize_table_name_c_low(a,b,IF_WIN(true,false))
|
|
-ulonglong ha_innobase::table_version() const
|
-{
|
- /* This is either "garbage" or something that was assigned
|
- on a successful ha_innobase::prepare_inplace_alter_table(). */
|
- return m_prebuilt->trx_id;
|
-}
|
-
|
-#ifdef UNIV_DEBUG
|
-/** whether the DDL log recovery has been completed */
|
-static bool ddl_recovery_done;
|
-#endif
|
-
|
-static int innodb_check_version(handlerton *hton, const char *path,
|
- const LEX_CUSTRING *version,
|
- ulonglong create_id)
|
-{
|
- DBUG_ENTER("innodb_check_version");
|
- DBUG_ASSERT(hton == innodb_hton_ptr);
|
- ut_ad(!ddl_recovery_done);
|
-
|
- if (!create_id)
|
- DBUG_RETURN(0);
|
-
|
- char norm_path[FN_REFLEN];
|
- normalize_table_name(norm_path, path);
|
-
|
- if (dict_table_t *table= dict_table_open_on_name(norm_path, false,
|
- DICT_ERR_IGNORE_NONE))
|
- {
|
- const trx_id_t trx_id= table->def_trx_id;
|
- DBUG_ASSERT(trx_id <= create_id);
|
- dict_table_close(table);
|
- DBUG_PRINT("info", ("create_id: %llu trx_id: %llu", create_id, trx_id));
|
- DBUG_RETURN(create_id != trx_id);
|
- }
|
- else
|
- DBUG_RETURN(2);
|
-}
|
-
|
/** Drop any garbage intermediate tables that existed in the system
|
after a backup was restored.
|
|
@@ -2037,6 +1998,7 @@ normal DDL recovery will not run due to the lack of the log file,
|
at least some #sql-alter- garbage tables may remain in the InnoDB
|
data dictionary (while the data files themselves are missing).
|
We will attempt to drop the tables here. */
|
+#if 0
|
static void drop_garbage_tables_after_restore()
|
{
|
btr_pcur_t pcur;
|
@@ -2158,6 +2120,7 @@ static void innodb_ddl_recovery_done(handlerton*)
|
srv_wake_purge_thread_if_not_active();
|
}
|
}
|
+#endif
|
|
/********************************************************************//**
|
Converts an InnoDB error code to a MySQL error code and also tells to MySQL
|
@@ -3071,7 +3034,6 @@ ha_innobase::ha_innobase(
|
| HA_CAN_TABLES_WITHOUT_ROLLBACK
|
| HA_CAN_ONLINE_BACKUPS
|
| HA_CONCURRENT_OPTIMIZE
|
- | HA_CAN_SKIP_LOCKED
|
| (srv_force_primary_key ? HA_REQUIRE_PRIMARY_KEY : 0)
|
),
|
m_start_of_scan(),
|
@@ -4195,9 +4157,7 @@ static int innodb_init(void* p)
|
HTON_SUPPORTS_EXTENDED_KEYS | HTON_SUPPORTS_FOREIGN_KEYS |
|
HTON_NATIVE_SYS_VERSIONING |
|
HTON_WSREP_REPLICATION |
|
- HTON_REQUIRES_CLOSE_AFTER_TRUNCATE |
|
- HTON_TRUNCATE_REQUIRES_EXCLUSIVE_USE |
|
- HTON_REQUIRES_NOTIFY_TABLEDEF_CHANGED_AFTER_COMMIT;
|
+ HTON_REQUIRES_CLOSE_AFTER_TRUNCATE;
|
|
#ifdef WITH_WSREP
|
innobase_hton->abort_transaction=wsrep_abort_transaction;
|
@@ -4206,9 +4166,6 @@ static int innodb_init(void* p)
|
innobase_hton->disable_internal_writes=innodb_disable_internal_writes;
|
#endif /* WITH_WSREP */
|
|
- innobase_hton->check_version = innodb_check_version;
|
- innobase_hton->signal_ddl_recovery_done = innodb_ddl_recovery_done;
|
-
|
innobase_hton->tablefile_extensions = ha_innobase_exts;
|
innobase_hton->table_options = innodb_table_option_list;
|
|
@@ -5088,17 +5045,6 @@ ha_innobase::table_flags() const
|
return(flags | HA_BINLOG_STMT_CAPABLE);
|
}
|
|
-/****************************************************************//**
|
-Returns the table type (storage engine name).
|
-@return table type */
|
-
|
-const char*
|
-ha_innobase::table_type() const
|
-/*===========================*/
|
-{
|
- return(innobase_hton_name);
|
-}
|
-
|
/****************************************************************//**
|
Returns the index type.
|
@return index type */
|
@@ -7818,7 +7764,6 @@ bool ha_innobase::is_read_only(bool altering_to_supported) const
|
!innodb_read_only_compressed)
|
return false;
|
|
- ib_senderrf(m_user_thd, IB_LOG_LEVEL_WARN, ER_UNSUPPORTED_COMPRESSED_TABLE);
|
return true;
|
}
|
|
@@ -8553,6 +8498,8 @@ wsrep_calc_row_hash(
|
@retval true on failure */
|
ATTRIBUTE_COLD bool wsrep_append_table_key(MYSQL_THD thd, const dict_table_t &table)
|
{
|
+ return true;
|
+#if 0
|
char db_buf[NAME_LEN + 1];
|
char tbl_buf[NAME_LEN + 1];
|
ulint db_buf_len, tbl_buf_len;
|
@@ -8575,6 +8522,7 @@ ATTRIBUTE_COLD bool wsrep_append_table_key(MYSQL_THD thd, const dict_table_t &ta
|
}
|
|
return false;
|
+#endif
|
}
|
#endif /* WITH_WSREP */
|
|
@@ -11217,7 +11165,6 @@ create_table_info_t::create_options_are_invalid()
|
/* Check if a non-zero KEY_BLOCK_SIZE was specified. */
|
if (has_key_block_size) {
|
if (is_temp || innodb_read_only_compressed) {
|
- my_error(ER_UNSUPPORTED_COMPRESSED_TABLE, MYF(0));
|
return("KEY_BLOCK_SIZE");
|
}
|
|
@@ -11273,7 +11220,6 @@ create_table_info_t::create_options_are_invalid()
|
switch (row_format) {
|
case ROW_TYPE_COMPRESSED:
|
if (is_temp || innodb_read_only_compressed) {
|
- my_error(ER_UNSUPPORTED_COMPRESSED_TABLE, MYF(0));
|
return("ROW_FORMAT");
|
}
|
if (!m_allow_file_per_table) {
|
@@ -13511,7 +13457,7 @@ int ha_innobase::delete_table(const char *name)
|
trx_t *trx= parent_trx;
|
dberr_t err= DB_SUCCESS;
|
if (!trx->lock.table_locks.empty() &&
|
- thd_ddl_options(trx->mysql_thd)->is_create_select())
|
+ false)
|
{
|
/* CREATE TABLE...PRIMARY KEY...SELECT ought to be dropping the
|
table because a duplicate key was detected or a timeout occurred.
|
@@ -15722,7 +15668,6 @@ ha_innobase::extra(
|
reset_template();
|
trx->duplicates = 0;
|
/* fall through */
|
- case HA_EXTRA_IGNORE_INSERT:
|
/* HA_EXTRA_IGNORE_INSERT is very similar to
|
HA_EXTRA_IGNORE_DUP_KEY, but with one crucial difference:
|
we want !trx->duplicates for INSERT IGNORE so that
|
@@ -16484,7 +16429,6 @@ ha_innobase::store_lock(
|
} else if ((lock_type == TL_READ && in_lock_tables)
|
|| (lock_type == TL_READ_HIGH_PRIORITY && in_lock_tables)
|
|| lock_type == TL_READ_WITH_SHARED_LOCKS
|
- || lock_type == TL_READ_SKIP_LOCKED
|
|| lock_type == TL_READ_NO_INSERT
|
|| (lock_type != TL_IGNORE
|
&& sql_command != SQLCOM_SELECT)) {
|
@@ -16545,8 +16489,7 @@ ha_innobase::store_lock(
|
m_prebuilt->select_lock_type = LOCK_NONE;
|
m_prebuilt->stored_select_lock_type = LOCK_NONE;
|
}
|
- m_prebuilt->skip_locked= (lock_type == TL_WRITE_SKIP_LOCKED ||
|
- lock_type == TL_READ_SKIP_LOCKED);
|
+ m_prebuilt->skip_locked= false;
|
|
if (!trx_is_started(trx)
|
&& (m_prebuilt->select_lock_type != LOCK_NONE
|
diff --git a/storage/innobase/handler/ha_innodb.h b/storage/innobase/handler/ha_innodb.h
|
index 1f42bf180a8..5f1b67bb249 100644
|
--- a/storage/innobase/handler/ha_innodb.h
|
+++ b/storage/innobase/handler/ha_innodb.h
|
@@ -59,16 +59,10 @@ class ha_innobase final : public handler
|
ha_innobase(handlerton* hton, TABLE_SHARE* table_arg);
|
~ha_innobase() override;
|
|
- /** @return the transaction that last modified the table definition
|
- @see dict_table_t::def_trx_id */
|
- ulonglong table_version() const override;
|
-
|
/** Get the row type from the storage engine. If this method returns
|
ROW_TYPE_NOT_USED, the information in HA_CREATE_INFO should be used. */
|
enum row_type get_row_type() const override;
|
|
- const char* table_type() const override;
|
-
|
const char* index_type(uint key_number) override;
|
|
Table_flags table_flags() const override;
|
diff --git a/storage/innobase/handler/handler0alter.cc b/storage/innobase/handler/handler0alter.cc
|
index 7e4beeede3b..12dfc2f5a98 100644
|
--- a/storage/innobase/handler/handler0alter.cc
|
+++ b/storage/innobase/handler/handler0alter.cc
|
@@ -103,6 +103,8 @@ static const alter_table_operations INNOBASE_ALTER_REBUILD
|
static const alter_table_operations INNOBASE_ALTER_DATA
|
= INNOBASE_ONLINE_CREATE | INNOBASE_ALTER_REBUILD;
|
|
+#define ALTER_INDEX_IGNORABILITY 0
|
+
|
/** Operations for altering a table that InnoDB does not care about */
|
static const alter_table_operations INNOBASE_INPLACE_IGNORE
|
= ALTER_COLUMN_DEFAULT
|
@@ -11439,8 +11441,10 @@ ha_innobase::commit_inplace_alter_table(
|
|
During recovery, the purge of InnoDB transaction history will
|
not start until innodb_ddl_recovery_done(). */
|
+#if 0
|
ha_alter_info->inplace_alter_table_committed = purge_sys.resume_SYS;
|
purge_sys.stop_SYS();
|
+#endif
|
trx->commit(deleted);
|
|
/* At this point, the changes to the persistent storage have
|
diff --git a/storage/innobase/include/univ.i b/storage/innobase/include/univ.i
|
index c5f62f6cf57..23eee89f857 100644
|
--- a/storage/innobase/include/univ.i
|
+++ b/storage/innobase/include/univ.i
|
@@ -32,6 +32,7 @@ Created 1/20/1994 Heikki Tuuri
|
****************************************************************************/
|
|
#pragma once
|
+#define my_test_if_thinly_provisioned(f) 0
|
|
/* aux macros to convert M into "123" (string) if M is defined like
|
#define M 123 */
|
diff --git a/storage/innobase/row/row0ins.cc b/storage/innobase/row/row0ins.cc
|
index bd998094f42..d9bc72bee28 100644
|
--- a/storage/innobase/row/row0ins.cc
|
+++ b/storage/innobase/row/row0ins.cc
|
@@ -2562,7 +2562,7 @@ row_ins_index_entry_big_rec(
|
return(error);
|
}
|
|
-#ifdef HAVE_REPLICATION /* Working around MDEV-24622 */
|
+#if 0
|
extern "C" int thd_is_slave(const MYSQL_THD thd);
|
#else
|
# define thd_is_slave(thd) 0
|
@@ -2732,7 +2732,7 @@ row_ins_clust_index_entry_low(
|
goto skip_bulk_insert;
|
}
|
|
-#ifdef WITH_WSREP
|
+#if 0
|
if (trx->is_wsrep())
|
{
|
if (!wsrep_thd_is_local_transaction(trx->mysql_thd))
|
diff --git a/storage/innobase/trx/trx0trx.cc b/storage/innobase/trx/trx0trx.cc
|
index ed1187e179b..ec5d14cc60a 100644
|
--- a/storage/innobase/trx/trx0trx.cc
|
+++ b/storage/innobase/trx/trx0trx.cc
|
@@ -1111,9 +1111,8 @@ trx_finalize_for_fts(
|
trx->fts_trx = NULL;
|
}
|
|
-extern "C" MYSQL_THD thd_increment_pending_ops(MYSQL_THD);
|
-extern "C" void thd_decrement_pending_ops(MYSQL_THD);
|
-
|
+static MYSQL_THD thd_increment_pending_ops(MYSQL_THD) {return nullptr;}
|
+static void thd_decrement_pending_ops(MYSQL_THD) {}
|
|
#include "../log/log0sync.h"
|
|
EOF
|
As you can see from the diff, this may break some DDL recovery as well as something related to replication and Galera.
For convenience, I made this hybrid available in one commit that I did not test outside this test case.
With this hybrid, I got better than the 10.5 performance for the test: 9111ms, 9345ms, 9220ms, 9557ms, 9809ms.
A 10.6 485a1b1f116f0c5e73fce3a97ffdac84c861b3c2 with the same build options (CMAKE_BUILD_TYPE=RelWithDebInfo PLUGIN_PERFSCHEMA=NO) is consistently slower: 10950ms, 13908ms, 13529ms, 13734ms. Earlier today, it was 13 to 14 seconds; the 10.9s here is a clear outlier.
I think that this proves that the source of the regression resides outside InnoDB.
When I analyzed this with perf record, for both 10.5 and 10.6 I saw similar InnoDB functions being invoked during the ANALYZE statement. The top one is buf_LRU_remove_block(). I think that this is normal for the larger-than-buffer-pool test scenario.
I think that you will have to reduce the difference between this hybrid and 10.5 or 10.6 until the regression appears or disappears.
| Component/s | Optimizer [ 10200 ] | |
| Assignee | Marko Mäkelä [ marko ] | Sergei Petrunia [ psergey ] |
| Attachment | spetrunia-no-slowdown-1.png [ 69633 ] |
My results, using the commits Marko has mentioned:
commit 821e3d52c0e7405aea7054e138604ae1a4e8c921 (HEAD -> 10.56-MDEV-30986, origin/10.56-MDEV-30986)
|
commit 485a1b1f116f0c5e73fce3a97ffdac84c861b3c2 (HEAD)
|
psergey@blackbox:~/dev-git2/10.56-MDEV-30986/mysql-test$ ./mysql-test-run --mem --repeat=10 main/pt_large.test
|
Logging: ./mysql-test-run --mem --repeat=10 main/pt_large.test
|
main.pt_large 'innodb' [ pass ] 6449
|
main.pt_large 'innodb' [ 2 pass ] 6563
|
main.pt_large 'innodb' [ 3 pass ] 6413
|
main.pt_large 'innodb' [ 4 pass ] 6472
|
main.pt_large 'innodb' [ 5 pass ] 6466
|
main.pt_large 'innodb' [ 6 pass ] 6447
|
main.pt_large 'innodb' [ 7 pass ] 6504
|
main.pt_large 'innodb' [ 8 pass ] 6384
|
main.pt_large 'innodb' [ 9 pass ] 6346
|
main.pt_large 'innodb' [ 10 pass ] 6492
|
psergey@blackbox:~/dev-git2/10.6-MDEV-30986/mysql-test$ ./mysql-test-run --mem --repeat=10 main/pt_large.test
|
Logging: ./mysql-test-run --mem --repeat=10 main/pt_large.test
|
main.pt_large 'innodb' [ pass ] 6765
|
main.pt_large 'innodb' [ 2 pass ] 6487
|
main.pt_large 'innodb' [ 3 pass ] 6299
|
main.pt_large 'innodb' [ 4 pass ] 6621
|
main.pt_large 'innodb' [ 5 pass ] 6227
|
main.pt_large 'innodb' [ 6 pass ] 6875
|
main.pt_large 'innodb' [ 7 pass ] 6424
|
main.pt_large 'innodb' [ 8 pass ] 6542
|
main.pt_large 'innodb' [ 9 pass ] 6489
|
main.pt_large 'innodb' [ 10 pass ] 6213
|
Plotting these:
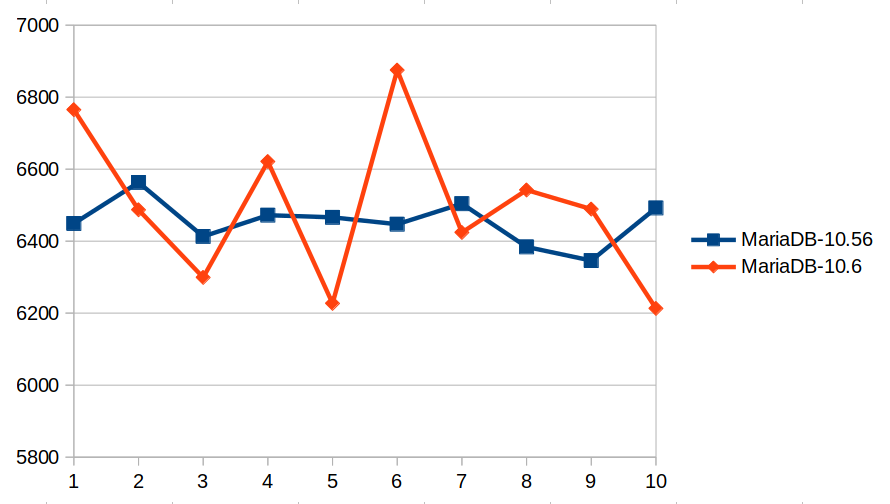
I can't reproduce the apparent slowdown...
| Attachment | image-2023-04-20-13-36-50-309.png [ 69634 ] |
Just wanted to highlight the "I/O bound" nature of this regression. My tests had shown larger difference on slow HDD vs faster SSD, while your runs with datadir in memory may mask some part of that.
| Attachment | perfschema-off-ramdisk-run1.png [ 69681 ] |
| Attachment | perfschema-off-ramdisk-run2.png [ 69682 ] |
| Attachment | perfschema-off-ramdisk-two-runs.png [ 69683 ] |
For the record, a re-run on the Ram disk with build cmake . -DCMAKE_BUILD_TYPE=RelWithDebInfo -DPLUGIN_PERFSCHEMA=NO.
Run 1:

Run2:

Both runs on the same chart:

The only conclusion I can make from these results is that 10.6 can achieve a faster performance, albeit it has some "unlucky" runs.
One more point that is worth noting that my 10.6 builds were using io_uring (MDEV-24883), while 10.5 only supports the older libaio (io_setup(), io_submit(), io_getevents()). On /dev/shm, libaio would not work and InnoDB would degrade to ‘simulated AIO’.
psergei, was your build cmake -DWITH_URING=YES or with liburing-dev available in the system? Can you include also 10.5 in your tests?
| Component/s | Optimizer [ 10200 ] |
| Attachment | rr-machine-17percent-slowdown.png [ 69704 ] |
Ok on the rr machine in Sophia,
cmake . -DCMAKE_BUILD_TYPE=RelWithDebInfo -DPLUGIN_PERFSCHEMA=NO
|
and
./mtr --repeat=10 pt_large
|
all in the home directory, I get a 17.5% slowdown of 10.6:

And could the cause of that be that 10.56-MDEV-30986 branch compiles into a binary that has innodb_use_native_aio=0, even if compiling 10.6 with the same compile flags produces a binary that has innodb_use_native_aio=1 ?
Specifying -DWITH_LIBAIO=1 doesn't seem to help, I still get the binary that doesn't use AIO. Even on the "rr" machine.
I do not see a speed regression when using MyISAM.
| Assignee | Sergei Petrunia [ psergey ] | Marko Mäkelä [ marko ] |
| Assignee | Marko Mäkelä [ marko ] | Sergei Petrunia [ psergey ] |
| Attachment | mdev-30986-tests.tgz [ 69714 ] |
| Attachment | mdev-30896-its-innodb-fault.ods [ 69715 ] |
Ok Please find attached:
mdev-30986-tests.tgz![]()
mdev-30896-its-innodb-fault.ods![]()
This is a collection of tests and their results. all done on the "rr in the VPN" machine. It shows that:
- pt_large: There is a clear 66% slowdown.
- pt2, pt2-nodistinct - It remains there if I remove partitioning (Question: could support team have figured this out or you guys needed optimizer dev for this? )
- other storage engines do not have any slowdowns larger than 1% : pt3-myisam, pt2-rocksdb.
As for InnoDB, removing the text column reduces the slowdown to 10% (pt4, pt5, pt6). I'm not sure if this due to text column presense of due to dataset becoming smaller.
| Assignee | Sergei Petrunia [ psergey ] | Marko Mäkelä [ marko ] |
| Summary | Slow full partition scan in 10.6 vs 10.5 for the (slow) I/O-bound case | Slow full index scan in 10.6 vs 10.5 for the (slow) I/O-bound case |
The test main.pt_large does not look particularly large to me. Its execution time varies a bit. On 10.6, the fastest I got was 9.0 seconds and the slowest 12.4 seconds when running on RAM disk. On 10.5, the times were between 9.6 and 11.0 seconds on RAM disk. It looks like using --repeat is not a good idea, because subsequent invocations would always be slower, likely due to purge lag.
If I run the test on fast NVMe storage, the first run will complete in 14.4 seconds on 10.5 and 15.6 seconds on 10.6. During the test execution, I observed at most 100 MB/s reads or writes; the maximum throughput is more than 20 times that. Disabling asynchronous I/O with
./mtr --mysqld=--skip-innodb-use-native-aio main.pt_large
|
does have some impact on the execution time: 15.4 seconds on 10.5 and 17.8 seconds on 10.6.
I think that we need a test case were the interesting part (such as the ANALYZE statement) shows a much clearer difference.
Which storage did you use on the rr machine? The Samsung MZ7KH480 SSD (sda) or the Hitachi HUS726T4TAL HDD (sdb)?
The rr host seems to be from the Ubuntu 20.04 era, running a Linux 5.4 kernel that is just new enough to support io_uring. There is no liburing package available. But, there was no libaio-dev package installed either. So, I assume that the comparison that was conducted by psergei was apples-to-apples, comparing some ‘simulated AIO’ builds. I think that asynchronous I/O is a must-have.
One more difference between 10.5 and 10.6 is that MDEV-24854 enabled innodb_flush_method=O_DIRECT, that is, disabled the file system cache, by default. I wonder if that could explain this. On my local system, I ran the following:
./mtr --mysqld=--innodb-flush-method=fsync main.pt_large
|
./mtr --mysqld=--innodb-flush-method=O_DIRECT main.pt_large
|
The execution times (1 sample each) were as follows:
| version | fsync | O_DIRECT |
|---|---|---|
| 10.5 | 14.8s | 15.0s |
| 10.6 | 14.4s | 15.7s |
Yes, there could be some regression for innodb_flush_method=O_DIRECT. I will investigate that deeper on the rr host.
I tried the following variation of the test:
source include/have_innodb.inc;
|
source include/have_partition.inc;
|
|
|
SET unique_checks=0, foreign_key_checks=0; |
set use_stat_tables=NEVER; |
SET profiling_history_size=100, profiling = 1; |
|
|
create table tp (id int, c1 date, c2 int, c3 text, primary key(id, c1)) |
ENGINE=InnoDB STATS_PERSISTENT=0
|
partition by range (to_days(c1)) |
(partition p1 values less than (734874), |
partition p2 values less than (735240), |
partition prest values less than (1000000)); |
SET profiling=0; |
|
|
BEGIN; |
delimiter ||;
|
for i in 1..50000 do execute immediate concat('insert into tp (id, c1, c2, c3) values (', i,', "2023-01-02", 1, repeat("a", 2000))'); execute immediate concat('insert into tp (id, c1, c2, c3) values (', i,', "2023-01-01", 2, repeat("b", 2000))'); end for|| |
delimiter ;||
|
COMMIT; |
source ../suite/innodb/include/wait_all_purged.inc;
|
|
|
SET unique_checks=1, foreign_key_checks=1, profiling=1; |
--disable_result_log
|
analyze format=json select distinct(c1) from tp partition (prest) as t1; |
analyze format=json select distinct(c1) from tp partition (prest) as t1; |
analyze format=json select distinct(c1) from tp partition (prest) as t1; |
analyze format=json select distinct(c1) from tp partition (prest) as t1; |
analyze format=json select distinct(c1) from tp partition (prest) as t1; |
analyze format=json select distinct(c1) from tp partition (prest) as t1; |
analyze format=json select distinct(c1) from tp partition (prest) as t1; |
analyze format=json select distinct(c1) from tp partition (prest) as t1; |
analyze format=json select distinct(c1) from tp partition (prest) as t1; |
analyze format=json select distinct(c1) from tp partition (prest) as t1; |
analyze format=json select distinct(c1) from tp partition (prest) as t1; |
analyze format=json select distinct(c1) from tp partition (prest) as t1; |
analyze format=json select distinct(c1) from tp partition (prest) as t1; |
analyze format=json select distinct(c1) from tp partition (prest) as t1; |
analyze format=json select distinct(c1) from tp partition (prest) as t1; |
--enable_result_log
|
SHOW PROFILES;
|
SET profiling=0; |
|
|
DROP TABLE tp; |
On both 10.5 and 10.6, I am seeing similar time being consumed during the ANALYZE statement according to SHOW PROFILES. Both are with innodb_flush_method=O_DIRECT to get an apples-to-apples comparison:
| version | CREATE | minimum | average | maximum | total time |
|---|---|---|---|---|---|
| 10.5 fsync | 0.003s | 0.336s | 0.369s | 0.500s | 25.731s |
| 10.6 fsync | 0.002s | 0.305s | 0.332s | 0.470s | 22.489s |
| 10.5 O_DIRECT | 0.003s | 0.822s | 0.846s | 0.871s | 32.318s |
| 10.6 O_DIRECT | 0.002s | 0.805s | 0.820s | 0.847s | 28.704s |
I am observing an improvement all over the board, no regression at all. The trick to stabilize the numbers might have been to wait for the purge of history, or to prevent the creation of INSERT history, by enabling bulk insert (MDEV-515) in the first place.
I was expecting the CREATE TABLE to take longer on 10.6 because of the durable DDL recovery log file write, but apparently MDEV-24626 compensated for that.
All across the board, I am observing a slight performance improvement on my local system. I will run the same test on the 4096-byte block size HDD of the rr host and report the results.
| Attachment | pt_large_restart.test [ 69724 ] |
On the Hitachi HUS726T4TAL hard disk of the rr host, the INSERT would take more than 10 minutes when using O_DIRECT. For innodb_flush_method=fsync, I got the following results:
| version | CREATE | minimum | average | maximum | total time |
|---|---|---|---|---|---|
| 10.5 fsync | 0.053s | 0.195s | 0.203s | 0.254s | 72.125s |
| 10.6 fsync | 0.020s | 0.190s | 0.194s | 0.226s | 37.760s |
I will revise the test so that after the INSERT, it will restart the server with O_DIRECT, to see how slow ANALYZE gets.
I've attached pt_lage_restart.test, the second version I mentioned in one of the first comments, that makes sure to flush ages to disk and restart the instance, to no have History list length of 0 all the time. This is what I get on 10.6.11:
Yuliyas-Air:mysql-test Valerii$ ./mtr --mysqld='--innodb_flush_log_at_trx_commit=0' --mysqld='--innodb_buffer_pool_size=128M' --suite=innodb pt_large_restart
|
Logging: ./mtr --mysqld=--innodb_flush_log_at_trx_commit=0 --mysqld=--innodb_buffer_pool_size=128M --suite=innodb pt_large_restart
|
VS config:
|
vardir: /Users/Valerii/dbs/maria10.6/mysql-test/var
|
Checking leftover processes...
|
Removing old var directory...
|
Creating var directory '/Users/Valerii/dbs/maria10.6/mysql-test/var'...
|
Checking supported features...
|
MariaDB Version 10.6.11-MariaDB
|
- SSL connections supported
|
Collecting tests...
|
Installing system database...
|
|
|
==============================================================================
|
|
|
TEST RESULT TIME (ms) or COMMENT
|
--------------------------------------------------------------------------
|
|
|
worker[1] Using MTR_BUILD_THREAD 300, with reserved ports 16000..16019
|
set default_storage_engine=innodb;
|
set use_stat_tables=NEVER||
|
create table tp (id int, c1 date, c2 int, c3 text, primary key(id, c1)) partition by range (to_days(c1)) (partition p1 values less than (734874), partition p2 values less than (735240), partition prest values less than (1000000))||
|
select @now := now(6)||
|
@now := now(6)
|
2023-04-24 14:02:43.728967
|
for i in 1..50000 do execute immediate concat('insert into tp (id, c1, c2, c3) values (', i,', "2023-01-02", 1, repeat("a", 2000))'); execute immediate concat('insert into tp (id, c1, c2, c3) values (', i,', "2023-01-01", 2, repeat("b", 2000))'); end for||
|
select timestampdiff(microsecond, @now, now(6))||
|
timestampdiff(microsecond, @now, now(6))
|
26182088
|
show table status like 'tp';||
|
Name tp
|
Engine InnoDB
|
Version 10
|
Row_format Dynamic
|
Rows 98004
|
Avg_row_length 3829
|
Data_length 375291904
|
Max_data_length 0
|
Index_length 0
|
Data_free 5242880
|
Auto_increment NULL
|
Create_time 2023-04-24 14:02:43
|
Update_time 2023-04-24 14:03:09
|
Check_time NULL
|
Collation latin1_swedish_ci
|
Checksum NULL
|
Create_options partitioned
|
Comment
|
Max_index_length 0
|
Temporary N
|
set global innodb_fast_shutdown = 0;
|
show engine innodb status;;
|
Type InnoDB
|
Name
|
Status
|
=====================================
|
2023-04-24 14:03:11 0x70000e3d1000 INNODB MONITOR OUTPUT
|
=====================================
|
Per second averages calculated from the last 0 seconds
|
-----------------
|
BACKGROUND THREAD
|
-----------------
|
srv_master_thread loops: 0 srv_active, 0 srv_shutdown, 1 srv_idle
|
srv_master_thread log flush and writes: 1
|
----------
|
SEMAPHORES
|
----------
|
------------
|
TRANSACTIONS
|
------------
|
Trx id counter 200039
|
Purge done for trx's n:o < 0 undo n:o < 0 state: running but idle
|
History list length 0
|
LIST OF TRANSACTIONS FOR EACH SESSION:
|
--------
|
FILE I/O
|
--------
|
Pending flushes (fsync) log: 0; buffer pool: 0
|
1793 OS file reads, 14 OS file writes, 3 OS fsyncs
|
0.00 reads/s, 3680 avg bytes/read, 0.00 writes/s, 0.00 fsyncs/s
|
-------------------------------------
|
INSERT BUFFER AND ADAPTIVE HASH INDEX
|
-------------------------------------
|
Ibuf: size 1, free list len 0, seg size 2, 0 merges
|
merged operations:
|
insert 0, delete mark 0, delete 0
|
discarded operations:
|
insert 0, delete mark 0, delete 0
|
0.00 hash searches/s, 0.00 non-hash searches/s
|
---
|
LOG
|
---
|
Log sequence number 464782152
|
Log flushed up to 464782152
|
Pages flushed up to 464782152
|
Last checkpoint at 464782140
|
0 pending log flushes, 0 pending chkp writes
|
4 log i/o's done, 4.00 log i/o's/second
|
----------------------
|
BUFFER POOL AND MEMORY
|
----------------------
|
Total large memory allocated 136314880
|
Dictionary memory allocated 851728
|
Buffer pool size 8030
|
Free buffers 6084
|
Database pages 1946
|
Old database pages 738
|
Modified db pages 0
|
Percent of dirty pages(LRU & free pages): 0.000
|
Max dirty pages percent: 90.000
|
Pending reads 2
|
Pending writes: LRU 0, flush list 0
|
Pages made young 0, not young 0
|
0.00 youngs/s, 0.00 non-youngs/s
|
Pages read 1813, created 131, written 0
|
1813000.00 reads/s, 131000.00 creates/s, 0.00 writes/s
|
Buffer pool hit rate 0 / 1000, young-making rate 0 / 1000 not 0 / 1000
|
Pages read ahead 0.00/s, evicted without access 0.00/s, Random read ahead 0.00/s
|
LRU len: 1946, unzip_LRU len: 0
|
I/O sum[0]:cur[1], unzip sum[0]:cur[0]
|
--------------
|
ROW OPERATIONS
|
--------------
|
0 read views open inside InnoDB
|
Process ID=0, Main thread ID=0, state: sleeping
|
Number of rows inserted 0, updated 0, deleted 0, read 0
|
0.00 inserts/s, 0.00 updates/s, 0.00 deletes/s, 0.00 reads/s
|
Number of system rows inserted 0, updated 0, deleted 0, read 0
|
0.00 inserts/s, 0.00 updates/s, 0.00 deletes/s, 0.00 reads/s
|
----------------------------
|
END OF INNODB MONITOR OUTPUT
|
============================
|
|
|
select @now := now(6)||
|
@now := now(6)
|
2023-04-24 14:03:11.645681
|
analyze format=json select distinct(c1) from tp partition (prest)
|
as t1||
|
ANALYZE
|
{
|
"query_block": {
|
"select_id": 1,
|
"r_loops": 1,
|
"r_total_time_ms": 706.9322293,
|
"temporary_table": {
|
"table": {
|
"table_name": "t1",
|
"partitions": ["prest"],
|
"access_type": "index",
|
"key": "PRIMARY",
|
"key_length": "7",
|
"used_key_parts": ["id", "c1"],
|
"r_loops": 1,
|
"rows": 77871,
|
"r_rows": 100000,
|
"r_table_time_ms": 669.0188057,
|
"r_other_time_ms": 37.88767053,
|
"filtered": 100,
|
"r_filtered": 100,
|
"using_index": true
|
}
|
}
|
}
|
}
|
select timestampdiff(microsecond, @now, now(6))||
|
timestampdiff(microsecond, @now, now(6))
|
737349
|
select @now := now(6)||
|
@now := now(6)
|
2023-04-24 14:03:12.383433
|
analyze format=json select distinct(c1) from tp partition (prest)
|
as t1||
|
ANALYZE
|
{
|
"query_block": {
|
"select_id": 1,
|
"r_loops": 1,
|
"r_total_time_ms": 310.2243693,
|
"temporary_table": {
|
"table": {
|
"table_name": "t1",
|
"partitions": ["prest"],
|
"access_type": "index",
|
"key": "PRIMARY",
|
"key_length": "7",
|
"used_key_parts": ["id", "c1"],
|
"r_loops": 1,
|
"rows": 77871,
|
"r_rows": 100000,
|
"r_table_time_ms": 284.3054467,
|
"r_other_time_ms": 25.91094463,
|
"filtered": 100,
|
"r_filtered": 100,
|
"using_index": true
|
}
|
}
|
}
|
}
|
select timestampdiff(microsecond, @now, now(6))||
|
timestampdiff(microsecond, @now, now(6))
|
310015
|
show engine innodb status;||
|
Type InnoDB
|
Name
|
Status
|
=====================================
|
2023-04-24 14:03:12 0x70000e3d1000 INNODB MONITOR OUTPUT
|
=====================================
|
Per second averages calculated from the last 1 seconds
|
-----------------
|
BACKGROUND THREAD
|
-----------------
|
srv_master_thread loops: 0 srv_active, 0 srv_shutdown, 2 srv_idle
|
srv_master_thread log flush and writes: 2
|
----------
|
SEMAPHORES
|
----------
|
------------
|
TRANSACTIONS
|
------------
|
Trx id counter 200040
|
Purge done for trx's n:o < 0 undo n:o < 0 state: running but idle
|
History list length 0
|
LIST OF TRANSACTIONS FOR EACH SESSION:
|
---TRANSACTION (0x111c3ebc0), not started
|
0 lock struct(s), heap size 1128, 0 row lock(s)
|
--------
|
FILE I/O
|
--------
|
Pending flushes (fsync) log: 0; buffer pool: 0
|
46056 OS file reads, 14 OS file writes, 3 OS fsyncs
|
44185.81 reads/s, 16299 avg bytes/read, 0.00 writes/s, 0.00 fsyncs/s
|
-------------------------------------
|
INSERT BUFFER AND ADAPTIVE HASH INDEX
|
-------------------------------------
|
Ibuf: size 1, free list len 0, seg size 2, 0 merges
|
merged operations:
|
insert 0, delete mark 0, delete 0
|
discarded operations:
|
insert 0, delete mark 0, delete 0
|
0.00 hash searches/s, 0.00 non-hash searches/s
|
---
|
LOG
|
---
|
Log sequence number 464782152
|
Log flushed up to 464782152
|
Pages flushed up to 464782152
|
Last checkpoint at 464782140
|
0 pending log flushes, 0 pending chkp writes
|
4 log i/o's done, 0.00 log i/o's/second
|
----------------------
|
BUFFER POOL AND MEMORY
|
----------------------
|
Total large memory allocated 136314880
|
Dictionary memory allocated 860056
|
Buffer pool size 8030
|
Free buffers 0
|
Database pages 8030
|
Old database pages 2983
|
Modified db pages 0
|
Percent of dirty pages(LRU & free pages): 0.000
|
Max dirty pages percent: 90.000
|
Pending reads 0
|
Pending writes: LRU 0, flush list 0
|
Pages made young 0, not young 55110
|
0.00 youngs/s, 55054.95 non-youngs/s
|
Pages read 46042, created 131, written 0
|
44184.82 reads/s, 0.00 creates/s, 0.00 writes/s
|
Buffer pool hit rate 387 / 1000, young-making rate 0 / 1000 not 762 / 1000
|
Pages read ahead 0.00/s, evicted without access 613.39/s, Random read ahead 0.00/s
|
LRU len: 8030, unzip_LRU len: 0
|
I/O sum[0]:cur[44004], unzip sum[0]:cur[0]
|
--------------
|
ROW OPERATIONS
|
--------------
|
0 read views open inside InnoDB
|
Process ID=0, Main thread ID=0, state: sleeping
|
Number of rows inserted 0, updated 0, deleted 0, read 200000
|
0.00 inserts/s, 0.00 updates/s, 0.00 deletes/s, 199800.20 reads/s
|
Number of system rows inserted 0, updated 0, deleted 0, read 0
|
0.00 inserts/s, 0.00 updates/s, 0.00 deletes/s, 0.00 reads/s
|
----------------------------
|
END OF INNODB MONITOR OUTPUT
|
============================
|
|
|
select @now := now(6)||
|
@now := now(6)
|
2023-04-24 14:03:12.694533
|
drop table tp||
|
select timestampdiff(microsecond, @now, now(6))||
|
timestampdiff(microsecond, @now, now(6))
|
51823
|
innodb.pt_large_restart 'innodb' [ pass ] 29051
|
--------------------------------------------------------------------------
|
The servers were restarted 0 times
|
Spent 29.051 of 46 seconds executing testcases
|
|
|
Completed: All 1 tests were successful.
|
Note time to execute the query in the ANALYZE outputs for the 1st and 2nd runs after startup:
"r_total_time_ms": 706.9322293,
"r_total_time_ms": 310.2243693,
Now with 10.5.20 I have:
Yuliyas-Air:mysql-test Valerii$ ./mtr --mysqld='--innodb_flush_log_at_trx_commit=0' --mysqld='--innodb_buffer_pool_size=128M' --suite=innodb pt_large_restart
|
Logging: ./mtr --mysqld=--innodb_flush_log_at_trx_commit=0 --mysqld=--innodb_buffer_pool_size=128M --suite=innodb pt_large_restart
|
VS config:
|
vardir: /Users/Valerii/dbs/maria10.5/mysql-test/var
|
Checking leftover processes...
|
Removing old var directory...
|
Creating var directory '/Users/Valerii/dbs/maria10.5/mysql-test/var'...
|
Checking supported features...
|
MariaDB Version 10.5.20-MariaDB
|
- SSL connections supported
|
Collecting tests...
|
Installing system database...
|
|
|
==============================================================================
|
|
|
TEST RESULT TIME (ms) or COMMENT
|
--------------------------------------------------------------------------
|
|
|
worker[1] Using MTR_BUILD_THREAD 300, with reserved ports 16000..16019
|
set default_storage_engine=innodb;
|
set use_stat_tables=NEVER||
|
create table tp (id int, c1 date, c2 int, c3 text, primary key(id, c1)) partition by range (to_days(c1)) (partition p1 values less than (734874), partition p2 values less than (735240), partition prest values less than (1000000))||
|
select @now := now(6)||
|
@now := now(6)
|
2023-04-24 14:04:43.448977
|
for i in 1..50000 do execute immediate concat('insert into tp (id, c1, c2, c3) values (', i,', "2023-01-02", 1, repeat("a", 2000))'); execute immediate concat('insert into tp (id, c1, c2, c3) values (', i,', "2023-01-01", 2, repeat("b", 2000))'); end for||
|
select timestampdiff(microsecond, @now, now(6))||
|
timestampdiff(microsecond, @now, now(6))
|
28289724
|
show table status like 'tp';||
|
Name tp
|
Engine InnoDB
|
Version 10
|
Row_format Dynamic
|
Rows 100010
|
Avg_row_length 4424
|
Data_length 442449920
|
Max_data_length 0
|
Index_length 0
|
Data_free 5242880
|
Auto_increment NULL
|
Create_time 2023-04-24 14:04:43
|
Update_time 2023-04-24 14:05:11
|
Check_time NULL
|
Collation latin1_swedish_ci
|
Checksum NULL
|
Create_options partitioned
|
Comment
|
Max_index_length 0
|
Temporary N
|
set global innodb_fast_shutdown = 0;
|
show engine innodb status;;
|
Type InnoDB
|
Name
|
Status
|
=====================================
|
2023-04-24 14:05:13 0x700006c93000 INNODB MONITOR OUTPUT
|
=====================================
|
Per second averages calculated from the last 0 seconds
|
-----------------
|
BACKGROUND THREAD
|
-----------------
|
srv_master_thread loops: 0 srv_active, 0 srv_shutdown, 1 srv_idle
|
srv_master_thread log flush and writes: 1
|
----------
|
SEMAPHORES
|
----------
|
OS WAIT ARRAY INFO: reservation count 0
|
OS WAIT ARRAY INFO: signal count 0
|
RW-shared spins 0, rounds 0, OS waits 0
|
RW-excl spins 0, rounds 0, OS waits 0
|
RW-sx spins 0, rounds 0, OS waits 0
|
Spin rounds per wait: 0.00 RW-shared, 0.00 RW-excl, 0.00 RW-sx
|
------------
|
TRANSACTIONS
|
------------
|
Trx id counter 200034
|
Purge done for trx's n:o < 0 undo n:o < 0 state: running but idle
|
History list length 0
|
LIST OF TRANSACTIONS FOR EACH SESSION:
|
--------
|
FILE I/O
|
--------
|
Pending flushes (fsync) log: 0; buffer pool: 0
|
2043 OS file reads, 14 OS file writes, 3 OS fsyncs
|
0.00 reads/s, 3321 avg bytes/read, 0.00 writes/s, 0.00 fsyncs/s
|
-------------------------------------
|
INSERT BUFFER AND ADAPTIVE HASH INDEX
|
-------------------------------------
|
Ibuf: size 1, free list len 0, seg size 2, 0 merges
|
merged operations:
|
insert 0, delete mark 0, delete 0
|
discarded operations:
|
insert 0, delete mark 0, delete 0
|
0.00 hash searches/s, 42000.00 non-hash searches/s
|
---
|
LOG
|
---
|
Log sequence number 464006592
|
Log flushed up to 464006592
|
Pages flushed up to 464006592
|
Last checkpoint at 464006580
|
0 pending log flushes, 0 pending chkp writes
|
4 log i/o's done, 4.00 log i/o's/second
|
----------------------
|
BUFFER POOL AND MEMORY
|
----------------------
|
Total large memory allocated 136314880
|
Dictionary memory allocated 854472
|
Buffer pool size 8065
|
Free buffers 5903
|
Database pages 2162
|
Old database pages 818
|
Modified db pages 0
|
Percent of dirty pages(LRU & free pages): 0.000
|
Max dirty pages percent: 90.000
|
Pending reads 0
|
Pending writes: LRU 0, flush list 0
|
Pages made young 0, not young 0
|
0.00 youngs/s, 0.00 non-youngs/s
|
Pages read 2031, created 131, written 0
|
2031000.00 reads/s, 131000.00 creates/s, 0.00 writes/s
|
Buffer pool hit rate 0 / 1000, young-making rate 0 / 1000 not 0 / 1000
|
Pages read ahead 0.00/s, evicted without access 0.00/s, Random read ahead 0.00/s
|
LRU len: 2162, unzip_LRU len: 0
|
I/O sum[0]:cur[3], unzip sum[0]:cur[0]
|
--------------
|
ROW OPERATIONS
|
--------------
|
0 read views open inside InnoDB
|
Process ID=0, Main thread ID=0, state: sleeping
|
Number of rows inserted 0, updated 0, deleted 0, read 0
|
0.00 inserts/s, 0.00 updates/s, 0.00 deletes/s, 0.00 reads/s
|
Number of system rows inserted 0, updated 0, deleted 0, read 0
|
0.00 inserts/s, 0.00 updates/s, 0.00 deletes/s, 0.00 reads/s
|
----------------------------
|
END OF INNODB MONITOR OUTPUT
|
============================
|
|
|
select @now := now(6)||
|
@now := now(6)
|
2023-04-24 14:05:13.484345
|
analyze format=json select distinct(c1) from tp partition (prest)
|
as t1||
|
ANALYZE
|
{
|
"query_block": {
|
"select_id": 1,
|
"r_loops": 1,
|
"r_total_time_ms": 391.1858344,
|
"temporary_table": {
|
"table": {
|
"table_name": "t1",
|
"partitions": ["prest"],
|
"access_type": "index",
|
"key": "PRIMARY",
|
"key_length": "7",
|
"used_key_parts": ["id", "c1"],
|
"r_loops": 1,
|
"rows": 87509,
|
"r_rows": 100000,
|
"r_table_time_ms": 366.9290333,
|
"r_other_time_ms": 23.96928444,
|
"filtered": 100,
|
"r_filtered": 100,
|
"using_index": true
|
}
|
}
|
}
|
}
|
select timestampdiff(microsecond, @now, now(6))||
|
timestampdiff(microsecond, @now, now(6))
|
436253
|
select @now := now(6)||
|
@now := now(6)
|
2023-04-24 14:05:13.921029
|
analyze format=json select distinct(c1) from tp partition (prest)
|
as t1||
|
ANALYZE
|
{
|
"query_block": {
|
"select_id": 1,
|
"r_loops": 1,
|
"r_total_time_ms": 288.2182377,
|
"temporary_table": {
|
"table": {
|
"table_name": "t1",
|
"partitions": ["prest"],
|
"access_type": "index",
|
"key": "PRIMARY",
|
"key_length": "7",
|
"used_key_parts": ["id", "c1"],
|
"r_loops": 1,
|
"rows": 87509,
|
"r_rows": 100000,
|
"r_table_time_ms": 264.843736,
|
"r_other_time_ms": 23.36205463,
|
"filtered": 100,
|
"r_filtered": 100,
|
"using_index": true
|
}
|
}
|
}
|
}
|
select timestampdiff(microsecond, @now, now(6))||
|
timestampdiff(microsecond, @now, now(6))
|
288621
|
show engine innodb status;||
|
Type InnoDB
|
Name
|
Status
|
=====================================
|
2023-04-24 14:05:14 0x700006c93000 INNODB MONITOR OUTPUT
|
=====================================
|
Per second averages calculated from the last 1 seconds
|
-----------------
|
BACKGROUND THREAD
|
-----------------
|
srv_master_thread loops: 0 srv_active, 0 srv_shutdown, 1 srv_idle
|
srv_master_thread log flush and writes: 1
|
----------
|
SEMAPHORES
|
----------
|
OS WAIT ARRAY INFO: reservation count 0
|
OS WAIT ARRAY INFO: signal count 0
|
RW-shared spins 0, rounds 0, OS waits 0
|
RW-excl spins 0, rounds 0, OS waits 0
|
RW-sx spins 0, rounds 0, OS waits 0
|
Spin rounds per wait: 0.00 RW-shared, 0.00 RW-excl, 0.00 RW-sx
|
------------
|
TRANSACTIONS
|
------------
|
Trx id counter 200034
|
Purge done for trx's n:o < 0 undo n:o < 0 state: running but idle
|
History list length 0
|
LIST OF TRANSACTIONS FOR EACH SESSION:
|
---TRANSACTION 281479429550256, not started
|
0 lock struct(s), heap size 1128, 0 row lock(s)
|
--------
|
FILE I/O
|
--------
|
Pending flushes (fsync) log: 0; buffer pool: 0
|
46067 OS file reads, 14 OS file writes, 3 OS fsyncs
|
43980.02 reads/s, 16384 avg bytes/read, 0.00 writes/s, 0.00 fsyncs/s
|
-------------------------------------
|
INSERT BUFFER AND ADAPTIVE HASH INDEX
|
-------------------------------------
|
Ibuf: size 1, free list len 0, seg size 2, 0 merges
|
merged operations:
|
insert 0, delete mark 0, delete 0
|
discarded operations:
|
insert 0, delete mark 0, delete 0
|
0.00 hash searches/s, 5.99 non-hash searches/s
|
---
|
LOG
|
---
|
Log sequence number 464006592
|
Log flushed up to 464006592
|
Pages flushed up to 464006592
|
Last checkpoint at 464006580
|
0 pending log flushes, 0 pending chkp writes
|
4 log i/o's done, 0.00 log i/o's/second
|
----------------------
|
BUFFER POOL AND MEMORY
|
----------------------
|
Total large memory allocated 136314880
|
Dictionary memory allocated 856936
|
Buffer pool size 8065
|
Free buffers 0
|
Database pages 8065
|
Old database pages 2996
|
Modified db pages 0
|
Percent of dirty pages(LRU & free pages): 0.000
|
Max dirty pages percent: 90.000
|
Pending reads 0
|
Pending writes: LRU 0, flush list 0
|
Pages made young 0, not young 55087
|
0.00 youngs/s, 55031.97 non-youngs/s
|
Pages read 46055, created 131, written 0
|
43980.02 reads/s, 0.00 creates/s, 0.00 writes/s
|
Buffer pool hit rate 390 / 1000, young-making rate 0 / 1000 not 762 / 1000
|
Pages read ahead 0.00/s, evicted without access 608.39/s, Random read ahead 0.00/s
|
LRU len: 8065, unzip_LRU len: 0
|
I/O sum[0]:cur[44028], unzip sum[0]:cur[0]
|
--------------
|
ROW OPERATIONS
|
--------------
|
0 read views open inside InnoDB
|
Process ID=0, Main thread ID=0, state: sleeping
|
Number of rows inserted 0, updated 0, deleted 0, read 200000
|
0.00 inserts/s, 0.00 updates/s, 0.00 deletes/s, 199800.20 reads/s
|
Number of system rows inserted 0, updated 0, deleted 0, read 0
|
0.00 inserts/s, 0.00 updates/s, 0.00 deletes/s, 0.00 reads/s
|
----------------------------
|
END OF INNODB MONITOR OUTPUT
|
============================
|
|
|
select @now := now(6)||
|
@now := now(6)
|
2023-04-24 14:05:14.210392
|
drop table tp||
|
select timestampdiff(microsecond, @now, now(6))||
|
timestampdiff(microsecond, @now, now(6))
|
62708
|
innodb.pt_large_restart 'innodb' [ pass ] 30859
|
--------------------------------------------------------------------------
|
The servers were restarted 0 times
|
Spent 30.859 of 38 seconds executing testcases
|
|
|
Completed: All 1 tests were successful.
|
Time to run the entire test on 10.5.20 is larger, not much. But ANALYZE runs give these:
"r_total_time_ms": 391.1858344,
"r_total_time_ms": 288.2182377,
and these are substantially faster even on the SSD. This difference is what matters, and if not fix me and customer need a way to get similar execution times on 10.6 for the ANALYZE (and thus SELECT), even if additional non-default settings are needed in 10.6 to get these.
If we just need to add innodb_flush_method=fsync explicitly to make 10.6 "as fast" as 10.5 (it seems to help indeed)
"r_total_time_ms": 406.8236222,
"r_total_time_ms": 286.6155398,
then this should be a conclusion and we should add a warning somewhere that with a new default for innodb_flush_method 10.6 may be slower...
| Status | In Progress [ 3 ] | Needs Feedback [ 10501 ] |
With innodb_flush_method=O_DIRECT, 10.5 is significantly worse. For some reason, the second ANALYZE run was by far the slowest. I am including the full numbers below:
| 10.5 ANALYZE time/s | 10.6 ANALYZE time/s |
|---|---|
| 3.9069604 | 0.24748087 |
| 26.60262763 | 0.23314317 |
| 0.26027637 | 0.19116037 |
| 0.19230987 | 0.19227328 |
| 0.19177676 | 0.19072041 |
| 0.19297082 | 0.19071689 |
| 0.19308484 | 0.19116926 |
| 0.19359286 | 0.19095569 |
| 0.19475017 | 0.19133426 |
| 0.19430904 | 0.19092622 |
| 0.19462896 | 0.19187903 |
| 0.19473983 | 0.19106976 |
| 0.19513314 | 0.19105468 |
| 0.19577765 | 0.19111574 |
| 0.19592556 | 0.1911793 |
It looks like most of the data is cached during the first 3 runs. From then onwards there is not so much change, but 10.6 is slightly faster than 10.5. The total test run time (including a slow shutdown and a restart with innodb_flush_method=O_DIRECT that I added in the middle) was 75.403s (10.5) and 29.380s (10.6).
valerii, is this really a bug, or an expected outcome of MDEV-24854?
| Link |
This issue relates to |
| Assignee | Marko Mäkelä [ marko ] | Valerii Kravchuk [ valerii ] |
| Link |
This issue relates to |
I think that to get a valid comparison of read performance between innodb_flush_method=fsync and innodb_flush_method=O_DIRECT, we have to set innodb_buffer_pool_size to at least 80% of the available memory. In other words, to run such a reasonably small test (about 500MiB of data in an 8MiB buffer pool), we would have to limit the available system memory in the kernel to something like 10MiB, and then see if reads with O_DIRECT are slower. If yes, the answer should be MDEV-29967.
| Assignee | Valerii Kravchuk [ valerii ] | |
| Status | Needs Feedback [ 10501 ] | Open [ 1 ] |
| Attachment | MDEV-30986-Ubuntu-10.5.txt [ 69982 ] | |
| Attachment | MDEV-30986-Ubuntu-10.6.txt [ 69983 ] |
I had a chance to test on current Ubuntu 22.04 with slow HDD:
openxs@ao756:~/dbs/maria10.5/mysql-test$ uname -a
|
Linux ao756 5.19.0-38-generic #39~22.04.1-Ubuntu SMP PREEMPT_DYNAMIC Fri Mar 17 21:16:15 UTC 2 x86_64 x86_64 x86_64 GNU/Linux
|
openxs@ao756:~/dbs/maria10.5/mysql-test$ free -m
|
total used free shared buff/cache available
|
Mem: 3740 734 758 130 2247 2603
|
Swap: 979 282 697
|
See the files attached, with the following 3 runs each:
Yuliyas-Air:mysql-test Valerii$ grep -n -e --innodb_flush_method -e r_total_time_ms -e pass ~/Downloads/MDEV-30986-Ubuntu-10.*.txt
|
/Users/Valerii/Downloads/MDEV-30986-Ubuntu-10.5.txt:1:openxs@ao756:~/dbs/maria10.5/mysql-test$ ./mtr --mysqld='--innodb_flush_log_at_trx_commit=0' --mysqld='--innodb_buffer_pool_size=128M' --mysqld='--innodb_flush_method=fsync' --suite=innodb pt_large
|
/Users/Valerii/Downloads/MDEV-30986-Ubuntu-10.5.txt:2:Logging: ./mtr --mysqld=--innodb_flush_log_at_trx_commit=0 --mysqld=--innodb_buffer_pool_size=128M --mysqld=--innodb_flush_method=fsync --suite=innodb pt_large
|
/Users/Valerii/Downloads/MDEV-30986-Ubuntu-10.5.txt:156: "r_total_time_ms": 496.357046,
|
/Users/Valerii/Downloads/MDEV-30986-Ubuntu-10.5.txt:190: "r_total_time_ms": 391.5635888,
|
/Users/Valerii/Downloads/MDEV-30986-Ubuntu-10.5.txt:311:innodb.pt_large 'innodb' [ pass ] 104998
|
/Users/Valerii/Downloads/MDEV-30986-Ubuntu-10.5.txt:318:openxs@ao756:~/dbs/maria10.5/mysql-test$ ./mtr --mysqld='--innodb_flush_log_at_trx_commit=0' --mysqld='--innodb_buffer_pool_size=128M' --mysqld='--innodb_flush_method=O_DIRECT' --suite=innodb pt_large
|
/Users/Valerii/Downloads/MDEV-30986-Ubuntu-10.5.txt:319:Logging: ./mtr --mysqld=--innodb_flush_log_at_trx_commit=0 --mysqld=--innodb_buffer_pool_size=128M --mysqld=--innodb_flush_method=O_DIRECT --suite=innodb pt_large
|
/Users/Valerii/Downloads/MDEV-30986-Ubuntu-10.5.txt:473: "r_total_time_ms": 25937.55648,
|
/Users/Valerii/Downloads/MDEV-30986-Ubuntu-10.5.txt:507: "r_total_time_ms": 22702.75002,
|
/Users/Valerii/Downloads/MDEV-30986-Ubuntu-10.5.txt:628:innodb.pt_large 'innodb' [ pass ] 155552
|
/Users/Valerii/Downloads/MDEV-30986-Ubuntu-10.5.txt:635:openxs@ao756:~/dbs/maria10.5/mysql-test$ ./mtr --mysqld='--innodb_flush_log_at_trx_commit=0' --mysqld='--innodb_buffer_pool_size=1280M' --mysqld='--innodb_flush_method=O_DIRECT' --suite=innodb pt_large
|
/Users/Valerii/Downloads/MDEV-30986-Ubuntu-10.5.txt:636:Logging: ./mtr --mysqld=--innodb_flush_log_at_trx_commit=0 --mysqld=--innodb_buffer_pool_size=1280M --mysqld=--innodb_flush_method=O_DIRECT --suite=innodb pt_large
|
/Users/Valerii/Downloads/MDEV-30986-Ubuntu-10.5.txt:790: "r_total_time_ms": 9243.675492,
|
/Users/Valerii/Downloads/MDEV-30986-Ubuntu-10.5.txt:824: "r_total_time_ms": 102.082341,
|
/Users/Valerii/Downloads/MDEV-30986-Ubuntu-10.5.txt:945:innodb.pt_large 'innodb' [ pass ] 110834
|
/Users/Valerii/Downloads/MDEV-30986-Ubuntu-10.6.txt:1:openxs@ao756:~/dbs/maria10.6/mysql-test$ ./mtr --mysqld='--innodb_flush_log_at_trx_commit=0' --mysqld='--innodb_buffer_pool_size=128M' --mysqld='--innodb_flush_method=fsync' --suite=innodb pt_large
|
/Users/Valerii/Downloads/MDEV-30986-Ubuntu-10.6.txt:2:Logging: ./mtr --mysqld=--innodb_flush_log_at_trx_commit=0 --mysqld=--innodb_buffer_pool_size=128M --mysqld=--innodb_flush_method=fsync --suite=innodb pt_large
|
/Users/Valerii/Downloads/MDEV-30986-Ubuntu-10.6.txt:150: "r_total_time_ms": 551.6600057,
|
/Users/Valerii/Downloads/MDEV-30986-Ubuntu-10.6.txt:184: "r_total_time_ms": 451.2432058,
|
/Users/Valerii/Downloads/MDEV-30986-Ubuntu-10.6.txt:299:innodb.pt_large 'innodb' [ pass ] 130955
|
/Users/Valerii/Downloads/MDEV-30986-Ubuntu-10.6.txt:306:openxs@ao756:~/dbs/maria10.6/mysql-test$ ./mtr --mysqld='--innodb_flush_log_at_trx_commit=0' --mysqld='--innodb_buffer_pool_size=128M' --mysqld='--innodb_flush_method=O_DIRECT' --suite=innodb pt_large
|
/Users/Valerii/Downloads/MDEV-30986-Ubuntu-10.6.txt:307:Logging: ./mtr --mysqld=--innodb_flush_log_at_trx_commit=0 --mysqld=--innodb_buffer_pool_size=128M --mysqld=--innodb_flush_method=O_DIRECT --suite=innodb pt_large
|
/Users/Valerii/Downloads/MDEV-30986-Ubuntu-10.6.txt:455: "r_total_time_ms": 27093.90384,
|
/Users/Valerii/Downloads/MDEV-30986-Ubuntu-10.6.txt:489: "r_total_time_ms": 23311.43856,
|
/Users/Valerii/Downloads/MDEV-30986-Ubuntu-10.6.txt:604:innodb.pt_large 'innodb' [ pass ] 176075
|
/Users/Valerii/Downloads/MDEV-30986-Ubuntu-10.6.txt:611:openxs@ao756:~/dbs/maria10.6/mysql-test$ ./mtr --mysqld='--innodb_flush_log_at_trx_commit=0' --mysqld='--innodb_buffer_pool_size=1280M' --mysqld='--innodb_flush_method=O_DIRECT' --suite=innodb pt_large
|
/Users/Valerii/Downloads/MDEV-30986-Ubuntu-10.6.txt:612:Logging: ./mtr --mysqld=--innodb_flush_log_at_trx_commit=0 --mysqld=--innodb_buffer_pool_size=1280M --mysqld=--innodb_flush_method=O_DIRECT --suite=innodb pt_large
|
/Users/Valerii/Downloads/MDEV-30986-Ubuntu-10.6.txt:760: "r_total_time_ms": 10542.35765,
|
/Users/Valerii/Downloads/MDEV-30986-Ubuntu-10.6.txt:794: "r_total_time_ms": 98.09320044,
|
/Users/Valerii/Downloads/MDEV-30986-Ubuntu-10.6.txt:909:innodb.pt_large 'innodb' [ pass ] 132869
|
So, I tested full partition scan on the table with some 447M of data with innodb_buffer_pool_size of 128M and innodb_flush_method=fsync and then O_DIRECT and finally with innodb_buffer_poll_size of 1280M and innodb_flush_method=O_DIRECT - this makes test data to fit in memory entirely and represents the best possible tuning effort with O_DIRECT, using as large buffer pool as possible ("80% of RAM").
You can make your own conclusions from raw outputs of grep results above, but mine are the following:
1. 10.6 is always slower on this platform and with this test for the first query run after startup and for the total time to execute the test, with the only exception of the second run of the query with all data already in the buffer pool - here we get 98.09 ms vs 102.08 on 10.5.
2. The only way to get predictable execution time for both runs of the query, on both 10.5 and 10.6 (around 0.5 seconds), is to rely on fsync and let filesystem cache to do the job (by setting innodb_buffer_pool way smaller that the data size).
3. 10,5 can be slow down closer to 10.6 level by forcing non-default O_DIRECT with a small buffer pool.
Next step would be to test with the table size that is bigger than RAM anyway, but it will take time to complete.
| Attachment | MDEV-30986-Ubuntu-10.6.4G.txt [ 69984 ] | |
| Attachment | MDEV-30986-Ubuntu-10.5.4G.txt [ 69985 ] |
I've scaled up the test to make the table 10 times larger (1 million rows in total, more than 4G in size):
openxs@ao756:~/dbs/maria10.6/mysql-test$ cat suite/innodb/t/pt_large.test
|
source include/have_innodb.inc;
|
source include/have_partition.inc;
|
set default_storage_engine=innodb;
|
delimiter ||;
|
set use_stat_tables=NEVER||
|
|
|
select @@innodb_buffer_pool_size, @@innodb_flush_method||
|
|
|
create table tp (id int, c1 date, c2 int, c3 text, primary key(id, c1)) partition by range (to_days(c1)) (partition p1 values less than (734874), partition p2 values less than (735240), partition prest values less than (1000000))||
|
|
|
select @now := now(6)||
|
|
|
for i in 1..500000 do execute immediate concat('insert into tp (id, c1, c2, c3) values (', i,', "2023-01-02", 1, repeat("a", 2000))'); execute immediate concat('insert into tp (id, c1, c2, c3) values (', i,', "2023-01-01", 2, repeat("b", 2000))'); end for||
|
|
|
select timestampdiff(microsecond, @now, now(6))||
|
|
|
--query_vertical show table status like 'tp';
|
|
|
delimiter ;||
|
|
|
# try to force restart with flushing pages to disk
|
set global innodb_fast_shutdown = 0;
|
|
|
--exec echo "wait" > $MYSQLTEST_VARDIR/tmp/mysqld.1.expect
|
--shutdown_server 300
|
--source include/wait_until_disconnected.inc
|
|
|
--enable_reconnect
|
--exec echo "restart" > $MYSQLTEST_VARDIR/tmp/mysqld.1.expect
|
--source include/wait_until_connected_again.inc
|
|
|
--query_vertical show engine innodb status;
|
|
|
delimiter ||;
|
select @@innodb_buffer_pool_size, @@innodb_flush_method||
|
select @now := now(6)||
|
analyze format=json select distinct(c1) from tp partition (prest)
|
as t1||
|
select timestampdiff(microsecond, @now, now(6))||
|
|
|
select @now := now(6)||
|
analyze format=json select distinct(c1) from tp partition (prest)
|
as t1||
|
select timestampdiff(microsecond, @now, now(6))||
|
|
|
--query_vertical show engine innodb status;
|
|
|
select @now := now(6)||
|
drop table tp||
|
select timestampdiff(microsecond, @now, now(6))||
|
and got the results attached. Note that I have about 3G of RAM potetnailly free, so I tried to use innodb_buffer_size of 2400M besides 128M, and for 10.6 I tried it even larger, 2800M.
Quick grep check gives the following:
Yuliyas-Air:mysql-test Valerii$ grep -e --innodb_flush_method -e r_total_time_ms -e pass ~/Downloads/MDEV-30986-Ubuntu-10.*.4G.txt
|
/Users/Valerii/Downloads/MDEV-30986-Ubuntu-10.5.4G.txt:openxs@ao756:~/dbs/maria10.5/mysql-test$ ./mtr --mysqld='--innodb_flush_log_at_trx_commit=0' --mysqld='--innodb_buffer_pool_size=128M' --mysqld='--innodb_flush_method=fsync' --suite=innodb pt_large
|
/Users/Valerii/Downloads/MDEV-30986-Ubuntu-10.5.4G.txt:Logging: ./mtr --mysqld=--innodb_flush_log_at_trx_commit=0 --mysqld=--innodb_buffer_pool_size=128M --mysqld=--innodb_flush_method=fsync --suite=innodb pt_large
|
/Users/Valerii/Downloads/MDEV-30986-Ubuntu-10.5.4G.txt: "r_total_time_ms": 154980.2253,
|
/Users/Valerii/Downloads/MDEV-30986-Ubuntu-10.5.4G.txt: "r_total_time_ms": 113801.6701,
|
/Users/Valerii/Downloads/MDEV-30986-Ubuntu-10.5.4G.txt:innodb.pt_large 'innodb' [ pass ] 1315942
|
/Users/Valerii/Downloads/MDEV-30986-Ubuntu-10.5.4G.txt:openxs@ao756:~/dbs/maria10.5/mysql-test$ ./mtr --mysqld='--innodb_flush_log_at_trx_commit=0' --mysqld='--innodb_buffer_pool_size=128M' --mysqld='--innodb_flush_method=O_DIRECT' --suite=innodb pt_large
|
/Users/Valerii/Downloads/MDEV-30986-Ubuntu-10.5.4G.txt:Logging: ./mtr --mysqld=--innodb_flush_log_at_trx_commit=0 --mysqld=--innodb_buffer_pool_size=128M --mysqld=--innodb_flush_method=O_DIRECT --suite=innodb pt_large
|
/Users/Valerii/Downloads/MDEV-30986-Ubuntu-10.5.4G.txt: "r_total_time_ms": 271433.9297,
|
/Users/Valerii/Downloads/MDEV-30986-Ubuntu-10.5.4G.txt: "r_total_time_ms": 268807.7637,
|
/Users/Valerii/Downloads/MDEV-30986-Ubuntu-10.5.4G.txt:innodb.pt_large 'innodb' [ pass ] 1585979
|
/Users/Valerii/Downloads/MDEV-30986-Ubuntu-10.5.4G.txt:openxs@ao756:~/dbs/maria10.5/mysql-test$ ./mtr --mysqld='--innodb_flush_log_at_trx_commit=0' --mysqld='--innodb_buffer_pool_size=2400M' --mysqld='--innodb_flush_method=O_DIRECT' --suite=innodb pt_large
|
/Users/Valerii/Downloads/MDEV-30986-Ubuntu-10.5.4G.txt:Logging: ./mtr --mysqld=--innodb_flush_log_at_trx_commit=0 --mysqld=--innodb_buffer_pool_size=2400M --mysqld=--innodb_flush_method=O_DIRECT --suite=innodb pt_large
|
/Users/Valerii/Downloads/MDEV-30986-Ubuntu-10.5.4G.txt: "r_total_time_ms": 259845.7448,
|
/Users/Valerii/Downloads/MDEV-30986-Ubuntu-10.5.4G.txt: "r_total_time_ms": 183421.3625,
|
/Users/Valerii/Downloads/MDEV-30986-Ubuntu-10.5.4G.txt:innodb.pt_large 'innodb' [ pass ] 1496836
|
/Users/Valerii/Downloads/MDEV-30986-Ubuntu-10.5.4G.txt:openxs@ao756:~/dbs/maria10.5/mysql-test$ ./mtr --mysqld='--innodb_flush_log_at_trx_commit=0' --mysqld='--innodb_buffer_pool_size=2400M' --mysqld='--innodb_flush_method=fsync' --suite=innodb pt_large
|
/Users/Valerii/Downloads/MDEV-30986-Ubuntu-10.5.4G.txt:Logging: ./mtr --mysqld=--innodb_flush_log_at_trx_commit=0 --mysqld=--innodb_buffer_pool_size=2400M --mysqld=--innodb_flush_method=fsync --suite=innodb pt_large
|
/Users/Valerii/Downloads/MDEV-30986-Ubuntu-10.5.4G.txt: "r_total_time_ms": 261837.0193,
|
/Users/Valerii/Downloads/MDEV-30986-Ubuntu-10.5.4G.txt: "r_total_time_ms": 212447.4348,
|
/Users/Valerii/Downloads/MDEV-30986-Ubuntu-10.5.4G.txt:innodb.pt_large 'innodb' [ pass ] 1558909
|
/Users/Valerii/Downloads/MDEV-30986-Ubuntu-10.6.4G.txt:openxs@ao756:~/dbs/maria10.6/mysql-test$ ./mtr --mysqld='--innodb_flush_log_at_trx_commit=0' --mysqld='--innodb_buffer_pool_size=128M' --mysqld='--innodb_flush_method=fsync' --suite=innodb pt_large
|
/Users/Valerii/Downloads/MDEV-30986-Ubuntu-10.6.4G.txt:Logging: ./mtr --mysqld=--innodb_flush_log_at_trx_commit=0 --mysqld=--innodb_buffer_pool_size=128M --mysqld=--innodb_flush_method=fsync --suite=innodb pt_large
|
/Users/Valerii/Downloads/MDEV-30986-Ubuntu-10.6.4G.txt: "r_total_time_ms": 155649.1582,
|
/Users/Valerii/Downloads/MDEV-30986-Ubuntu-10.6.4G.txt: "r_total_time_ms": 119395.6958,
|
/Users/Valerii/Downloads/MDEV-30986-Ubuntu-10.6.4G.txt:innodb.pt_large 'innodb' [ pass ] 1645276
|
/Users/Valerii/Downloads/MDEV-30986-Ubuntu-10.6.4G.txt:openxs@ao756:~/dbs/maria10.6/mysql-test$ ./mtr --mysqld='--innodb_flush_log_at_trx_commit=0' --mysqld='--innodb_buffer_pool_size=128M' --mysqld='--innodb_flush_method=O_DIRECT' --suite=innodb pt_large
|
/Users/Valerii/Downloads/MDEV-30986-Ubuntu-10.6.4G.txt:Logging: ./mtr --mysqld=--innodb_flush_log_at_trx_commit=0 --mysqld=--innodb_buffer_pool_size=128M --mysqld=--innodb_flush_method=O_DIRECT --suite=innodb pt_large
|
/Users/Valerii/Downloads/MDEV-30986-Ubuntu-10.6.4G.txt: "r_total_time_ms": 278127.1988,
|
/Users/Valerii/Downloads/MDEV-30986-Ubuntu-10.6.4G.txt: "r_total_time_ms": 274775.462,
|
/Users/Valerii/Downloads/MDEV-30986-Ubuntu-10.6.4G.txt:innodb.pt_large 'innodb' [ pass ] 1831269
|
/Users/Valerii/Downloads/MDEV-30986-Ubuntu-10.6.4G.txt:openxs@ao756:~/dbs/maria10.6/mysql-test$ ./mtr --mysqld='--innodb_flush_log_at_trx_commit=0' --mysqld='--innodb_buffer_pool_size=2400M' --mysqld='--innodb_flush_method=O_DIRECT' --suite=innodb pt_large
|
/Users/Valerii/Downloads/MDEV-30986-Ubuntu-10.6.4G.txt:Logging: ./mtr --mysqld=--innodb_flush_log_at_trx_commit=0 --mysqld=--innodb_buffer_pool_size=2400M --mysqld=--innodb_flush_method=O_DIRECT --suite=innodb pt_large
|
/Users/Valerii/Downloads/MDEV-30986-Ubuntu-10.6.4G.txt: "r_total_time_ms": 268574.8223,
|
/Users/Valerii/Downloads/MDEV-30986-Ubuntu-10.6.4G.txt: "r_total_time_ms": 189068.4046,
|
/Users/Valerii/Downloads/MDEV-30986-Ubuntu-10.6.4G.txt:innodb.pt_large 'innodb' [ pass ] 2029993
|
/Users/Valerii/Downloads/MDEV-30986-Ubuntu-10.6.4G.txt:openxs@ao756:~/dbs/maria10.6/mysql-test$ ./mtr --mysqld='--innodb_flush_log_at_trx_commit=0' --mysqld='--innodb_buffer_pool_size=2400M' --mysqld='--innodb_flush_method=fsync' --suite=innodb pt_large
|
/Users/Valerii/Downloads/MDEV-30986-Ubuntu-10.6.4G.txt:Logging: ./mtr --mysqld=--innodb_flush_log_at_trx_commit=0 --mysqld=--innodb_buffer_pool_size=2400M --mysqld=--innodb_flush_method=fsync --suite=innodb pt_large
|
/Users/Valerii/Downloads/MDEV-30986-Ubuntu-10.6.4G.txt: "r_total_time_ms": 274471.6481,
|
/Users/Valerii/Downloads/MDEV-30986-Ubuntu-10.6.4G.txt: "r_total_time_ms": 203103.4097,
|
/Users/Valerii/Downloads/MDEV-30986-Ubuntu-10.6.4G.txt:innodb.pt_large 'innodb' [ pass ] 1846673
|
/Users/Valerii/Downloads/MDEV-30986-Ubuntu-10.6.4G.txt:openxs@ao756:~/dbs/maria10.6/mysql-test$ ./mtr --mysqld='--innodb_flush_log_at_trx_commit=0' --mysqld='--innodb_buffer_pool_size=2800M' --mysqld='--innodb_flush_method=O_DIRECT' --suite=innodb pt_large
|
/Users/Valerii/Downloads/MDEV-30986-Ubuntu-10.6.4G.txt:Logging: ./mtr --mysqld=--innodb_flush_log_at_trx_commit=0 --mysqld=--innodb_buffer_pool_size=2800M --mysqld=--innodb_flush_method=O_DIRECT --suite=innodb pt_large
|
/Users/Valerii/Downloads/MDEV-30986-Ubuntu-10.6.4G.txt: "r_total_time_ms": 263262.2626,
|
/Users/Valerii/Downloads/MDEV-30986-Ubuntu-10.6.4G.txt: "r_total_time_ms": 172024.558,
|
/Users/Valerii/Downloads/MDEV-30986-Ubuntu-10.6.4G.txt:innodb.pt_large 'innodb' [ pass ] 1731526
|
Yuliyas-Air:mysql-test Valerii$
|
Make your own conclusions, but mine are that 10.5 is still faster in all cases and I found no way, even with the largest buffer pool possible on this hardware (and still smaller than the data size for the table, we are I/O bound) to match the timings of the very first test, 10.5 with a small 128M buffer pool and fsync:
/Users/Valerii/Downloads/MDEV-30986-Ubuntu-10.5.4G.txt:Logging: ./mtr --mysqld=--innodb_flush_log_at_trx_commit=0 --mysqld=--innodb_buffer_pool_size=128M --mysqld=--innodb_flush_method=fsync --suite=innodb pt_large
|
/Users/Valerii/Downloads/MDEV-30986-Ubuntu-10.5.4G.txt: "r_total_time_ms": 154980.2253,
|
/Users/Valerii/Downloads/MDEV-30986-Ubuntu-10.5.4G.txt: "r_total_time_ms": 113801.6701,
|
/Users/Valerii/Downloads/MDEV-30986-Ubuntu-10.5.4G.txt:innodb.pt_large 'innodb' [ pass ] 1315942
|
The closest is 10.6 with the same settings:
/Users/Valerii/Downloads/MDEV-30986-Ubuntu-10.6.4G.txt:Logging: ./mtr --mysqld=--innodb_flush_log_at_trx_commit=0 --mysqld=--innodb_buffer_pool_size=128M --mysqld=--innodb_flush_method=fsync --suite=innodb pt_large
|
/Users/Valerii/Downloads/MDEV-30986-Ubuntu-10.6.4G.txt: "r_total_time_ms": 155649.1582,
|
/Users/Valerii/Downloads/MDEV-30986-Ubuntu-10.6.4G.txt: "r_total_time_ms": 119395.6958,
|
/Users/Valerii/Downloads/MDEV-30986-Ubuntu-10.6.4G.txt:innodb.pt_large 'innodb' [ pass ] 1645276
|
Classical tuning with O_DIRECT and largest possible buffer pool based on free memory:
/Users/Valerii/Downloads/MDEV-30986-Ubuntu-10.6.4G.txt:Logging: ./mtr --mysqld=--innodb_flush_log_at_trx_commit=0 --mysqld=--innodb_buffer_pool_size=2800M --mysqld=--innodb_flush_method=O_DIRECT --suite=innodb pt_large
|
/Users/Valerii/Downloads/MDEV-30986-Ubuntu-10.6.4G.txt: "r_total_time_ms": 263262.2626,
|
/Users/Valerii/Downloads/MDEV-30986-Ubuntu-10.6.4G.txt: "r_total_time_ms": 172024.558,
|
/Users/Valerii/Downloads/MDEV-30986-Ubuntu-10.6.4G.txt:innodb.pt_large 'innodb' [ pass ] 1731526
|
is NOT better.
So, for a very slow disk and CPU:
openxs@ao756:~/dbs/maria10.6/mysql-test$ pt-summary
|
# Percona Toolkit System Summary Report ######################
|
Date | 2023-05-06 17:51:41 UTC (local TZ: EEST +0300)
|
Hostname | ao756
|
Uptime | 6 days, 10:01, 2 users, load average: 0,21, 0,18, 0,25
|
Platform | Linux
|
Release | Ubuntu 22.04.2 LTS (jammy)
|
Kernel | 5.19.0-38-generic
|
Architecture | CPU = 64-bit, OS = 64-bit
|
Threading | NPTL 2.35
|
SELinux | No SELinux detected
|
Virtualized | No virtualization detected
|
# Processor ##################################################
|
Processors | physical = 1, cores = 2, virtual = 2, hyperthreading = no
|
Speeds | 1x1179.109, 1x858.052
|
Models | 2xIntel(R) Pentium(R) CPU 987 @ 1.50GHz
|
Caches | 2x2048 KB
|
# Memory #####################################################
|
Total | 3,7G
|
Free | 3,0G
|
...
|
for this specific test case with full table scans etc, 10.5 is better with all combinations of settings tested. Moreover, both 10.5 and 10.6 gives the fastest results when we use innodb_flush_method = fsync and rely on the filesystem cache, by allocation small enough innodb_buffer_pool.
Most of the above matches real life experience that I am aware of and based this test on, so it's not only about this slow, old and barely useful netbook.
valerii, thank you for the extensive tests. It seems to me that we must improve the read-ahead to make the new 10.6 default innodb_flush_method=O_DIRECT work better (MDEV-29967).
When it comes to the small regression that you observed with innodb_flush_method=fsync, there have not been that many changes to the I/O layer between 10.5 and 10.6. Some buffer pool data structures were refactored. I do not immediately see how it could lead to consistently worse read performance. That difference may be too small to draw any good conclusions. If that difference can be reproduced in a more up-to-date environment, we can try to fix it as well. I would expect that it would be reproducible with an already-warmed-up file system cache and that the type of the storage does not matter.
| Assignee | Marko Mäkelä [ marko ] |
In MDEV-29967, I posted a patch that fixes the linear read-ahead that was broken in MDEV-15053. Furthermore, starting with MDEV-16678, the purge of committed transaction history follows the FIFO order instead of LIFO. However, this affects 10.5 and 10.6 alike.
| Link |
This issue blocks |
I think that we may have to implement logical read-ahead, like danblack suggested in MDEV-29967.
A more logical place to call it would be btr_pcur_move_to_next_page / btr_pcur_move_to_prev.
The advantages here are:
- At this point the direction of read ahead is obvious (by function name)
- there's a page_id on cursor->btr_cur->page_cur->block.page
- one of the cursor structures could keep track of the count of consecutive reads
- further to the above the fuzzy walking the tree and looking at access time heuristics can be dropped
disadvantages:
- Those applications doing ref calls on incremental elements in a table won't get a read ahead detected.
- No readahead in buffer pool loads (which would be a rather easy fix)
Is it known at list layer if a PK lookup is also required by the query? if so a secondary key look ahead could prefetch the PK clustered pages as well.
I think that buffer pool loads directly invoke asynchronous reads already; see MDEV-26547.
The rules when a PK lookup is needed are somewhat complex, not only due to index condition pushdown and rowid filters (MDEV-16188) but also due to the way how MVCC and lock checks work in secondary indexes (until MDEV-17598 could streamline that). I would start by implement read-ahead within a single index scan only. Perhaps this could augment the linear read-ahead instead of replacing it.
I was thinking that we can get the child (or leaf) page numbers directly from the parent page. Not many changes to the cursor data structure should be needed. I’d start with the leaf-page navigation functions that were refactored in MDEV-30400. For limiting the read-ahead to the key scan range, we should refer to the end_key that is passed to handler::read_range_first().
Side note: innodb_random_read_ahead=ON (it is disabled by default) can only be triggered when a page needs to be read into the buffer pool.
Come to think of it, I only see the following potential use cases where linear read-ahead could be helpful:
- Index scan (any index), for leaf pages. Non-leaf pages are very unlikely to be adjacent, or in ascending order, so the linear read-ahead should not be enabled for them.
- BLOB fetch. Because BLOB pages are stored as a singly-linked list with next-page pointers only stored in the previous page, we might initiate a blind fetch of N pages starting at the first BLOB page and hope that the pages were allocated in ascending order. The length of the BLOB is stored as part of the BLOB pointer; we can determine the number of pages from that, except for ROW_FORMAT=COMPRESSED. I don’t think that this would help much, but we might make an experiment.
- Undo log scan (purge of committed transaction history). This might be similar to BLOB pages. I would not try to optimize this, and instead just hope that the undo log pages for recently processed transactions will reside in the buffer pool.
I am thinking of the following:
- Remove the call buf_read_ahead_linear() or move it to applicable upper level (undo or BLOB page access).
- Add logical read-ahead of leaf pages to btr_cur_t::search_leaf() and btr_cur_t::pessimistic_search_leaf().
- Check if the end_key that is passed to handler::read_range_first() is available and how to best access it, to limit the read-ahead.
- Check if any read-ahead can be added to btr_cur_t::open_leaf() or some of its callers.
| Status | Open [ 1 ] | In Progress [ 3 ] |
| Status | In Progress [ 3 ] | In Testing [ 10301 ] |
I moved the linear read-ahead to places where I think it can help, and added a logical read-ahead to a few B-tree operations. For valerii’s the test case in the Description, I got the following results on fast NVMe storage:
| revision | total time | ANALYZE time |
|---|---|---|
| 10.6 (baseline) | 9273ms | 870448µs |
| bb-10.6-MDEV-30986 | 8237ms | 812332µs |
Of course, a single run of such a tiny test is insufficient for any conclusions, but these initial results look promising.
| Assignee | Marko Mäkelä [ marko ] | Axel Schwenke [ axel ] |
I tested also the script that I had posted on 2023-04-24 13:49, but I am not seeing a significant difference between the two branches. The initial ANALYZE is a little faster when logical read-ahead is present. I tested both with innodb_read_ahead_threshold=16 and the default value innodb_read_ahead_threshold=56. With the non-default value, each ANALYZE took about 130ms more (over 0.6 seconds instead of around 0.5 seconds).
| Link |
This issue blocks |
| Link |
This issue relates to |
The similar ticket MDEV-31227 looks like it would benefit from innodb_random_read_ahead=ON.
| Sprint | PERF - Sprint 2023.06 [ 721 ] |
| Attachment | sysbench.pdf [ 70709 ] |
| Attachment | tpcc1.pdf [ 70710 ] |
I tested two different workloads, both with a slighly too small buffer pool:
- OLTP readonly including long range scans (to trigger read.ahead) sysbench.pdf

- TPC-C tpcc1.pdf
I did not see any effect of MDEV-30986 on performance. For TPC-C which was run with the buffer pool not preloaded, it seems that the performacne peakt slightly earlier with MDEV-30986.
related my.cnf
innodb-buffer-pool-dump-at-shutdown = 0
|
innodb_buffer_pool_load_at_startup = 0
|
innodb_random_read_ahead = ON
|
innodb_read_ahead_threshold = 12
|
| Status | In Testing [ 10301 ] | Stalled [ 10000 ] |
| Assignee | Axel Schwenke [ axel ] | Marko Mäkelä [ marko ] |
| Status | Stalled [ 10000 ] | In Testing [ 10301 ] |
I think that the impact of read-ahead is best tested with a specific single-threaded, read-only micro-benchmark against preloaded data.
The server needs to be started with an empty buffer pool, ensuring that no pages will be loaded due to processing the file ib_buffer_pool or due to some internal processing, such as purging the history of committed transactions.
Furthermore, I think that we need to test 3 scenarios:
- innodb_flush_method=O_DIRECT (the default since
MDEV-24854in MariaDB Server 10.6) - innodb_flush_method=fsync with a warmed up file system cache (tar cf - /dev/null datadir)
- innodb_flush_method=fsync with an empty file system cache (sudo sysctl vm.drop_caches=3)
The workload script should be as follows:
- Initialize the database with the test data.
- SET GLOBAL innodb_fast_shutdown=0; SHUTDOWN;
- rm ib_buffer_pool
- Empty or warm up the file system cache, as noted above.
- Start up the server for the benchmark.
My implementation of logical read-ahead does not currently take into account any end-of-range condition. It is hard-wired to read ahead some number of leaf pages starting from the leaf page where the first key of a range resides. This could be improved, once a suitable test script exists.
| Assignee | Marko Mäkelä [ marko ] | Axel Schwenke [ axel ] |
The README.md file of the nocache tool explains how you might be able to limit the size of the Linux kernel’s file system cache while a process is running. That could be useful for finer-grained control of runs with innodb_flush_method=fsync.
I thought that MDEV-31558 would help understand what is going on here. I tested a version of that with MDEV-31577 patched on top, and the following test case based on pt_large_restart.test![]() :
:
source include/have_innodb.inc;
|
source include/have_partition.inc;
|
set unique_checks=0,foreign_key_checks=0,use_stat_tables=NEVER; |
create table tp (id int, c1 date, c2 int, c3 text, primary key(id, c1)) |
engine=innodb stats_persistent=0
|
partition by range (to_days(c1)) |
(partition p1 values less than (734874), |
partition p2 values less than (735240), |
partition prest values less than (1000000)); |
delimiter ||;
|
for i in 1..50000 do execute immediate concat('insert into tp (id, c1, c2, c3) values (', i,', "2023-01-02", 1, repeat("a", 2000))'); execute immediate concat('insert into tp (id, c1, c2, c3) values (', i,', "2023-01-01", 2, repeat("b", 2000))'); end for|| |
delimiter ;||
|
|
|
set global innodb_fast_shutdown=0,innodb_buffer_pool_dump_at_shutdown=0; |
--source include/restart_mysqld.inc
|
|
|
analyze format=json_ext select distinct(c1) from tp partition (prest) t1; |
analyze format=json_ext select distinct(c1) from tp partition (prest) t1; |
drop table tp; |
I invoked this as
./mtr --mysqld=--innodb-buffer-pool-dump-at-shutdown=0 name_of_test
|
./mtr --mysqld=--innodb-buffer-pool-size=400m --mysqld=--innodb-buffer-pool-dump-at-shutdown=0 name_of_test
|
The first run reported (among others) the following:
|
10.6 2855bc53bc2d6ae7002406451fa503e21076cd8c with the instrumentation, on RAM disk |
"r_engine_stats": {
|
"pages_accessed": 25002,
|
"pages_read_count": 7254,
|
"pages_read_time_ms": 56.856
|
},
|
…
|
"r_engine_stats": {
|
"pages_accessed": 25002,
|
"pages_read_count": 7255,
|
"pages_read_time_ms": 48.439
|
},
|
This suggests that with a larger buffer pool that can hold more pages (innodb_buffer_pool_size/innodb_page_size=400MiB/16KiB=25600, this could run much faster. Indeed, for the second invocation, the second statement ran quicker:
"r_engine_stats": {
|
"pages_accessed": 25002,
|
"pages_read_count": 24931,
|
"pages_read_time_ms": 224.127
|
},
|
…
|
"r_engine_stats": {
|
"pages_accessed": 25002
|
},
|
So far, everything should be obvious to anyone who understands how the buffer pool (a.k.a. page cache) is supposed to work. The bug report was about performance on real storage, not a RAM disk. So, let me try that next, on a fast Intel Optane 960 NVMe.
mkdir /var/tmp/var && rm -fr var && ln -s /var/tmp/var var
|
./mtr --mysqld=--innodb-buffer-pool-dump-at-shutdown=0 name_of_test
|
./mtr --mysqld=--innodb-buffer-pool-size=400m --mysqld=--innodb-buffer-pool-dump-at-shutdown=0 name_of_test
|
sudo sysctl vm.drop_caches=3
|
systemd-run --scope --property=MemoryLimit=250M -- ./mtr --mysqld=--innodb-flush-method=fsync --mysqld=--innodb-buffer-pool-dump-at-shutdown=0 name_of_test
|
sudo sysctl vm.drop_caches=3
|
systemd-run --scope --property=MemoryLimit=550M -- ./mtr --mysqld=--innodb-flush-method=fsync --mysqld=--innodb-buffer-pool-size=400m --mysqld=--innodb-buffer-pool-dump-at-shutdown=0 name_of_test
|
I repeated the same also with innodb_random_read_ahead=1, because I thought that it could help a lot.
The results:
| innodb_random_read_ahead | innodb_buffer_pool_size | innodb_flush_method | pages_read_time_ms (first) | pages_read_time_ms (second) |
|---|---|---|---|---|
| OFF | 128MiB | O_DIRECT | 180.352 | 175.063 |
| OFF | 400MiB | O_DIRECT | 631.446 | 0 |
| OFF | 128MiB | fsync | 154.128 | 135.868 |
| OFF | 400MiB | fsync | 566.081 | 0 |
| ON | 128MiB | O_DIRECT | 108.355 | 101.117 |
| ON | 400MiB | O_DIRECT | 146.348 | 0 |
| ON | 128MiB | fsync | 109.466 | 83.51 |
| ON | 400MiB | fsync | 669.384 | 0 |
It is notable that the file system cache was not cleared across the server restart, and some memory will remain allocated to the file system cache despite the MemoryLimit that I specified. If I reduced the limit by 50MiB, the test would be aborted due to running out of memory. Due to this, the test with innodb_flush_method=fsync will get some advantage both for the first statement (some file system cache is available right at startup) and the second statement (the first one may have loaded some data to the file system cache).
Based on the last 4 lines, it could make sense to enable innodb_random_read_ahead=1 by default, to make the MDEV-24854 default innodb_flush_method=O_DIRECT perform better for reads than the old default. With the sufficiently large buffer pool, all the data will be loaded into the buffer pool by the first statement and remain there. The minimum total wait time for this is 146ms (O_DIRECT, random read-ahead), and the maximum is 669ms (fsync, random read-ahead). When we are using the file system cache (innodb_flush_method=fsync), disabling the random read-ahead gives better performance (566ms). It still is 420ms or 287% slower than the best setting here (innodb_flush_method=O_DIRECT, innodb_random_read_ahead=1).
I am yet to test the incomplete logical read-ahead prototype in the same way.
Some more tests with the logical read-ahead (without random read-ahead, so that it would not cause pages to be loaded into the buffer pool):
git cherry-pick --no-commit e5397df89c470586db38d2a330b4feea9aa8c2db
|
(cd ..;cmake --build .)
|
./mtr --mysqld=--innodb-buffer-pool-dump-at-shutdown=0 name_of_test
|
./mtr --mysqld=--innodb-buffer-pool-dump-at-shutdown=0 --mysqld=--innodb-buffer-pool-size=400m name_of_test
|
| innodb_buffer_pool_size | innodb_flush_method | pages_read_time_ms (first) | pages_read_time_ms (second) |
|---|---|---|---|
| 128MiB | O_DIRECT | 162.471 | 168.527 |
| 400MiB | O_DIRECT | 713.865 | 0 |
| 128MiB | fsync | 164.796 | 135.193 |
| 400MiB | fsync | 513.185 | 0 |
Based on this, the logical read-ahead prototype needs more work (such as taking the end-of-range keys into account). It might not be applicable to this type of workload at all. It could make more sense for longer key range scans.
| Link | This issue is blocked by PERF-389 [ PERF-389 ] |
yang04a (NVMe), mariadb-10.6-691e964d235
| rnd_read_ahead | buffer_pool | flush_method | read_time_ms (1st) | read_time_ms (2nd) |
|---|---|---|---|---|
| OFF | 128MiB | O_DIRECT | 2042.623 | 2058.575 |
| OFF | 400MiB | O_DIRECT | 6346.01 | 0 |
| OFF | 128MiB | fsync | 410.653 | 206.413 |
| OFF | 400MiB | fsync | 1417.712 | 0 |
| ON | 128MiB | O_DIRECT | 1125.077 | 1127.313 |
| ON | 400MiB | O_DIRECT | 1468.832 | 0 |
| ON | 128MiB | fsync | 264.035 | 158.446 |
| ON | 400MiB | fsync | 467.315 | 0 |
cheetah02 (SSD, xfs), mariadb-10.6-691e964d235
| rnd_read_ahead | buffer_pool | flush_method | read_time_ms (1st) | read_time_ms (2nd) |
|---|---|---|---|---|
| OFF | 128MiB | O_DIRECT | 1419.152 | 1374.683 |
| OFF | 400MiB | O_DIRECT | 4941.599 | 0 |
| OFF | 128MiB | fsync | 599.385 | 484.242 |
| OFF | 400MiB | fsync | 1634.865 | 0 |
| ON | 128MiB | O_DIRECT | 801.793 | 804.875 |
| ON | 400MiB | O_DIRECT | 1212.276 | 0 |
| ON | 128MiB | fsync | 380.395 | 279.781 |
| ON | 400MiB | fsync | 449.527 | 0 |
cheetah02 (SSD, ext4), mariadb-10.6-691e964d235
| rnd_read_ahead | buffer_pool | flush_method | read_time_ms (1st) | read_time_ms (2nd) |
|---|---|---|---|---|
| OFF | 128MiB | O_DIRECT | 1629.16 | 1597.377 |
| OFF | 400MiB | O_DIRECT | 4697.148 | 0 |
| OFF | 128MiB | fsync | 598.456 | 566.758 |
| OFF | 400MiB | fsync | 1849.587 | 0 |
| ON | 128MiB | O_DIRECT | 956.506 | 920.356 |
| ON | 400MiB | O_DIRECT | 1388.181 | 0 |
| ON | 128MiB | fsync | 512.942 | 382.558 |
| ON | 400MiB | fsync | 519.445 | 0 |
cat >main/MDEV-30986.test <<EOT
|
source include/have_innodb.inc;
|
source include/have_partition.inc;
|
set unique_checks=0,foreign_key_checks=0,use_stat_tables=NEVER;
|
create table tp (id int, c1 date, c2 int, c3 text, primary key(id, c1))
|
engine=innodb stats_persistent=0
|
partition by range (to_days(c1))
|
(partition p1 values less than (734874),
|
partition p2 values less than (735240),
|
partition prest values less than (1000000));
|
delimiter ||;
|
for i in 1..50000 do execute immediate concat('insert into tp (id, c1, c2, c3) values (', i,', "2023-01-02", 1, repeat("a", 2000))'); execute immediate concat('insert into tp (id, c1, c2, c3) values (', i,', "2023-01-01", 2, repeat("b", 2000))'); end for||
|
delimiter ;||
|
|
|
set global innodb_fast_shutdown=0,innodb_buffer_pool_dump_at_shutdown=0;
|
source include/restart_mysqld.inc;
|
|
|
analyze format=json select distinct(c1) from tp partition (prest) t1;
|
analyze format=json select distinct(c1) from tp partition (prest) t1;
|
drop table tp;
|
EOT
|
|
|
./mtr --mysqld=--innodb-buffer-pool-dump-at-shutdown=0 MDEV-30986
|
./mtr --mysqld=--innodb-buffer-pool-size=400m --mysqld=--innodb-buffer-pool-dump-at-shutdown=0 MDEV-30986
|
sudo sysctl vm.drop_caches=3
|
sudo systemd-run --scope --property=MemoryLimit=250M -- ./mtr --mysqld=--innodb-flush-method=fsync --mysqld=--innodb-buffer-pool-dump-at-shutdown=0 MDEV-30986
|
sudo sysctl vm.drop_caches=3
|
sudo systemd-run --scope --property=MemoryLimit=600M -- ./mtr --mysqld=--innodb-flush-method=fsync --mysqld=--innodb-buffer-pool-size=400m --mysqld=--innodb-buffer-pool-dump-at-shutdown=0 MDEV-30986
|
sudo rm -rf var/*
|
|
|
./mtr --mysqld=--innodb_random_read_ahead=1 --mysqld=--innodb-buffer-pool-dump-at-shutdown=0 MDEV-30986
|
./mtr --mysqld=--innodb_random_read_ahead=1 --mysqld=--innodb-buffer-pool-size=400m --mysqld=--innodb-buffer-pool-dump-at-shutdown=0 MDEV-30986
|
sudo sysctl vm.drop_caches=3
|
sudo systemd-run --scope --property=MemoryLimit=250M -- ./mtr --mysqld=--innodb_random_read_ahead=1 --mysqld=--innodb-flush-method=fsync --mysqld=--innodb-buffer-pool-dump-at-shutdown=0 MDEV-30986
|
sudo sysctl vm.drop_caches=3
|
sudo systemd-run --scope --property=MemoryLimit=600M -- ./mtr --mysqld=--innodb_random_read_ahead=1 --mysqld=--innodb-flush-method=fsync --mysqld=--innodb-buffer-pool-size=400m --mysqld=--innodb-buffer-pool-dump-at-shutdown=0 MDEV-30986
|
sudo rm -rf var/*
|
| Assignee | Axel Schwenke [ axel ] | Marko Mäkelä [ marko ] |
| Status | In Testing [ 10301 ] | Stalled [ 10000 ] |
axel, based on both my and your testing it seems that we should enable innodb_random_read_ahead by default. Can you run some broader tests to validate that?
In my tests, the combination innodb_flush_method=O_DIRECT and innodb_random_read_ahead=ON was the fastest for the first read, faster than anything using an initially emptied system cache (innodb_flush_method=fsync). My tests were conducted on ext4fs and probably on a Linux kernel between 6.1 and 6.3. Currently I am running Linux 6.4.4.
Which Linux kernel version and file system were you using on the NVMe storage? I think that there have been some improvements to io_uring in the past years, such as these in Linux 5.18.
Which Linux kernel version and file system were you using on the NVMe storage?
The yang machines run CentOS7 and thus have a very old kernel:
Linux yang04a.colo.sproutsys.com 3.10.0-1127.19.1.el7.x86_64
The cheetahs have a newer kernel, but nowhere near to your system:
Linux cheetah02 4.15.0-204-generic #215-Ubuntu
| Attachment | tpcc1-1.pdf [ 71342 ] |
In TPC-C benchmarks (sysbench-tpcc) I see no big difference between the tested variants.
Attached: tpcc1-1.pdf![]()
axel icymi, there is now a Rocky9 image available for yangs (rockynode9-yang)
| Link | This issue relates to MDEV-11378 [ MDEV-11378 ] |
I reran my test from 2023-07-07 on plain 10.6 0be4781428a4044b13b085965820a995652bb0e9, adjusting the initial syntax ANALYZE FORMAT=JSON_EXT to the final ANALYZE FORMAT=JSON.
I used ext4fs and the following kernel:
Linux version 6.4.0-2-amd64 (debian-kernel@lists.debian.org) (gcc-13 (Debian 13.2.0-1) 13.2.0, GNU ld (GNU Binutils for Debian) 2.41) #1 SMP PREEMPT_DYNAMIC Debian 6.4.4-3 (2023-08-08)
|
On the SATA SSD and HDD, I additionally specified innodb_flush_log_at_trx_commit=0, because loading the data from a single SQL thread would otherwise be extremely slow. The PCIe NVMe can write 2300 GB/s. For the HDD test, to save test preparation time, I executed the server manually on pre-populated data.
| storage | innodb_random_read_ahead | innodb_buffer_pool_size | innodb_flush_method | pages_read_time_ms (first) | pages_read_time_ms (second) |
|---|---|---|---|---|---|
| NVMe | OFF | 128MiB | O_DIRECT | 186.436 | 185.931 |
| NVMe | OFF | 400MiB | O_DIRECT | 719.048 | 0 |
| NVMe | OFF | 128MiB | fsync | 167.938 | 148.418 |
| NVMe | OFF | 400MiB | fsync | 502.467 | 0 |
| NVMe | ON | 128MiB | O_DIRECT | 120.730 | 99.248 |
| NVMe | ON | 400MiB | O_DIRECT | 151.693 | 0 |
| NVMe | ON | 128MiB | fsync | 79.916 | 99.061 |
| NVMe | ON | 400MiB | fsync | 120.542 | 0 |
| SSD | OFF | 128MiB | O_DIRECT | 788.756 | 781.586 |
| SSD | OFF | 400MiB | O_DIRECT | 2861.626 | 0 |
| SSD | OFF | 128MiB | fsync | 411.904 | 402.752 |
| SSD | OFF | 400MiB | fsync | 1083.534 | 0 |
| SSD | ON | 128MiB | O_DIRECT | 442.905 | 435.355 |
| SSD | ON | 400MiB | O_DIRECT | 771.668 | 0 |
| SSD | ON | 128MiB | fsync | 311.659 | 193.298 |
| SSD | ON | 400MiB | fsync | 341.362 | 0 |
| HDD | OFF | 128MiB | O_DIRECT | 6174.986 | 6574.272 |
| HDD | OFF | 400MiB | O_DIRECT | 8883.721 | 0 |
| HDD | OFF | 128MiB | fsync | 4606.022 | 4381.428 |
| HDD | OFF | 400MiB | fsync | 6326.241 | 0 |
| HDD | ON | 128MiB | O_DIRECT | 4822.419 | 5111.131 |
| HDD | ON | 400MiB | O_DIRECT | 5953.413 | 0 |
| HDD | ON | 128MiB | fsync | 4050.735 | 4142.588 |
| HDD | ON | 400MiB | fsync | 4807.75 | 0 |
Legend:
| NVMe | INTEL SSDPED1D960GAY (Intel Optane 960 on PCIe, 1 TB) |
| SSD | Samsung SSD 850 EVO 500GB |
| HDD | WDC WD20EZRZ-00Z5HB0 (Western Digital Blue, 2 TB, 4096-byte sectors, 5400 rpm) |
This time, the Linux file system cache consistently provided the best performance. My test on 2023-07-07 was with a somewhat older Linux kernel and an older code base, with no code changes that should affect the outcome.
I believe that in addition to implementing a better logical read-ahead (which is the subject of this ticket), we must implement asynchronous reads (and possibly writes) that cover multiple pages in one request (MDEV-11378), to reach similar performance as the Linux file system cache.
| Labels | performance regression regression-10.6 | performance regression regression-10.6 triage |
julien.fritsch Do we have any conclusion about this case? There has been no progress in the last few weeks.
There has been no progress on this, because the last I heard is that the customer was asked to configure innodb_flush_method=fsync, to effectively revert MDEV-24854. If there is a test case where 10.6 is slower than 10.5 when using that setting, I would like to see it.
| Status | Stalled [ 10000 ] | Needs Feedback [ 10501 ] |
While checking for more evidence with users/customers potentially affected, I just re-run one of the tests I've created for this bug, pt_large_restart:
Yuliyas-Air:mysql-test Valerii$ cat suite/innodb/t/pt_large_restart.test
|
source include/have_innodb.inc;
|
source include/have_partition.inc;
|
set default_storage_engine=innodb;
|
delimiter ||;
|
set use_stat_tables=NEVER||
|
|
|
create table tp (id int, c1 date, c2 int, c3 text, primary key(id, c1)) partition by range (to_days(c1)) (partition p1 values less than (734874), partition p2 values less than (735240), partition prest values less than (1000000))||
|
|
|
select @now := now(6)||
|
|
|
for i in 1..50000 do execute immediate concat('insert into tp (id, c1, c2, c3) values (', i,', "2023-01-02", 1, repeat("a", 2000))'); execute immediate concat('insert into tp (id, c1, c2, c3) values (', i,', "2023-01-01", 2, repeat("b", 2000))'); end for||
|
|
|
select timestampdiff(microsecond, @now, now(6))||
|
|
|
--query_vertical show table status like 'tp';
|
|
|
delimiter ;||
|
|
|
# try to force restart with flushing pages to disk
|
set global innodb_fast_shutdown = 0;
|
|
|
--exec echo "wait" > $MYSQLTEST_VARDIR/tmp/mysqld.1.expect
|
--shutdown_server 300
|
--source include/wait_until_disconnected.inc
|
|
|
--enable_reconnect
|
--exec echo "restart" > $MYSQLTEST_VARDIR/tmp/mysqld.1.expect
|
--source include/wait_until_connected_again.inc
|
|
|
--query_vertical show engine innodb status;
|
|
|
#SELECT variable_name, variable_value
|
#FROM information_schema.global_status
|
#WHERE variable_name like 'INNODB_BUFFER_POOL_PAGES_%';
|
|
|
delimiter ||;
|
select @now := now(6)||
|
analyze format=json select distinct(c1) from tp partition (prest)
|
as t1||
|
select timestampdiff(microsecond, @now, now(6))||
|
|
|
select @now := now(6)||
|
analyze format=json select distinct(c1) from tp partition (prest)
|
as t1||
|
select timestampdiff(microsecond, @now, now(6))||
|
|
|
--query_vertical show engine innodb status;
|
|
|
select @now := now(6)||
|
drop table tp||
|
select timestampdiff(microsecond, @now, now(6))||
|
|
on (unsupported, I know) mcOS with SSD on recent enough 10.5 and 10.6. I've got the following results with innodb_flush_method = fsync on both:
Yuliyas-Air:mysql-test Valerii$ ./mtr --mysqld='--innodb_flush_log_at_trx_commit=0' --mysqld='--innodb_buffer_pool_size=128M' --mysqld='--innodb_flush_method=fsync' --suite=innodb pt_large_restart
|
Logging: ./mtr --mysqld=--innodb_flush_log_at_trx_commit=0 --mysqld=--innodb_buffer_pool_size=128M --mysqld=--innodb_flush_method=fsync --suite=innodb pt_large_restart
|
VS config:
|
vardir: /Users/Valerii/dbs/maria10.6/mysql-test/var
|
Checking leftover processes...
|
Removing old var directory...
|
Creating var directory '/Users/Valerii/dbs/maria10.6/mysql-test/var'...
|
Checking supported features...
|
MariaDB Version 10.6.16-MariaDB
|
- SSL connections supported
|
Collecting tests...
|
Installing system database...
|
|
|
==============================================================================
|
|
|
TEST RESULT TIME (ms) or COMMENT
|
--------------------------------------------------------------------------
|
|
|
worker[1] Using MTR_BUILD_THREAD 300, with reserved ports 16000..16019
|
set default_storage_engine=innodb;
|
set use_stat_tables=NEVER||
|
create table tp (id int, c1 date, c2 int, c3 text, primary key(id, c1)) partition by range (to_days(c1)) (partition p1 values less than (734874), partition p2 values less than (735240), partition prest values less than (1000000))||
|
select @now := now(6)||
|
@now := now(6)
|
2023-08-30 10:07:05.130335
|
for i in 1..50000 do execute immediate concat('insert into tp (id, c1, c2, c3) values (', i,', "2023-01-02", 1, repeat("a", 2000))'); execute immediate concat('insert into tp (id, c1, c2, c3) values (', i,', "2023-01-01", 2, repeat("b", 2000))'); end for||
|
select timestampdiff(microsecond, @now, now(6))||
|
timestampdiff(microsecond, @now, now(6))
|
18582582
|
show table status like 'tp';||
|
Name tp
|
Engine InnoDB
|
Version 10
|
Row_format Dynamic
|
Rows 86817
|
Avg_row_length 2847
|
Data_length 247234560
|
Max_data_length 0
|
Index_length 0
|
Data_free 5242880
|
Auto_increment NULL
|
Create_time 2023-08-30 10:07:05
|
Update_time 2023-08-30 10:07:23
|
Check_time NULL
|
Collation latin1_swedish_ci
|
Checksum NULL
|
Create_options partitioned
|
Comment
|
Max_index_length 0
|
Temporary N
|
set global innodb_fast_shutdown = 0;
|
show engine innodb status;;
|
Type InnoDB
|
Name
|
Status
|
=====================================
|
2023-08-30 10:07:27 0x700008fb5000 INNODB MONITOR OUTPUT
|
=====================================
|
Per second averages calculated from the last 0 seconds
|
-----------------
|
BACKGROUND THREAD
|
-----------------
|
srv_master_thread loops: 0 srv_active, 0 srv_shutdown, 1 srv_idle
|
srv_master_thread log flush and writes: 1
|
----------
|
SEMAPHORES
|
----------
|
------------
|
TRANSACTIONS
|
------------
|
Trx id counter 200033
|
Purge done for trx's n:o < 0 undo n:o < 0 state: running but idle
|
History list length 0
|
LIST OF TRANSACTIONS FOR EACH SESSION:
|
--------
|
FILE I/O
|
--------
|
Pending flushes (fsync) log: 0; buffer pool: 0
|
1370 OS file reads, 14 OS file writes, 3 OS fsyncs
|
0.00 reads/s, 3362 avg bytes/read, 0.00 writes/s, 0.00 fsyncs/s
|
-------------------------------------
|
INSERT BUFFER AND ADAPTIVE HASH INDEX
|
-------------------------------------
|
Ibuf: size 1, free list len 0, seg size 2, 0 merges
|
merged operations:
|
insert 0, delete mark 0, delete 0
|
discarded operations:
|
insert 0, delete mark 0, delete 0
|
0.00 hash searches/s, 0.00 non-hash searches/s
|
---
|
LOG
|
---
|
Log sequence number 464769912
|
Log flushed up to 464769912
|
Pages flushed up to 464769912
|
Last checkpoint at 464769900
|
0 pending log flushes, 0 pending chkp writes
|
4 log i/o's done, 4.00 log i/o's/second
|
----------------------
|
BUFFER POOL AND MEMORY
|
----------------------
|
Total large memory allocated 136314880
|
Dictionary memory allocated 851728
|
Buffer pool size 8030
|
Free buffers 6540
|
Database pages 1490
|
Old database pages 570
|
Modified db pages 0
|
Percent of dirty pages(LRU & free pages): 0.000
|
Max dirty pages percent: 90.000
|
Pending reads 3
|
Pending writes: LRU 0, flush list 0
|
Pages made young 0, not young 0
|
0.00 youngs/s, 0.00 non-youngs/s
|
Pages read 1359, created 131, written 0
|
1359000.00 reads/s, 131000.00 creates/s, 0.00 writes/s
|
Buffer pool hit rate 0 / 1000, young-making rate 0 / 1000 not 0 / 1000
|
Pages read ahead 0.00/s, evicted without access 0.00/s, Random read ahead 0.00/s
|
LRU len: 1490, unzip_LRU len: 0
|
I/O sum[0]:cur[0], unzip sum[0]:cur[0]
|
--------------
|
ROW OPERATIONS
|
--------------
|
0 read views open inside InnoDB
|
Process ID=0, Main thread ID=0, state: sleeping
|
Number of rows inserted 0, updated 0, deleted 0, read 0
|
0.00 inserts/s, 0.00 updates/s, 0.00 deletes/s, 0.00 reads/s
|
Number of system rows inserted 0, updated 0, deleted 0, read 0
|
0.00 inserts/s, 0.00 updates/s, 0.00 deletes/s, 0.00 reads/s
|
----------------------------
|
END OF INNODB MONITOR OUTPUT
|
============================
|
|
|
select @now := now(6)||
|
@now := now(6)
|
2023-08-30 10:07:27.311170
|
analyze format=json select distinct(c1) from tp partition (prest)
|
as t1||
|
ANALYZE
|
{
|
"query_block": {
|
"select_id": 1,
|
"r_loops": 1,
|
"r_total_time_ms": 466.623,
|
"temporary_table": {
|
"table": {
|
"table_name": "t1",
|
"partitions": ["prest"],
|
"access_type": "index",
|
"key": "PRIMARY",
|
"key_length": "7",
|
"used_key_parts": ["id", "c1"],
|
"r_loops": 1,
|
"rows": 39558,
|
"r_rows": 100000,
|
"r_table_time_ms": 438.096,
|
"r_other_time_ms": 28.501,
|
"r_engine_stats": {
|
"pages_accessed": 25002,
|
"pages_read_count": 23584,
|
"pages_read_time_ms": 278.379
|
},
|
"filtered": 100,
|
"r_filtered": 100,
|
"using_index": true
|
}
|
}
|
}
|
}
|
select timestampdiff(microsecond, @now, now(6))||
|
timestampdiff(microsecond, @now, now(6))
|
484037
|
select @now := now(6)||
|
@now := now(6)
|
2023-08-30 10:07:27.795496
|
analyze format=json select distinct(c1) from tp partition (prest)
|
as t1||
|
ANALYZE
|
{
|
"query_block": {
|
"select_id": 1,
|
"r_loops": 1,
|
"r_total_time_ms": 369.276,
|
"temporary_table": {
|
"table": {
|
"table_name": "t1",
|
"partitions": ["prest"],
|
"access_type": "index",
|
"key": "PRIMARY",
|
"key_length": "7",
|
"used_key_parts": ["id", "c1"],
|
"r_loops": 1,
|
"rows": 39558,
|
"r_rows": 100000,
|
"r_table_time_ms": 341.428,
|
"r_other_time_ms": 27.843,
|
"r_engine_stats": {
|
"pages_accessed": 25002,
|
"pages_read_count": 19989,
|
"pages_read_time_ms": 194.047
|
},
|
"filtered": 100,
|
"r_filtered": 100,
|
"using_index": true
|
}
|
}
|
}
|
}
|
select timestampdiff(microsecond, @now, now(6))||
|
timestampdiff(microsecond, @now, now(6))
|
369933
|
show engine innodb status;||
|
Type InnoDB
|
Name
|
Status
|
=====================================
|
2023-08-30 10:07:28 0x700008fb5000 INNODB MONITOR OUTPUT
|
=====================================
|
Per second averages calculated from the last 1 seconds
|
-----------------
|
BACKGROUND THREAD
|
-----------------
|
srv_master_thread loops: 0 srv_active, 0 srv_shutdown, 1 srv_idle
|
srv_master_thread log flush and writes: 1
|
----------
|
SEMAPHORES
|
----------
|
------------
|
TRANSACTIONS
|
------------
|
Trx id counter 200034
|
Purge done for trx's n:o < 0 undo n:o < 0 state: running but idle
|
History list length 0
|
LIST OF TRANSACTIONS FOR EACH SESSION:
|
---TRANSACTION (0x10eddebc0), not started
|
0 lock struct(s), heap size 1128, 0 row lock(s)
|
--------
|
FILE I/O
|
--------
|
Pending flushes (fsync) log: 0; buffer pool: 0
|
45834 OS file reads, 14 OS file writes, 3 OS fsyncs
|
44419.58 reads/s, 16057 avg bytes/read, 0.00 writes/s, 0.00 fsyncs/s
|
-------------------------------------
|
INSERT BUFFER AND ADAPTIVE HASH INDEX
|
-------------------------------------
|
Ibuf: size 1, free list len 0, seg size 2, 0 merges
|
merged operations:
|
insert 0, delete mark 0, delete 0
|
discarded operations:
|
insert 0, delete mark 0, delete 0
|
0.00 hash searches/s, 0.00 non-hash searches/s
|
---
|
LOG
|
---
|
Log sequence number 464769912
|
Log flushed up to 464769912
|
Pages flushed up to 464769912
|
Last checkpoint at 464769900
|
0 pending log flushes, 0 pending chkp writes
|
4 log i/o's done, 0.00 log i/o's/second
|
----------------------
|
BUFFER POOL AND MEMORY
|
----------------------
|
Total large memory allocated 136314880
|
Dictionary memory allocated 860056
|
Buffer pool size 8030
|
Free buffers 0
|
Database pages 8030
|
Old database pages 2983
|
Modified db pages 0
|
Percent of dirty pages(LRU & free pages): 0.000
|
Max dirty pages percent: 90.000
|
Pending reads 0
|
Pending writes: LRU 0, flush list 0
|
Pages made young 0, not young 54743
|
0.00 youngs/s, 54688.31 non-youngs/s
|
Pages read 45820, created 131, written 0
|
44416.58 reads/s, 0.00 creates/s, 0.00 writes/s
|
Buffer pool hit rate 111 / 1000, young-making rate 0 / 1000 not 1094 / 1000
|
Pages read ahead 94.91/s, evicted without access 650.35/s, Random read ahead 0.00/s
|
LRU len: 8030, unzip_LRU len: 0
|
I/O sum[0]:cur[43581], unzip sum[0]:cur[0]
|
--------------
|
ROW OPERATIONS
|
--------------
|
0 read views open inside InnoDB
|
Process ID=0, Main thread ID=0, state: sleeping
|
Number of rows inserted 0, updated 0, deleted 0, read 200000
|
0.00 inserts/s, 0.00 updates/s, 0.00 deletes/s, 199800.20 reads/s
|
Number of system rows inserted 0, updated 0, deleted 0, read 0
|
0.00 inserts/s, 0.00 updates/s, 0.00 deletes/s, 0.00 reads/s
|
----------------------------
|
END OF INNODB MONITOR OUTPUT
|
============================
|
|
|
select @now := now(6)||
|
@now := now(6)
|
2023-08-30 10:07:28.166151
|
drop table tp||
|
select timestampdiff(microsecond, @now, now(6))||
|
timestampdiff(microsecond, @now, now(6))
|
50530
|
innodb.pt_large_restart 'innodb' [ pass ] 23117
|
--------------------------------------------------------------------------
|
The servers were restarted 0 times
|
Spent 23.117 of 39 seconds executing testcases
|
|
|
Completed: All 1 tests were successful.
|
|
|
Yuliyas-Air:mysql-test Valerii$ cd ../../maria10.5/mysql-test/
|
Yuliyas-Air:mysql-test Valerii$ ./mtr --mysqld='--innodb_flush_log_at_trx_commit=0' --mysqld='--innodb_buffer_pool_size=128M' --mysqld='--innodb_flush_method=fsync' --suite=innodb pt_large_restart
|
Logging: ./mtr --mysqld=--innodb_flush_log_at_trx_commit=0 --mysqld=--innodb_buffer_pool_size=128M --mysqld=--innodb_flush_method=fsync --suite=innodb pt_large_restart
|
VS config:
|
vardir: /Users/Valerii/dbs/maria10.5/mysql-test/var
|
Checking leftover processes...
|
Removing old var directory...
|
Creating var directory '/Users/Valerii/dbs/maria10.5/mysql-test/var'...
|
Checking supported features...
|
MariaDB Version 10.5.23-MariaDB
|
- SSL connections supported
|
Collecting tests...
|
Installing system database...
|
|
|
==============================================================================
|
|
|
TEST RESULT TIME (ms) or COMMENT
|
--------------------------------------------------------------------------
|
|
|
worker[1] Using MTR_BUILD_THREAD 300, with reserved ports 16000..16019
|
set default_storage_engine=innodb;
|
set use_stat_tables=NEVER||
|
create table tp (id int, c1 date, c2 int, c3 text, primary key(id, c1)) partition by range (to_days(c1)) (partition p1 values less than (734874), partition p2 values less than (735240), partition prest values less than (1000000))||
|
select @now := now(6)||
|
@now := now(6)
|
2023-08-30 10:15:20.113234
|
for i in 1..50000 do execute immediate concat('insert into tp (id, c1, c2, c3) values (', i,', "2023-01-02", 1, repeat("a", 2000))'); execute immediate concat('insert into tp (id, c1, c2, c3) values (', i,', "2023-01-01", 2, repeat("b", 2000))'); end for||
|
select timestampdiff(microsecond, @now, now(6))||
|
timestampdiff(microsecond, @now, now(6))
|
25757048
|
show table status like 'tp';||
|
Name tp
|
Engine InnoDB
|
Version 10
|
Row_format Dynamic
|
Rows 111912
|
Avg_row_length 3991
|
Data_length 446660608
|
Max_data_length 0
|
Index_length 0
|
Data_free 5242880
|
Auto_increment NULL
|
Create_time 2023-08-30 10:15:20
|
Update_time 2023-08-30 10:15:45
|
Check_time NULL
|
Collation latin1_swedish_ci
|
Checksum NULL
|
Create_options partitioned
|
Comment
|
Max_index_length 0
|
Temporary N
|
set global innodb_fast_shutdown = 0;
|
show engine innodb status;;
|
Type InnoDB
|
Name
|
Status
|
=====================================
|
2023-08-30 10:15:47 0x70000dbaa000 INNODB MONITOR OUTPUT
|
=====================================
|
Per second averages calculated from the last 0 seconds
|
-----------------
|
BACKGROUND THREAD
|
-----------------
|
srv_master_thread loops: 0 srv_active, 0 srv_shutdown, 1 srv_idle
|
srv_master_thread log flush and writes: 1
|
----------
|
SEMAPHORES
|
----------
|
OS WAIT ARRAY INFO: reservation count 0
|
OS WAIT ARRAY INFO: signal count 0
|
RW-shared spins 0, rounds 0, OS waits 0
|
RW-excl spins 0, rounds 0, OS waits 0
|
RW-sx spins 0, rounds 0, OS waits 0
|
Spin rounds per wait: 0.00 RW-shared, 0.00 RW-excl, 0.00 RW-sx
|
------------
|
TRANSACTIONS
|
------------
|
Trx id counter 200034
|
Purge done for trx's n:o < 0 undo n:o < 0 state: running but idle
|
History list length 0
|
LIST OF TRANSACTIONS FOR EACH SESSION:
|
--------
|
FILE I/O
|
--------
|
Pending flushes (fsync) log: 0; buffer pool: 0
|
2043 OS file reads, 14 OS file writes, 3 OS fsyncs
|
0.00 reads/s, 3321 avg bytes/read, 0.00 writes/s, 0.00 fsyncs/s
|
-------------------------------------
|
INSERT BUFFER AND ADAPTIVE HASH INDEX
|
-------------------------------------
|
Ibuf: size 1, free list len 0, seg size 2, 0 merges
|
merged operations:
|
insert 0, delete mark 0, delete 0
|
discarded operations:
|
insert 0, delete mark 0, delete 0
|
0.00 hash searches/s, 42000.00 non-hash searches/s
|
---
|
LOG
|
---
|
Log sequence number 464009697
|
Log flushed up to 464009697
|
Pages flushed up to 464009697
|
Last checkpoint at 464009685
|
0 pending log flushes, 0 pending chkp writes
|
4 log i/o's done, 4.00 log i/o's/second
|
----------------------
|
BUFFER POOL AND MEMORY
|
----------------------
|
Total large memory allocated 136314880
|
Dictionary memory allocated 854472
|
Buffer pool size 8065
|
Free buffers 5903
|
Database pages 2162
|
Old database pages 818
|
Modified db pages 0
|
Percent of dirty pages(LRU & free pages): 0.000
|
Max dirty pages percent: 90.000
|
Pending reads 0
|
Pending writes: LRU 0, flush list 0
|
Pages made young 0, not young 0
|
0.00 youngs/s, 0.00 non-youngs/s
|
Pages read 2031, created 131, written 0
|
2031000.00 reads/s, 131000.00 creates/s, 0.00 writes/s
|
Buffer pool hit rate 0 / 1000, young-making rate 0 / 1000 not 0 / 1000
|
Pages read ahead 0.00/s, evicted without access 0.00/s, Random read ahead 0.00/s
|
LRU len: 2162, unzip_LRU len: 0
|
I/O sum[0]:cur[3], unzip sum[0]:cur[0]
|
--------------
|
ROW OPERATIONS
|
--------------
|
0 read views open inside InnoDB
|
Process ID=0, Main thread ID=0, state: sleeping
|
Number of rows inserted 0, updated 0, deleted 0, read 0
|
0.00 inserts/s, 0.00 updates/s, 0.00 deletes/s, 0.00 reads/s
|
Number of system rows inserted 0, updated 0, deleted 0, read 0
|
0.00 inserts/s, 0.00 updates/s, 0.00 deletes/s, 0.00 reads/s
|
----------------------------
|
END OF INNODB MONITOR OUTPUT
|
============================
|
|
|
select @now := now(6)||
|
@now := now(6)
|
2023-08-30 10:15:47.588935
|
analyze format=json select distinct(c1) from tp partition (prest)
|
as t1||
|
ANALYZE
|
{
|
"query_block": {
|
"select_id": 1,
|
"r_loops": 1,
|
"r_total_time_ms": 437.1784201,
|
"temporary_table": {
|
"table": {
|
"table_name": "t1",
|
"partitions": ["prest"],
|
"access_type": "index",
|
"key": "PRIMARY",
|
"key_length": "7",
|
"used_key_parts": ["id", "c1"],
|
"r_loops": 1,
|
"rows": 93759,
|
"r_rows": 100000,
|
"r_table_time_ms": 412.3089944,
|
"r_other_time_ms": 24.29974713,
|
"filtered": 100,
|
"r_filtered": 100,
|
"using_index": true
|
}
|
}
|
}
|
}
|
select timestampdiff(microsecond, @now, now(6))||
|
timestampdiff(microsecond, @now, now(6))
|
481717
|
select @now := now(6)||
|
@now := now(6)
|
2023-08-30 10:15:48.079117
|
analyze format=json select distinct(c1) from tp partition (prest)
|
as t1||
|
ANALYZE
|
{
|
"query_block": {
|
"select_id": 1,
|
"r_loops": 1,
|
"r_total_time_ms": 317.290521,
|
"temporary_table": {
|
"table": {
|
"table_name": "t1",
|
"partitions": ["prest"],
|
"access_type": "index",
|
"key": "PRIMARY",
|
"key_length": "7",
|
"used_key_parts": ["id", "c1"],
|
"r_loops": 1,
|
"rows": 93759,
|
"r_rows": 100000,
|
"r_table_time_ms": 293.7305725,
|
"r_other_time_ms": 23.55006024,
|
"filtered": 100,
|
"r_filtered": 100,
|
"using_index": true
|
}
|
}
|
}
|
}
|
select timestampdiff(microsecond, @now, now(6))||
|
timestampdiff(microsecond, @now, now(6))
|
317477
|
show engine innodb status;||
|
Type InnoDB
|
Name
|
Status
|
=====================================
|
2023-08-30 10:15:48 0x70000dbaa000 INNODB MONITOR OUTPUT
|
=====================================
|
Per second averages calculated from the last 1 seconds
|
-----------------
|
BACKGROUND THREAD
|
-----------------
|
srv_master_thread loops: 0 srv_active, 0 srv_shutdown, 2 srv_idle
|
srv_master_thread log flush and writes: 2
|
----------
|
SEMAPHORES
|
----------
|
OS WAIT ARRAY INFO: reservation count 0
|
OS WAIT ARRAY INFO: signal count 0
|
RW-shared spins 0, rounds 0, OS waits 0
|
RW-excl spins 0, rounds 0, OS waits 0
|
RW-sx spins 0, rounds 0, OS waits 0
|
Spin rounds per wait: 0.00 RW-shared, 0.00 RW-excl, 0.00 RW-sx
|
------------
|
TRANSACTIONS
|
------------
|
Trx id counter 200034
|
Purge done for trx's n:o < 0 undo n:o < 0 state: running but idle
|
History list length 0
|
LIST OF TRANSACTIONS FOR EACH SESSION:
|
---TRANSACTION 281479483957424, not started
|
0 lock struct(s), heap size 1128, 0 row lock(s)
|
--------
|
FILE I/O
|
--------
|
Pending flushes (fsync) log: 0; buffer pool: 0
|
46068 OS file reads, 14 OS file writes, 3 OS fsyncs
|
43981.02 reads/s, 16360 avg bytes/read, 0.00 writes/s, 0.00 fsyncs/s
|
-------------------------------------
|
INSERT BUFFER AND ADAPTIVE HASH INDEX
|
-------------------------------------
|
Ibuf: size 1, free list len 0, seg size 2, 0 merges
|
merged operations:
|
insert 0, delete mark 0, delete 0
|
discarded operations:
|
insert 0, delete mark 0, delete 0
|
0.00 hash searches/s, 5.99 non-hash searches/s
|
---
|
LOG
|
---
|
Log sequence number 464009697
|
Log flushed up to 464009697
|
Pages flushed up to 464009697
|
Last checkpoint at 464009685
|
0 pending log flushes, 0 pending chkp writes
|
4 log i/o's done, 0.00 log i/o's/second
|
----------------------
|
BUFFER POOL AND MEMORY
|
----------------------
|
Total large memory allocated 136314880
|
Dictionary memory allocated 856936
|
Buffer pool size 8065
|
Free buffers 0
|
Database pages 8065
|
Old database pages 2996
|
Modified db pages 0
|
Percent of dirty pages(LRU & free pages): 0.000
|
Max dirty pages percent: 90.000
|
Pending reads 0
|
Pending writes: LRU 0, flush list 0
|
Pages made young 0, not young 55074
|
0.00 youngs/s, 55018.98 non-youngs/s
|
Pages read 46056, created 131, written 0
|
43981.02 reads/s, 0.00 creates/s, 0.00 writes/s
|
Buffer pool hit rate 390 / 1000, young-making rate 0 / 1000 not 761 / 1000
|
Pages read ahead 61.94/s, evicted without access 608.39/s, Random read ahead 0.00/s
|
LRU len: 8065, unzip_LRU len: 0
|
I/O sum[0]:cur[43967], unzip sum[0]:cur[0]
|
--------------
|
ROW OPERATIONS
|
--------------
|
0 read views open inside InnoDB
|
Process ID=0, Main thread ID=0, state: sleeping
|
Number of rows inserted 0, updated 0, deleted 0, read 200000
|
0.00 inserts/s, 0.00 updates/s, 0.00 deletes/s, 199800.20 reads/s
|
Number of system rows inserted 0, updated 0, deleted 0, read 0
|
0.00 inserts/s, 0.00 updates/s, 0.00 deletes/s, 0.00 reads/s
|
----------------------------
|
END OF INNODB MONITOR OUTPUT
|
============================
|
|
|
select @now := now(6)||
|
@now := now(6)
|
2023-08-30 10:15:48.397502
|
drop table tp||
|
select timestampdiff(microsecond, @now, now(6))||
|
timestampdiff(microsecond, @now, now(6))
|
55132
|
innodb.pt_large_restart 'innodb' [ pass ] 28375
|
--------------------------------------------------------------------------
|
The servers were restarted 0 times
|
Spent 28.375 of 36 seconds executing testcases
|
|
|
Completed: All 1 tests were successful.
|
On 10.6:
|
|
"r_total_time_ms": 466.623,
|
"r_total_time_ms": 369.276,
|
|
|
innodb.pt_large_restart 'innodb' [ pass ] 23117
|
--------------------------------------------------------------------------
|
The servers were restarted 0 times
|
Spent 23.117 of 39 seconds executing testcases
|
On 10.5:
"r_total_time_ms": 437.1784201,
|
"r_total_time_ms": 317.290521,
|
|
|
innodb.pt_large_restart 'innodb' [ pass ] 28375
|
--------------------------------------------------------------------------
|
The servers were restarted 0 times
|
Spent 28.375 of 36 seconds executing testcases
|
So, both the first and the second execution of the query is faster on 10.5, like ~7% and ~16% faster. This seem to match the overall experience with 10.6 vs older versions even with innodb_flush_method = fsync, it's clearly slower for disk-bound read-only loads, not that much, but without any doubts.
valerii, thank you for the update. I can reproduce a similar performance regression when running pt_large_restart.test![]() on RAM disk (Linux /dev/shm).
on RAM disk (Linux /dev/shm).
| Status | Needs Feedback [ 10501 ] | Open [ 1 ] |
| Status | Open [ 1 ] | Confirmed [ 10101 ] |
| Status | Confirmed [ 10101 ] | In Progress [ 3 ] |
So far, I found some minor difference due to MDEV-26769 and MDEV-26828, which I reverted with the following:
diff --git a/storage/innobase/buf/buf0buf.cc b/storage/innobase/buf/buf0buf.cc
|
index 893c505ab97..9c719e4c695 100644
|
--- a/storage/innobase/buf/buf0buf.cc
|
+++ b/storage/innobase/buf/buf0buf.cc
|
@@ -275,7 +275,7 @@ the read requests for the whole area.
|
*/
|
|
#ifndef UNIV_INNOCHECKSUM
|
-# ifdef SUX_LOCK_GENERIC
|
+# if 1
|
void page_hash_latch::read_lock_wait()
|
{
|
/* First, try busy spinning for a while. */
|
diff --git a/storage/innobase/include/buf0buf.h b/storage/innobase/include/buf0buf.h
|
index 4c2f621fb25..a38396c4d00 100644
|
--- a/storage/innobase/include/buf0buf.h
|
+++ b/storage/innobase/include/buf0buf.h
|
@@ -1931,7 +1931,7 @@ inline buf_page_t *buf_pool_t::page_hash_table::get(const page_id_t id,
|
return nullptr;
|
}
|
|
-#ifdef SUX_LOCK_GENERIC
|
+#if 1
|
inline void page_hash_latch::lock_shared()
|
{
|
mysql_mutex_assert_not_owner(&buf_pool.mutex);
|
diff --git a/storage/innobase/include/buf0types.h b/storage/innobase/include/buf0types.h
|
index c69c07d66e1..1fe3b7ad720 100644
|
--- a/storage/innobase/include/buf0types.h
|
+++ b/storage/innobase/include/buf0types.h
|
@@ -178,7 +178,7 @@ enum rw_lock_type_t
|
|
#include "sux_lock.h"
|
|
-#ifdef SUX_LOCK_GENERIC
|
+#if 1
|
class page_hash_latch : private rw_lock
|
{
|
/** Wait for a shared lock */
|
diff --git a/storage/innobase/include/transactional_lock_guard.h b/storage/innobase/include/transactional_lock_guard.h
|
index 168a68977a7..2e2ff7b39c6 100644
|
--- a/storage/innobase/include/transactional_lock_guard.h
|
+++ b/storage/innobase/include/transactional_lock_guard.h
|
@@ -31,6 +31,8 @@ this program; if not, write to the Free Software Foundation, Inc.,
|
# define NO_ELISION
|
#endif
|
|
+#define NO_ELISION
|
+
|
#ifdef NO_ELISION
|
constexpr bool have_transactional_memory= false;
|
# ifdef UNIV_DEBUG |
With this, I see the following performance on RAM disk:
| revision | first r_total_time_ms | second r_total_time_ms | total time/ms |
|---|---|---|---|
| 10.6 c438284863db2ccba8a04437c941a5c8a2d9225b (patched) | 336.07 | 295.577 | 12514 |
| 10.6 c438284863db2ccba8a04437c941a5c8a2d9225b | 326.952 | 320.404 | 12504 |
| 10.5 aeb8eae5c8ba08fbc5b5d0ed3426a4fd7e4773fa | 389.3718709 | 325.9711336 | 10852 |
There is quite a bit of fluctuation in the numbers, so it is hard to conclude anything. One time, I also observed that 10.6 was slower than 10.5. In the above table, 10.6 is faster than 10.5, except for the total test execution time.
As you can see, the patch was both improving and reducing performance for me. On macOS, SUX_LOCK_GENERIC should be defined already, so the observed difference must be due to something else than the type of page_hash_lock. I wouldn’t expect the processor in a portable computer to support Intel TSX-NI either. The reason why I disabled that code (NO_ELISION) is that I saw a prominent xend instruction in a perf report.
To reduce the randomness I scaled up the pt_large_restart.test![]() as follows. This should also reduce the load time on 10.6 by enabling the
as follows. This should also reduce the load time on 10.6 by enabling the MDEV-515 bulk insert.
@@ -8,7 +8,10 @@
|
|
select @now := now(6)||
|
|
-for i in 1..50000 do execute immediate concat('insert into tp (id, c1, c2, c3) values (', i,', "2023-01-02", 1, repeat("a", 2000))'); execute immediate concat('insert into tp (id, c1, c2, c3) values (', i,', "2023-01-01", 2, repeat("b", 2000))'); end for||
|
+set unique_checks=0,foreign_key_checks=0||
|
+begin||
|
+for i in 1..500000 do execute immediate concat('insert into tp (id, c1, c2, c3) values (', i,', "2023-01-02", 1, repeat("a", 2000))'); execute immediate concat('insert into tp (id, c1, c2, c3) values (', i,', "2023-01-01", 2, repeat("b", 2000))'); end for||
|
+commit||
|
|
select timestampdiff(microsecond, @now, now(6))||
|
|
|
I applied a patch that I think should reduce the hold time of buf_pool.page_hash latches in buf_page_init_for_read() and buf_read_ahead_linear(). In the latter function, I do not think that using a memory transaction makes any sense. With that, I am seeing some promising results:
| revision | first r_total_time_ms | second r_total_time_ms | total time/ms |
|---|---|---|---|
| 10.6 c438284863db2ccba8a04437c941a5c8a2d9225b (patched) | 3091.414 | 3182.281 | 63024 |
| 10.5 aeb8eae5c8ba08fbc5b5d0ed3426a4fd7e4773fa | 3346.896934 | 3165.0589 | 72693 |
There is a significant speedup for the first-time access. The slowdown of the second-time access might be due to random factors. valerii, can you please test this?
| Attachment | mdev30986_105_106.txt [ 71750 ] |
I've attached the results from Ubuntu 22.04 (slow HDD and slow CPU) with current 10.5 vs 10.6, these commits:
openxs@ao756:~/git/server$ git log -1
|
commit 53499cd1ea1c8092460924224d78a286d617492d (HEAD -> 10.5, origin/10.5)
|
Author: Alexander Barkov <bar@mariadb.com>
|
Date: Tue Aug 29 11:51:01 2023 +0400
|
...
|
|
|
openxs@ao756:~/git/server$ git log -1
|
commit 9b1b4a6f69f81530b7fe9f1b4a7c517df68652e2 (HEAD -> 10.6, origin/10.6)
|
Author: Daniel Black <daniel@mariadb.org>
|
Date: Wed Aug 30 15:17:07 2023 +1000
|
...
|
I've also checked this patched one suggested by Marko:
openxs@ao756:~/git/server$ git checkout bb-10.6-MDEV-30986-simple
|
Branch 'bb-10.6-MDEV-30986-simple' set up to track remote branch 'bb-10.6-MDEV-30986-simple' from 'origin'.
|
Switched to a new branch 'bb-10.6-MDEV-30986-simple'
|
openxs@ao756:~/git/server$ git log -1
|
commit 31ea201eccebfc0b9a14cc6bc9a00b4271d739a2 (HEAD -> bb-10.6-MDEV-30986-simple, origin/bb-10.6-MDEV-30986-simple)
|
Author: Marko Mäkelä <marko.makela@mariadb.com>
|
Date: Wed Aug 30 13:20:27 2023 +0300
|
...
|
The latter gave this results:
openxs@ao756:~/dbs/maria10.6/mysql-test$ ./mtr --mysqld='--innodb_flush_log_at_trx_commit=0' --mysqld='--innodb_buffer_pool_size=128MM' --mysqld='--innodb_flush_method=fsync' --suite=innodb pt_large_restart
|
Logging: ./mtr --mysqld=--innodb_flush_log_at_trx_commit=0 --mysqld=--innodb_buffer_pool_size=128MM --mysqld=--innodb_flush_method=fsync --suite=innodb pt_large_restart
|
VS config:
|
vardir: /home/openxs/dbs/maria10.6/mysql-test/var
|
Checking leftover processes...
|
Removing old var directory...
|
Creating var directory '/home/openxs/dbs/maria10.6/mysql-test/var'...
|
Checking supported features...
|
MariaDB Version 10.6.16-MariaDB
|
- SSL connections supported
|
Collecting tests...
|
Installing system database...
|
|
|
==============================================================================
|
|
|
TEST RESULT TIME (ms) or COMMENT
|
--------------------------------------------------------------------------
|
|
|
worker[1] Using MTR_BUILD_THREAD 300, with reserved ports 16000..16019
|
set default_storage_engine=innodb;
|
set use_stat_tables=NEVER||
|
show variables like '%version%'||
|
Variable_name Value
|
in_predicate_conversion_threshold 1000
|
innodb_version 10.6.16
|
protocol_version 10
|
slave_type_conversions
|
system_versioning_alter_history ERROR
|
system_versioning_asof DEFAULT
|
tls_version TLSv1.1,TLSv1.2,TLSv1.3
|
version 10.6.16-MariaDB-log
|
version_comment Source distribution
|
version_compile_machine x86_64
|
version_compile_os Linux
|
version_malloc_library system
|
version_source_revision 31ea201eccebfc0b9a14cc6bc9a00b4271d739a2
|
version_ssl_library OpenSSL 1.1.1s-dev xx XXX xxxx
|
wsrep_patch_version wsrep_26.22
|
create table tp (id int, c1 date, c2 int, c3 text, primary key(id, c1)) partition by range (to_days(c1)) (partition p1 values less than (734874), partition p2 values less than (735240), partition prest values less than (1000000))||
|
select @now := now(6)||
|
@now := now(6)
|
2023-08-30 15:46:10.708918
|
for i in 1..50000 do execute immediate concat('insert into tp (id, c1, c2, c3) values (', i,', "2023-01-02", 1, repeat("a", 2000))'); execute immediate concat('insert into tp (id, c1, c2, c3) values (', i,', "2023-01-01", 2, repeat("b", 2000))'); end for||
|
select timestampdiff(microsecond, @now, now(6))||
|
timestampdiff(microsecond, @now, now(6))
|
136418372
|
show table status like 'tp';||
|
Name tp
|
Engine InnoDB
|
Version 10
|
Row_format Dynamic
|
Rows 97547
|
Avg_row_length 4718
|
Data_length 460292096
|
Max_data_length 0
|
Index_length 0
|
Data_free 5242880
|
Auto_increment NULL
|
Create_time 2023-08-30 15:46:10
|
Update_time 2023-08-30 15:48:27
|
Check_time NULL
|
Collation latin1_swedish_ci
|
Checksum NULL
|
Create_options partitioned
|
Comment
|
Max_index_length 0
|
Temporary N
|
set global innodb_fast_shutdown = 0;
|
show engine innodb status;;
|
Type InnoDB
|
Name
|
Status
|
=====================================
|
2023-08-30 15:48:29 0x7fd778a48640 INNODB MONITOR OUTPUT
|
=====================================
|
Per second averages calculated from the last 0 seconds
|
-----------------
|
BACKGROUND THREAD
|
-----------------
|
srv_master_thread loops: 0 srv_active, 0 srv_shutdown, 1 srv_idle
|
srv_master_thread log flush and writes: 1
|
----------
|
SEMAPHORES
|
----------
|
------------
|
TRANSACTIONS
|
------------
|
Trx id counter 200051
|
Purge done for trx's n:o < 0 undo n:o < 0 state: running but idle
|
History list length 0
|
LIST OF TRANSACTIONS FOR EACH SESSION:
|
--------
|
FILE I/O
|
--------
|
Pending flushes (fsync) log: 0; buffer pool: 0
|
1019 OS file reads, 2 OS file writes, 2 OS fsyncs
|
0.00 reads/s, 4568 avg bytes/read, 0.00 writes/s, 0.00 fsyncs/s
|
-------------------------------------
|
INSERT BUFFER AND ADAPTIVE HASH INDEX
|
-------------------------------------
|
Ibuf: size 1, free list len 0, seg size 2, 0 merges
|
merged operations:
|
insert 0, delete mark 0, delete 0
|
discarded operations:
|
insert 0, delete mark 0, delete 0
|
0.00 hash searches/s, 0.00 non-hash searches/s
|
---
|
LOG
|
---
|
Log sequence number 464806200
|
Log flushed up to 464806200
|
Pages flushed up to 464806200
|
Last checkpoint at 464806188
|
0 pending log flushes, 0 pending chkp writes
|
4 log i/o's done, 4.00 log i/o's/second
|
----------------------
|
BUFFER POOL AND MEMORY
|
----------------------
|
Total large memory allocated 136314880
|
Dictionary memory allocated 848424
|
Buffer pool size 8112
|
Free buffers 6975
|
Database pages 1137
|
Old database pages 439
|
Modified db pages 0
|
Percent of dirty pages(LRU & free pages): 0.000
|
Max dirty pages percent: 90.000
|
Pending reads 1
|
Pending writes: LRU 0, flush list 0
|
Pages made young 0, not young 0
|
0.00 youngs/s, 0.00 non-youngs/s
|
Pages read 1006, created 131, written 0
|
1006000.00 reads/s, 131000.00 creates/s, 0.00 writes/s
|
Buffer pool hit rate 0 / 1000, young-making rate 0 / 1000 not 0 / 1000
|
Pages read ahead 0.00/s, evicted without access 0.00/s, Random read ahead 0.00/s
|
LRU len: 1137, unzip_LRU len: 0
|
I/O sum[0]:cur[1], unzip sum[0]:cur[0]
|
--------------
|
ROW OPERATIONS
|
--------------
|
0 read views open inside InnoDB
|
Process ID=0, Main thread ID=0, state: sleeping
|
Number of rows inserted 0, updated 0, deleted 0, read 0
|
0.00 inserts/s, 0.00 updates/s, 0.00 deletes/s, 0.00 reads/s
|
Number of system rows inserted 0, updated 0, deleted 0, read 0
|
0.00 inserts/s, 0.00 updates/s, 0.00 deletes/s, 0.00 reads/s
|
----------------------------
|
END OF INNODB MONITOR OUTPUT
|
============================
|
|
|
select @now := now(6)||
|
@now := now(6)
|
2023-08-30 15:48:29.548905
|
analyze format=json select distinct(c1) from tp partition (prest)
|
as t1||
|
ANALYZE
|
{
|
"query_block": {
|
"select_id": 1,
|
"r_loops": 1,
|
"r_total_time_ms": 644.211,
|
"temporary_table": {
|
"table": {
|
"table_name": "t1",
|
"partitions": ["prest"],
|
"access_type": "index",
|
"key": "PRIMARY",
|
"key_length": "7",
|
"used_key_parts": ["id", "c1"],
|
"r_loops": 1,
|
"rows": 95659,
|
"r_rows": 100000,
|
"r_table_time_ms": 585.555,
|
"r_other_time_ms": 58.641,
|
"r_engine_stats": {
|
"pages_accessed": 25002,
|
"pages_read_count": 23682,
|
"pages_read_time_ms": 310.602
|
},
|
"filtered": 100,
|
"r_filtered": 100,
|
"using_index": true
|
}
|
}
|
}
|
}
|
select timestampdiff(microsecond, @now, now(6))||
|
timestampdiff(microsecond, @now, now(6))
|
655832
|
select @now := now(6)||
|
@now := now(6)
|
2023-08-30 15:48:30.205194
|
analyze format=json select distinct(c1) from tp partition (prest)
|
as t1||
|
ANALYZE
|
{
|
"query_block": {
|
"select_id": 1,
|
"r_loops": 1,
|
"r_total_time_ms": 522.23,
|
"temporary_table": {
|
"table": {
|
"table_name": "t1",
|
"partitions": ["prest"],
|
"access_type": "index",
|
"key": "PRIMARY",
|
"key_length": "7",
|
"used_key_parts": ["id", "c1"],
|
"r_loops": 1,
|
"rows": 95659,
|
"r_rows": 100000,
|
"r_table_time_ms": 465.697,
|
"r_other_time_ms": 56.521,
|
"r_engine_stats": {
|
"pages_accessed": 25002,
|
"pages_read_count": 19976,
|
"pages_read_time_ms": 231.565
|
},
|
"filtered": 100,
|
"r_filtered": 100,
|
"using_index": true
|
}
|
}
|
}
|
}
|
select timestampdiff(microsecond, @now, now(6))||
|
timestampdiff(microsecond, @now, now(6))
|
523105
|
show engine innodb status;||
|
Type InnoDB
|
Name
|
Status
|
=====================================
|
2023-08-30 15:48:30 0x7fd778a48640 INNODB MONITOR OUTPUT
|
=====================================
|
Per second averages calculated from the last 1 seconds
|
-----------------
|
BACKGROUND THREAD
|
-----------------
|
srv_master_thread loops: 0 srv_active, 0 srv_shutdown, 2 srv_idle
|
srv_master_thread log flush and writes: 2
|
----------
|
SEMAPHORES
|
----------
|
------------
|
TRANSACTIONS
|
------------
|
Trx id counter 200052
|
Purge done for trx's n:o < 0 undo n:o < 0 state: running but idle
|
History list length 0
|
LIST OF TRANSACTIONS FOR EACH SESSION:
|
---TRANSACTION (0x7fd7794e0b80), not started
|
0 lock struct(s), heap size 1128, 0 row lock(s)
|
--------
|
FILE I/O
|
--------
|
Pending flushes (fsync) log: 0; buffer pool: 0
|
45793 OS file reads, 68 OS file writes, 2 OS fsyncs
|
44729.27 reads/s, 15975 avg bytes/read, 65.93 writes/s, 0.00 fsyncs/s
|
-------------------------------------
|
INSERT BUFFER AND ADAPTIVE HASH INDEX
|
-------------------------------------
|
Ibuf: size 1, free list len 0, seg size 2, 0 merges
|
merged operations:
|
insert 0, delete mark 0, delete 0
|
discarded operations:
|
insert 0, delete mark 0, delete 0
|
0.00 hash searches/s, 0.00 non-hash searches/s
|
---
|
LOG
|
---
|
Log sequence number 464806200
|
Log flushed up to 464806200
|
Pages flushed up to 464806200
|
Last checkpoint at 464806188
|
0 pending log flushes, 0 pending chkp writes
|
4 log i/o's done, 0.00 log i/o's/second
|
----------------------
|
BUFFER POOL AND MEMORY
|
----------------------
|
Total large memory allocated 136314880
|
Dictionary memory allocated 855336
|
Buffer pool size 8112
|
Free buffers 0
|
Database pages 8112
|
Old database pages 3014
|
Modified db pages 0
|
Percent of dirty pages(LRU & free pages): 0.000
|
Max dirty pages percent: 90.000
|
Pending reads 0
|
Pending writes: LRU 0, flush list 0
|
Pages made young 0, not young 54614
|
0.00 youngs/s, 54559.44 non-youngs/s
|
Pages read 45779, created 131, written 66
|
44728.27 reads/s, 0.00 creates/s, 65.93 writes/s
|
Buffer pool hit rate 105 / 1000, young-making rate 0 / 1000 not 1091 / 1000
|
Pages read ahead 77.92/s, evicted without access 619.38/s, Random read ahead 0.00/s
|
LRU len: 8112, unzip_LRU len: 0
|
I/O sum[0]:cur[43728], unzip sum[0]:cur[0]
|
--------------
|
ROW OPERATIONS
|
--------------
|
0 read views open inside InnoDB
|
Process ID=0, Main thread ID=0, state: sleeping
|
Number of rows inserted 0, updated 0, deleted 0, read 200000
|
0.00 inserts/s, 0.00 updates/s, 0.00 deletes/s, 199800.20 reads/s
|
Number of system rows inserted 0, updated 0, deleted 0, read 0
|
0.00 inserts/s, 0.00 updates/s, 0.00 deletes/s, 0.00 reads/s
|
----------------------------
|
END OF INNODB MONITOR OUTPUT
|
============================
|
|
|
select @now := now(6)||
|
@now := now(6)
|
2023-08-30 15:48:30.729895
|
drop table tp||
|
select timestampdiff(microsecond, @now, now(6))||
|
timestampdiff(microsecond, @now, now(6))
|
150358
|
innodb.pt_large_restart 'innodb' [ pass ] 140253
|
--------------------------------------------------------------------------
|
The servers were restarted 0 times
|
Spent 140.253 of 168 seconds executing testcases
|
|
|
Completed: All 1 tests were successful.
|
So, we see 644.211 and 522.23 for the 1st and 2nd runs (another attempt ended up with 620.996 and 513.699), comparing to 566.973773 and 455.0813797 for 10.5 and 629.821 and 513.464 for 10.6.
For me on slow HDD and with the original scale of the test there is no clear improvement, result vary, but 10.5 is still faster.
Will test on macOS with faster SSD some day later.
valerii, I think that in your latest comment and in mdev30986_105_106.txt![]() you may be using a too small dataset, and the test would have to be run several times to filter out noise in the numbers:
you may be using a too small dataset, and the test would have to be run several times to filter out noise in the numbers:
| version | first r_total_time_ms | second r_total_time_ms |
|---|---|---|
| 10.5 53499cd1ea1c8092460924224d78a286d617492d | 566.973773 | 455.0813797 |
| 10.6 9b1b4a6f69f81530b7fe9f1b4a7c517df68652e2 | 629.821 | 513.464 |
| 10.6 31ea201eccebfc0b9a14cc6bc9a00b4271d739a2 | 644.211 | 522.23 |
Also I got rather much variance in the performance numbers when using only 50,000 records. With 500,000 records it was more stable. Correct me if I am wrong, but if /proc/sys/kernel/sched_rr_timeslice_ms is 100 by default, we could easily be looking at a variance of 100 milliseconds due to that. It could be better to ensure that the statement of interest takes several seconds to execute, instead of just a few scheduler time slices.
I think that it is valid to run this test on RAM disk, because the revised scenario involves reads from the operating system’s file system cache (using innodb_flush_method=fsync on both 10.5 and 10.6).
I have pushed the fix to 10.6. If you think that a regression remains between 10.5 and 10.6, please file a new ticket.
| issue.field.resolutiondate | 2023-08-31 11:26:44.0 | 2023-08-31 11:26:43.56 |
| Fix Version/s | 10.6.16 [ 29014 ] | |
| Fix Version/s | 10.10.7 [ 29018 ] | |
| Fix Version/s | 10.11.6 [ 29020 ] | |
| Fix Version/s | 11.0.4 [ 29021 ] | |
| Fix Version/s | 11.1.3 [ 29023 ] | |
| Fix Version/s | 11.2.2 [ 29035 ] | |
| Fix Version/s | 10.6 [ 24028 ] | |
| Resolution | Fixed [ 1 ] | |
| Status | In Progress [ 3 ] | Closed [ 6 ] |
Tested with 500K rows on macOS. With 10.5 I've got:
Yuliyas-Air:mysql-test Valerii$ ./mtr --mysqld='--innodb_flush_log_at_trx_commit=0' --mysqld='--innodb_buffer_pool_size=128M' --mysqld='--innodb_flush_method=fsync' --suite=innodb pt_large_restart_500K
|
Logging: ./mtr --mysqld=--innodb_flush_log_at_trx_commit=0 --mysqld=--innodb_buffer_pool_size=128M --mysqld=--innodb_flush_method=fsync --suite=innodb pt_large_restart_500K
|
VS config:
|
vardir: /Users/Valerii/dbs/maria10.5/mysql-test/var
|
Checking leftover processes...
|
Removing old var directory...
|
Creating var directory '/Users/Valerii/dbs/maria10.5/mysql-test/var'...
|
Checking supported features...
|
MariaDB Version 10.5.23-MariaDB
|
- SSL connections supported
|
Collecting tests...
|
Installing system database...
|
|
|
==============================================================================
|
|
|
TEST RESULT TIME (ms) or COMMENT
|
--------------------------------------------------------------------------
|
|
|
worker[1] Using MTR_BUILD_THREAD 300, with reserved ports 16000..16019
|
set default_storage_engine=innodb;
|
set use_stat_tables=NEVER||
|
show variables like '%version%'||
|
Variable_name Value
|
in_predicate_conversion_threshold 1000
|
innodb_version 10.5.23
|
protocol_version 10
|
slave_type_conversions
|
system_versioning_alter_history ERROR
|
system_versioning_asof DEFAULT
|
tls_version TLSv1.1,TLSv1.2,TLSv1.3
|
version 10.5.23-MariaDB-log
|
version_comment MariaDB Server
|
version_compile_machine x86_64
|
version_compile_os osx10.13
|
version_malloc_library system
|
version_source_revision 7c9837ce744d1ce4b45e250369607bb440338bcd
|
version_ssl_library OpenSSL 1.1.1q 5 Jul 2022
|
wsrep_patch_version wsrep_26.22
|
create table tp (id int, c1 date, c2 int, c3 text, primary key(id, c1)) partition by range (to_days(c1)) (partition p1 values less than (734874), partition p2 values less than (735240), partition prest values less than (1000000))||
|
select @now := now(6)||
|
@now := now(6)
|
2023-08-31 15:13:47.306880
|
for i in 1..500000 do execute immediate concat('insert into tp (id, c1, c2, c3) values (', i,', "2023-01-02", 1, repeat("a", 2000))'); execute immediate concat('insert into tp (id, c1, c2, c3) values (', i,', "2023-01-01", 2, repeat("b", 2000))'); end for||
|
select timestampdiff(microsecond, @now, now(6))||
|
timestampdiff(microsecond, @now, now(6))
|
249771581
|
show table status like 'tp';||
|
Name tp
|
Engine InnoDB
|
Version 10
|
Row_format Dynamic
|
Rows 1117631
|
Avg_row_length 3946
|
Data_length 4410343424
|
Max_data_length 0
|
Index_length 0
|
Data_free 6291456
|
Auto_increment NULL
|
Create_time 2023-08-31 15:13:47
|
Update_time 2023-08-31 15:17:57
|
Check_time NULL
|
Collation latin1_swedish_ci
|
Checksum NULL
|
Create_options partitioned
|
Comment
|
Max_index_length 0
|
Temporary N
|
set global innodb_fast_shutdown = 0;
|
show engine innodb status;;
|
Type InnoDB
|
Name
|
Status
|
=====================================
|
2023-08-31 15:17:58 0x700009d81000 INNODB MONITOR OUTPUT
|
=====================================
|
Per second averages calculated from the last 0 seconds
|
-----------------
|
BACKGROUND THREAD
|
-----------------
|
srv_master_thread loops: 0 srv_active, 0 srv_shutdown, 1 srv_idle
|
srv_master_thread log flush and writes: 1
|
----------
|
SEMAPHORES
|
----------
|
OS WAIT ARRAY INFO: reservation count 0
|
OS WAIT ARRAY INFO: signal count 0
|
RW-shared spins 0, rounds 0, OS waits 0
|
RW-excl spins 0, rounds 0, OS waits 0
|
RW-sx spins 0, rounds 0, OS waits 0
|
Spin rounds per wait: 0.00 RW-shared, 0.00 RW-excl, 0.00 RW-sx
|
------------
|
TRANSACTIONS
|
------------
|
Trx id counter 2000034
|
Purge done for trx's n:o < 0 undo n:o < 0 state: running but idle
|
History list length 0
|
LIST OF TRANSACTIONS FOR EACH SESSION:
|
--------
|
FILE I/O
|
--------
|
Pending flushes (fsync) log: 0; buffer pool: 0
|
2043 OS file reads, 14 OS file writes, 3 OS fsyncs
|
0.00 reads/s, 3321 avg bytes/read, 0.00 writes/s, 0.00 fsyncs/s
|
-------------------------------------
|
INSERT BUFFER AND ADAPTIVE HASH INDEX
|
-------------------------------------
|
Ibuf: size 1, free list len 0, seg size 2, 0 merges
|
merged operations:
|
insert 0, delete mark 0, delete 0
|
discarded operations:
|
insert 0, delete mark 0, delete 0
|
0.00 hash searches/s, 42000.00 non-hash searches/s
|
---
|
LOG
|
---
|
Log sequence number 4643130600
|
Log flushed up to 4643130600
|
Pages flushed up to 4643130600
|
Last checkpoint at 4643130588
|
0 pending log flushes, 0 pending chkp writes
|
4 log i/o's done, 4.00 log i/o's/second
|
----------------------
|
BUFFER POOL AND MEMORY
|
----------------------
|
Total large memory allocated 136314880
|
Dictionary memory allocated 854472
|
Buffer pool size 8065
|
Free buffers 5903
|
Database pages 2162
|
Old database pages 818
|
Modified db pages 0
|
Percent of dirty pages(LRU & free pages): 0.000
|
Max dirty pages percent: 90.000
|
Pending reads 0
|
Pending writes: LRU 0, flush list 0
|
Pages made young 0, not young 0
|
0.00 youngs/s, 0.00 non-youngs/s
|
Pages read 2031, created 131, written 0
|
2031000.00 reads/s, 131000.00 creates/s, 0.00 writes/s
|
Buffer pool hit rate 0 / 1000, young-making rate 0 / 1000 not 0 / 1000
|
Pages read ahead 0.00/s, evicted without access 0.00/s, Random read ahead 0.00/s
|
LRU len: 2162, unzip_LRU len: 0
|
I/O sum[0]:cur[3], unzip sum[0]:cur[0]
|
--------------
|
ROW OPERATIONS
|
--------------
|
0 read views open inside InnoDB
|
Process ID=0, Main thread ID=0, state: sleeping
|
Number of rows inserted 0, updated 0, deleted 0, read 0
|
0.00 inserts/s, 0.00 updates/s, 0.00 deletes/s, 0.00 reads/s
|
Number of system rows inserted 0, updated 0, deleted 0, read 0
|
0.00 inserts/s, 0.00 updates/s, 0.00 deletes/s, 0.00 reads/s
|
----------------------------
|
END OF INNODB MONITOR OUTPUT
|
============================
|
|
|
select @now := now(6)||
|
@now := now(6)
|
2023-08-31 15:17:58.782245
|
analyze format=json select distinct(c1) from tp partition (prest)
|
as t1||
|
ANALYZE
|
{
|
"query_block": {
|
"select_id": 1,
|
"r_loops": 1,
|
"r_total_time_ms": 33146.42892,
|
"temporary_table": {
|
"table": {
|
"table_name": "t1",
|
"partitions": ["prest"],
|
"access_type": "index",
|
"key": "PRIMARY",
|
"key_length": "7",
|
"used_key_parts": ["id", "c1"],
|
"r_loops": 1,
|
"rows": 1187509,
|
"r_rows": 1000000,
|
"r_table_time_ms": 32851.34395,
|
"r_other_time_ms": 295.0497077,
|
"filtered": 100,
|
"r_filtered": 100,
|
"using_index": true
|
}
|
}
|
}
|
}
|
select timestampdiff(microsecond, @now, now(6))||
|
timestampdiff(microsecond, @now, now(6))
|
33148427
|
select @now := now(6)||
|
@now := now(6)
|
2023-08-31 15:18:31.931425
|
analyze format=json select distinct(c1) from tp partition (prest)
|
as t1||
|
ANALYZE
|
{
|
"query_block": {
|
"select_id": 1,
|
"r_loops": 1,
|
"r_total_time_ms": 32211.51862,
|
"temporary_table": {
|
"table": {
|
"table_name": "t1",
|
"partitions": ["prest"],
|
"access_type": "index",
|
"key": "PRIMARY",
|
"key_length": "7",
|
"used_key_parts": ["id", "c1"],
|
"r_loops": 1,
|
"rows": 1187509,
|
"r_rows": 1000000,
|
"r_table_time_ms": 31919.87755,
|
"r_other_time_ms": 291.6285777,
|
"filtered": 100,
|
"r_filtered": 100,
|
"using_index": true
|
}
|
}
|
}
|
}
|
select timestampdiff(microsecond, @now, now(6))||
|
timestampdiff(microsecond, @now, now(6))
|
32176012
|
show engine innodb status;||
|
Type InnoDB
|
Name
|
Status
|
=====================================
|
2023-08-31 15:19:04 0x700009d81000 INNODB MONITOR OUTPUT
|
=====================================
|
Per second averages calculated from the last 6 seconds
|
-----------------
|
BACKGROUND THREAD
|
-----------------
|
srv_master_thread loops: 0 srv_active, 0 srv_shutdown, 66 srv_idle
|
srv_master_thread log flush and writes: 66
|
----------
|
SEMAPHORES
|
----------
|
OS WAIT ARRAY INFO: reservation count 1
|
OS WAIT ARRAY INFO: signal count 1
|
RW-shared spins 1, rounds 30, OS waits 1
|
RW-excl spins 0, rounds 0, OS waits 0
|
RW-sx spins 0, rounds 0, OS waits 0
|
Spin rounds per wait: 30.00 RW-shared, 0.00 RW-excl, 0.00 RW-sx
|
------------
|
TRANSACTIONS
|
------------
|
Trx id counter 2000034
|
Purge done for trx's n:o < 0 undo n:o < 0 state: running but idle
|
History list length 0
|
LIST OF TRANSACTIONS FOR EACH SESSION:
|
---TRANSACTION 281479630647472, not started
|
0 lock struct(s), heap size 1128, 0 row lock(s)
|
--------
|
FILE I/O
|
--------
|
Pending flushes (fsync) log: 0; buffer pool: 0
|
496083 OS file reads, 14 OS file writes, 3 OS fsyncs
|
12373.94 reads/s, 16379 avg bytes/read, 0.00 writes/s, 0.00 fsyncs/s
|
-------------------------------------
|
INSERT BUFFER AND ADAPTIVE HASH INDEX
|
-------------------------------------
|
Ibuf: size 1, free list len 0, seg size 2, 0 merges
|
merged operations:
|
insert 0, delete mark 0, delete 0
|
discarded operations:
|
insert 0, delete mark 0, delete 0
|
0.00 hash searches/s, 0.00 non-hash searches/s
|
---
|
LOG
|
---
|
Log sequence number 4643130600
|
Log flushed up to 4643130600
|
Pages flushed up to 4643130600
|
Last checkpoint at 4643130588
|
0 pending log flushes, 0 pending chkp writes
|
4 log i/o's done, 0.00 log i/o's/second
|
----------------------
|
BUFFER POOL AND MEMORY
|
----------------------
|
Total large memory allocated 136314880
|
Dictionary memory allocated 856936
|
Buffer pool size 8065
|
Free buffers 0
|
Database pages 8065
|
Old database pages 2996
|
Modified db pages 0
|
Percent of dirty pages(LRU & free pages): 0.000
|
Max dirty pages percent: 90.000
|
Pending reads 0
|
Pending writes: LRU 0, flush list 0
|
Pages made young 1, not young 705067
|
0.00 youngs/s, 17870.02 non-youngs/s
|
Pages read 496071, created 131, written 0
|
12374.10 reads/s, 0.00 creates/s, 0.00 writes/s
|
Buffer pool hit rate 317 / 1000, young-making rate 0 / 1000 not 984 / 1000
|
Pages read ahead 3.17/s, evicted without access 3.00/s, Random read ahead 0.00/s
|
LRU len: 8065, unzip_LRU len: 0
|
I/O sum[419786]:cur[74239], unzip sum[0]:cur[0]
|
--------------
|
ROW OPERATIONS
|
--------------
|
0 read views open inside InnoDB
|
Process ID=0, Main thread ID=0, state: sleeping
|
Number of rows inserted 0, updated 0, deleted 0, read 2000000
|
0.00 inserts/s, 0.00 updates/s, 0.00 deletes/s, 50242.63 reads/s
|
Number of system rows inserted 0, updated 0, deleted 0, read 0
|
0.00 inserts/s, 0.00 updates/s, 0.00 deletes/s, 0.00 reads/s
|
----------------------------
|
END OF INNODB MONITOR OUTPUT
|
============================
|
|
|
select @now := now(6)||
|
@now := now(6)
|
2023-08-31 15:19:04.108493
|
drop table tp||
|
select timestampdiff(microsecond, @now, now(6))||
|
timestampdiff(microsecond, @now, now(6))
|
150503
|
innodb.pt_large_restart_500K 'innodb' [ pass ] 316989
|
--------------------------------------------------------------------------
|
The servers were restarted 0 times
|
Spent 316.989 of 323 seconds executing testcases
|
|
|
Completed: All 1 tests were successful.
|
while with patched 10.6:
Yuliyas-Air:mysql-test Valerii$ cd ../../maria10.6/mysql-test/
|
Yuliyas-Air:mysql-test Valerii$ cp ../../maria10.5/mysql-test/suite/innodb/t/pt_large_restart_500K.test suite/innodb/t
|
Yuliyas-Air:mysql-test Valerii$ ./mtr --mysqld='--innodb_flush_log_at_trx_commit=0' --mysqld='--innodb_buffer_pool_size=128M' --mysqld='--innodb_flush_method=fsync' --suite=innodb pt_large_restart_500K
|
Logging: ./mtr --mysqld=--innodb_flush_log_at_trx_commit=0 --mysqld=--innodb_buffer_pool_size=128M --mysqld=--innodb_flush_method=fsync --suite=innodb pt_large_restart_500K
|
VS config:
|
vardir: /Users/Valerii/dbs/maria10.6/mysql-test/var
|
Checking leftover processes...
|
Removing old var directory...
|
Creating var directory '/Users/Valerii/dbs/maria10.6/mysql-test/var'...
|
Checking supported features...
|
MariaDB Version 10.6.16-MariaDB
|
- SSL connections supported
|
Collecting tests...
|
Installing system database...
|
|
|
==============================================================================
|
|
|
TEST RESULT TIME (ms) or COMMENT
|
--------------------------------------------------------------------------
|
|
|
worker[1] Using MTR_BUILD_THREAD 300, with reserved ports 16000..16019
|
set default_storage_engine=innodb;
|
set use_stat_tables=NEVER||
|
show variables like '%version%'||
|
Variable_name Value
|
in_predicate_conversion_threshold 1000
|
innodb_version 10.6.16
|
protocol_version 10
|
slave_type_conversions
|
system_versioning_alter_history ERROR
|
system_versioning_asof DEFAULT
|
tls_version TLSv1.1,TLSv1.2,TLSv1.3
|
version 10.6.16-MariaDB-log
|
version_comment MariaDB Server
|
version_compile_machine x86_64
|
version_compile_os osx10.13
|
version_malloc_library system
|
version_source_revision 31ea201eccebfc0b9a14cc6bc9a00b4271d739a2
|
version_ssl_library OpenSSL 1.1.1q 5 Jul 2022
|
wsrep_patch_version wsrep_26.22
|
create table tp (id int, c1 date, c2 int, c3 text, primary key(id, c1)) partition by range (to_days(c1)) (partition p1 values less than (734874), partition p2 values less than (735240), partition prest values less than (1000000))||
|
select @now := now(6)||
|
@now := now(6)
|
2023-08-31 15:25:34.537651
|
for i in 1..500000 do execute immediate concat('insert into tp (id, c1, c2, c3) values (', i,', "2023-01-02", 1, repeat("a", 2000))'); execute immediate concat('insert into tp (id, c1, c2, c3) values (', i,', "2023-01-01", 2, repeat("b", 2000))'); end for||
|
select timestampdiff(microsecond, @now, now(6))||
|
timestampdiff(microsecond, @now, now(6))
|
211529710
|
show table status like 'tp';||
|
Name tp
|
Engine InnoDB
|
Version 10
|
Row_format Dynamic
|
Rows 1000000
|
Avg_row_length 4485
|
Data_length 4485840896
|
Max_data_length 0
|
Index_length 0
|
Data_free 6291456
|
Auto_increment NULL
|
Create_time 2023-08-31 15:25:34
|
Update_time 2023-08-31 15:29:06
|
Check_time NULL
|
Collation latin1_swedish_ci
|
Checksum NULL
|
Create_options partitioned
|
Comment
|
Max_index_length 0
|
Temporary N
|
set global innodb_fast_shutdown = 0;
|
show engine innodb status;;
|
Type InnoDB
|
Name
|
Status
|
=====================================
|
2023-08-31 15:30:29 0x700007a94000 INNODB MONITOR OUTPUT
|
=====================================
|
Per second averages calculated from the last 0 seconds
|
-----------------
|
BACKGROUND THREAD
|
-----------------
|
srv_master_thread loops: 0 srv_active, 0 srv_shutdown, 1 srv_idle
|
srv_master_thread log flush and writes: 1
|
----------
|
SEMAPHORES
|
----------
|
------------
|
TRANSACTIONS
|
------------
|
Trx id counter 2000059
|
Purge done for trx's n:o < 0 undo n:o < 0 state: running but idle
|
History list length 0
|
LIST OF TRANSACTIONS FOR EACH SESSION:
|
--------
|
FILE I/O
|
--------
|
Pending flushes (fsync) log: 0; buffer pool: 0
|
1582 OS file reads, 14 OS file writes, 3 OS fsyncs
|
0.00 reads/s, 2922 avg bytes/read, 0.00 writes/s, 0.00 fsyncs/s
|
-------------------------------------
|
INSERT BUFFER AND ADAPTIVE HASH INDEX
|
-------------------------------------
|
Ibuf: size 1, free list len 0, seg size 2, 0 merges
|
merged operations:
|
insert 0, delete mark 0, delete 0
|
discarded operations:
|
insert 0, delete mark 0, delete 0
|
0.00 hash searches/s, 0.00 non-hash searches/s
|
---
|
LOG
|
---
|
Log sequence number 4650717296
|
Log flushed up to 4650717296
|
Pages flushed up to 4650717296
|
Last checkpoint at 4650717284
|
0 pending log flushes, 0 pending chkp writes
|
4 log i/o's done, 4.00 log i/o's/second
|
----------------------
|
BUFFER POOL AND MEMORY
|
----------------------
|
Total large memory allocated 136314880
|
Dictionary memory allocated 851728
|
Buffer pool size 8030
|
Free buffers 6329
|
Database pages 1701
|
Old database pages 647
|
Modified db pages 0
|
Percent of dirty pages(LRU & free pages): 0.000
|
Max dirty pages percent: 90.000
|
Pending reads 3
|
Pending writes: LRU 0, flush list 0
|
Pages made young 0, not young 0
|
0.00 youngs/s, 0.00 non-youngs/s
|
Pages read 1570, created 131, written 0
|
1570000.00 reads/s, 131000.00 creates/s, 0.00 writes/s
|
Buffer pool hit rate 0 / 1000, young-making rate 0 / 1000 not 0 / 1000
|
Pages read ahead 0.00/s, evicted without access 0.00/s, Random read ahead 0.00/s
|
LRU len: 1701, unzip_LRU len: 0
|
I/O sum[0]:cur[1], unzip sum[0]:cur[0]
|
--------------
|
ROW OPERATIONS
|
--------------
|
0 read views open inside InnoDB
|
Process ID=0, Main thread ID=0, state: sleeping
|
Number of rows inserted 0, updated 0, deleted 0, read 0
|
0.00 inserts/s, 0.00 updates/s, 0.00 deletes/s, 0.00 reads/s
|
Number of system rows inserted 0, updated 0, deleted 0, read 0
|
0.00 inserts/s, 0.00 updates/s, 0.00 deletes/s, 0.00 reads/s
|
----------------------------
|
END OF INNODB MONITOR OUTPUT
|
============================
|
|
|
select @now := now(6)||
|
@now := now(6)
|
2023-08-31 15:30:29.898177
|
analyze format=json select distinct(c1) from tp partition (prest)
|
as t1||
|
ANALYZE
|
{
|
"query_block": {
|
"select_id": 1,
|
"r_loops": 1,
|
"r_total_time_ms": 31569.316,
|
"temporary_table": {
|
"table": {
|
"table_name": "t1",
|
"partitions": ["prest"],
|
"access_type": "index",
|
"key": "PRIMARY",
|
"key_length": "7",
|
"used_key_parts": ["id", "c1"],
|
"r_loops": 1,
|
"rows": 957048,
|
"r_rows": 1000000,
|
"r_table_time_ms": 31148.584,
|
"r_other_time_ms": 420.362,
|
"r_engine_stats": {
|
"pages_accessed": 250002,
|
"pages_read_count": 248677,
|
"pages_read_time_ms": 28612.601
|
},
|
"filtered": 100,
|
"r_filtered": 100,
|
"using_index": true
|
}
|
}
|
}
|
}
|
select timestampdiff(microsecond, @now, now(6))||
|
timestampdiff(microsecond, @now, now(6))
|
31605494
|
select @now := now(6)||
|
@now := now(6)
|
2023-08-31 15:31:01.504035
|
analyze format=json select distinct(c1) from tp partition (prest)
|
as t1||
|
ANALYZE
|
{
|
"query_block": {
|
"select_id": 1,
|
"r_loops": 1,
|
"r_total_time_ms": 28733.706,
|
"temporary_table": {
|
"table": {
|
"table_name": "t1",
|
"partitions": ["prest"],
|
"access_type": "index",
|
"key": "PRIMARY",
|
"key_length": "7",
|
"used_key_parts": ["id", "c1"],
|
"r_loops": 1,
|
"rows": 957048,
|
"r_rows": 1000000,
|
"r_table_time_ms": 28310.802,
|
"r_other_time_ms": 422.896,
|
"r_engine_stats": {
|
"pages_accessed": 250002,
|
"pages_read_count": 245027,
|
"pages_read_time_ms": 25766.988
|
},
|
"filtered": 100,
|
"r_filtered": 100,
|
"using_index": true
|
}
|
}
|
}
|
}
|
select timestampdiff(microsecond, @now, now(6))||
|
timestampdiff(microsecond, @now, now(6))
|
28736681
|
show engine innodb status;||
|
Type InnoDB
|
Name
|
Status
|
=====================================
|
2023-08-31 15:31:30 0x700007a94000 INNODB MONITOR OUTPUT
|
=====================================
|
Per second averages calculated from the last 1 seconds
|
-----------------
|
BACKGROUND THREAD
|
-----------------
|
srv_master_thread loops: 0 srv_active, 0 srv_shutdown, 61 srv_idle
|
srv_master_thread log flush and writes: 61
|
----------
|
SEMAPHORES
|
----------
|
------------
|
TRANSACTIONS
|
------------
|
Trx id counter 2000060
|
Purge done for trx's n:o < 0 undo n:o < 0 state: running but idle
|
History list length 0
|
LIST OF TRANSACTIONS FOR EACH SESSION:
|
---TRANSACTION (0x109ab2bc0), not started
|
0 lock struct(s), heap size 1128, 0 row lock(s)
|
--------
|
FILE I/O
|
--------
|
Pending flushes (fsync) log: 0; buffer pool: 0
|
495804 OS file reads, 14 OS file writes, 3 OS fsyncs
|
23772.23 reads/s, 16384 avg bytes/read, 0.00 writes/s, 0.00 fsyncs/s
|
-------------------------------------
|
INSERT BUFFER AND ADAPTIVE HASH INDEX
|
-------------------------------------
|
Ibuf: size 1, free list len 0, seg size 2, 0 merges
|
merged operations:
|
insert 0, delete mark 0, delete 0
|
discarded operations:
|
insert 0, delete mark 0, delete 0
|
0.00 hash searches/s, 0.00 non-hash searches/s
|
---
|
LOG
|
---
|
Log sequence number 4650717296
|
Log flushed up to 4650717296
|
Pages flushed up to 4650717296
|
Last checkpoint at 4650717284
|
0 pending log flushes, 0 pending chkp writes
|
4 log i/o's done, 0.00 log i/o's/second
|
----------------------
|
BUFFER POOL AND MEMORY
|
----------------------
|
Total large memory allocated 136314880
|
Dictionary memory allocated 860056
|
Buffer pool size 8030
|
Free buffers 0
|
Database pages 8030
|
Old database pages 2983
|
Modified db pages 0
|
Percent of dirty pages(LRU & free pages): 0.000
|
Max dirty pages percent: 90.000
|
Pending reads 0
|
Pending writes: LRU 0, flush list 0
|
Pages made young 1, not young 704458
|
0.00 youngs/s, 34263.74 non-youngs/s
|
Pages read 495790, created 131, written 0
|
23771.23 reads/s, 0.00 creates/s, 0.00 writes/s
|
Buffer pool hit rate 28 / 1000, young-making rate 0 / 1000 not 1400 / 1000
|
Pages read ahead 0.00/s, evicted without access 0.00/s, Random read ahead 0.00/s
|
LRU len: 8030, unzip_LRU len: 0
|
I/O sum[469912]:cur[23796], unzip sum[0]:cur[0]
|
--------------
|
ROW OPERATIONS
|
--------------
|
0 read views open inside InnoDB
|
Process ID=0, Main thread ID=0, state: sleeping
|
Number of rows inserted 0, updated 0, deleted 0, read 2000000
|
0.00 inserts/s, 0.00 updates/s, 0.00 deletes/s, 97891.11 reads/s
|
Number of system rows inserted 0, updated 0, deleted 0, read 0
|
0.00 inserts/s, 0.00 updates/s, 0.00 deletes/s, 0.00 reads/s
|
----------------------------
|
END OF INNODB MONITOR OUTPUT
|
============================
|
|
|
select @now := now(6)||
|
@now := now(6)
|
2023-08-31 15:31:30.242041
|
drop table tp||
|
select timestampdiff(microsecond, @now, now(6))||
|
timestampdiff(microsecond, @now, now(6))
|
237378
|
innodb.pt_large_restart_500K 'innodb' [ pass ] 355989
|
--------------------------------------------------------------------------
|
The servers were restarted 0 times
|
Spent 355.989 of 373 seconds executing testcases
|
|
|
Completed: All 1 tests were successful.
|
So, for 10.5 we see 33146.42892 and 32211.51862, while with recent fix in 10.6 we get faster![]() execution for both 1st and 2nd runs, 31569.316 and 28733.706.
execution for both 1st and 2nd runs, 31569.316 and 28733.706.
I'd say that with this fix 10.6 may be faster when innodb_flush_method = fsync.
Other use cases, like very slow HDDs, more advanced queries or making innodb_flush_method=O_DIRECT work fast(er), or return to fsync as default setting etc may become topics for new, related bug reports, if needed.
| Link | This issue blocks MENT-1933 [ MENT-1933 ] |
The fixed regression with innodb_flush_method=fsync was caused by MDEV-26769, which introduced an unreasonably long-scope hardware memory transaction in buf_read_ahead_linear(). At that time, I did run tests with
perf record --event=tx-abort
|
to see if all my use of transactional_lock_guard was helpful, but this code did not run because MDEV-29967 prevented the linear read-ahead from working back then.
The critical section of buf_pool.page_hash latch in buf_page_init_for_read() should be even larger in 10.5, because the 10.6 code was simplified after MDEV-26769 in MDEV-27058. Therefore, I would assume that most of the observed regression was caused by buf_read_ahead_linear().
| Link |
This issue is caused by |
| Link | This issue relates to MDEV-32067 [ MDEV-32067 ] |
I filed MDEV-32067 for implementing the logical read-ahead, which I think should improve the performance of innodb_flush_method=O_DIRECT when the reads cannot be satisfied from the buffer pool.
| Affects Version/s | 10.6.14 [ 28914 ] |
| Zendesk Related Tickets | 186134 149476 104714 119964 174317 125231 |
It turned out that History list length does NOT matter much, as we can see with the following modified test (on the same slow I/O bout platform):
openxs@ao756:~/dbs/maria10.5/mysql-test$ cat suite/innodb/t/pt_large.testsource include/have_innodb.inc;source include/have_partition.inc;set default_storage_engine=innodb;delimiter ||;set use_stat_tables=NEVER||create table tp (id int, c1 date, c2 int, c3 text, primary key(id, c1)) partition by range (to_days(c1)) (partition p1 values less than (734874), partition p2 values less than (735240), partition prest values less than (1000000))||select @now := now(6)||for i in 1..50000 do execute immediate concat('insert into tp (id, c1, c2, c3) values (', i,', "2023-01-02", 1, repeat("a", 2000))'); execute immediate concat('insert into tp (id, c1, c2, c3) values (', i,', "2023-01-01", 2, repeat("b", 2000))'); end for||select timestampdiff(microsecond, @now, now(6))||--query_vertical show table status like 'tp';delimiter ;||# try to force restart with flushing pages to diskset global innodb_fast_shutdown = 0;--exec echo "wait" > $MYSQLTEST_VARDIR/tmp/mysqld.1.expect--shutdown_server 300--source include/wait_until_disconnected.inc--enable_reconnect--exec echo "restart" > $MYSQLTEST_VARDIR/tmp/mysqld.1.expect--source include/wait_until_connected_again.inc--query_vertical show engine innodb status;#SELECT variable_name, variable_value#FROM information_schema.global_status#WHERE variable_name like 'INNODB_BUFFER_POOL_PAGES_%';delimiter ||;select @now := now(6)||analyze format=json select distinct(c1) from tp partition (prest)as t1||select timestampdiff(microsecond, @now, now(6))||select @now := now(6)||analyze format=json select distinct(c1) from tp partition (prest)as t1||select timestampdiff(microsecond, @now, now(6))||--query_vertical show engine innodb status;select @now := now(6)||drop table tp||select timestampdiff(microsecond, @now, now(6))||The idea is to force slow shutdown, flush to disk etc and restart of server before running the queries.
On 10.5.20 we see:
openxs@ao756:~/dbs/maria10.5/mysql-test$ ./mtr --mysqld='--innodb_flush_log_at_trx_commit=0' --mysqld='--innodb_buffer_pool_size=128M' --suite=innodb pt_largeLogging: ./mtr --mysqld=--innodb_flush_log_at_trx_commit=0 --mysqld=--innodb_buffer_pool_size=128M --suite=innodb pt_largeVS config:vardir: /home/openxs/dbs/maria10.5/mysql-test/varChecking leftover processes...Removing old var directory...Creating var directory '/home/openxs/dbs/maria10.5/mysql-test/var'...Checking supported features...MariaDB Version 10.5.20-MariaDB- SSL connections supportedCollecting tests...Installing system database...==============================================================================TEST RESULT TIME (ms) or COMMENT--------------------------------------------------------------------------worker[1] Using MTR_BUILD_THREAD 300, with reserved ports 16000..16019set default_storage_engine=innodb;set use_stat_tables=NEVER||create table tp (id int, c1 date, c2 int, c3 text, primary key(id, c1)) partition by range (to_days(c1)) (partition p1 values less than (734874), partition p2 values less than (735240), partition prest values less than (1000000))||select @now := now(6)||@now := now(6)2023-04-03 12:27:43.424711for i in 1..50000 do execute immediate concat('insert into tp (id, c1, c2, c3) values (', i,', "2023-01-02", 1, repeat("a", 2000))'); execute immediate concat('insert into tp (id, c1, c2, c3) values (', i,', "2023-01-01", 2, repeat("b", 2000))'); end for||select timestampdiff(microsecond, @now, now(6))||timestampdiff(microsecond, @now, now(6))103444271show table status like 'tp';||Name tpEngine InnoDBVersion 10Row_format DynamicRows 87753Avg_row_length 5245Data_length 460292096Max_data_length 0Index_length 0Data_free 5242880Auto_increment NULLCreate_time 2023-04-03 12:27:43Update_time 2023-04-03 12:29:26Check_time NULLCollation latin1_swedish_ciChecksum NULLCreate_options partitionedCommentMax_index_length 0Temporary Nset global innodb_fast_shutdown = 0;show engine innodb status;;Type InnoDBNameStatus=====================================2023-04-03 12:29:28 0x7fc3a51d2640 INNODB MONITOR OUTPUT=====================================Per second averages calculated from the last 0 seconds-----------------BACKGROUND THREAD-----------------srv_master_thread loops: 0 srv_active, 0 srv_shutdown, 1 srv_idlesrv_master_thread log flush and writes: 1----------SEMAPHORES----------OS WAIT ARRAY INFO: reservation count 0OS WAIT ARRAY INFO: signal count 0RW-shared spins 0, rounds 0, OS waits 0RW-excl spins 0, rounds 0, OS waits 0RW-sx spins 0, rounds 0, OS waits 0Spin rounds per wait: 0.00 RW-shared, 0.00 RW-excl, 0.00 RW-sx------------TRANSACTIONS------------Trx id counter 200034Purge done for trx's n:o < 0 undo n:o < 0 state: running but idleHistory list length 0LIST OF TRANSACTIONS FOR EACH SESSION:--------FILE I/O--------Pending flushes (fsync) log: 0; buffer pool: 02043 OS file reads, 2 OS file writes, 2 OS fsyncs0.00 reads/s, 3321 avg bytes/read, 0.00 writes/s, 0.00 fsyncs/s-------------------------------------INSERT BUFFER AND ADAPTIVE HASH INDEX-------------------------------------Ibuf: size 1, free list len 0, seg size 2, 0 mergesmerged operations:insert 0, delete mark 0, delete 0discarded operations:insert 0, delete mark 0, delete 00.00 hash searches/s, 42000.00 non-hash searches/s---LOG---Log sequence number 464002612Log flushed up to 464002612Pages flushed up to 464002612Last checkpoint at 4640026000 pending log flushes, 0 pending chkp writes4 log i/o's done, 4.00 log i/o's/second----------------------BUFFER POOL AND MEMORY----------------------Total large memory allocated 136314880Dictionary memory allocated 854112Buffer pool size 8065Free buffers 5903Database pages 2162Old database pages 818Modified db pages 0Percent of dirty pages(LRU & free pages): 0.000Max dirty pages percent: 90.000Pending reads 0Pending writes: LRU 0, flush list 0Pages made young 0, not young 00.00 youngs/s, 0.00 non-youngs/sPages read 2031, created 131, written 02031000.00 reads/s, 131000.00 creates/s, 0.00 writes/sBuffer pool hit rate 0 / 1000, young-making rate 0 / 1000 not 0 / 1000Pages read ahead 0.00/s, evicted without access 0.00/s, Random read ahead 0.00/sLRU len: 2162, unzip_LRU len: 0I/O sum[0]:cur[3], unzip sum[0]:cur[0]--------------ROW OPERATIONS--------------0 read views open inside InnoDBProcess ID=0, Main thread ID=0, state: sleepingNumber of rows inserted 0, updated 0, deleted 0, read 00.00 inserts/s, 0.00 updates/s, 0.00 deletes/s, 0.00 reads/sNumber of system rows inserted 0, updated 0, deleted 0, read 00.00 inserts/s, 0.00 updates/s, 0.00 deletes/s, 0.00 reads/s----------------------------END OF INNODB MONITOR OUTPUT============================select @now := now(6)||@now := now(6)2023-04-03 12:29:28.511571analyze format=json select distinct(c1) from tp partition (prest)as t1||ANALYZE{"query_block": {"select_id": 1,"r_loops": 1,"r_total_time_ms": 496.7287184,"temporary_table": {"table": {"table_name": "t1","partitions": ["prest"],"access_type": "index","key": "PRIMARY","key_length": "7","used_key_parts": ["id", "c1"],"r_loops": 1,"rows": 93759,"r_rows": 100000,"r_table_time_ms": 449.9474815,"r_other_time_ms": 46.75662559,"filtered": 100,"r_filtered": 100,"using_index": true}}}}select timestampdiff(microsecond, @now, now(6))||timestampdiff(microsecond, @now, now(6))513072select @now := now(6)||@now := now(6)2023-04-03 12:29:29.025214analyze format=json select distinct(c1) from tp partition (prest)as t1||ANALYZE{"query_block": {"select_id": 1,"r_loops": 1,"r_total_time_ms": 394.4953433,"temporary_table": {"table": {"table_name": "t1","partitions": ["prest"],"access_type": "index","key": "PRIMARY","key_length": "7","used_key_parts": ["id", "c1"],"r_loops": 1,"rows": 93759,"r_rows": 100000,"r_table_time_ms": 350.1508022,"r_other_time_ms": 44.33199987,"filtered": 100,"r_filtered": 100,"using_index": true}}}}select timestampdiff(microsecond, @now, now(6))||timestampdiff(microsecond, @now, now(6))394410show engine innodb status;||Type InnoDBNameStatus=====================================2023-04-03 12:29:29 0x7fc3a51d2640 INNODB MONITOR OUTPUT=====================================Per second averages calculated from the last 1 seconds-----------------BACKGROUND THREAD-----------------srv_master_thread loops: 0 srv_active, 0 srv_shutdown, 2 srv_idlesrv_master_thread log flush and writes: 2----------SEMAPHORES----------OS WAIT ARRAY INFO: reservation count 0OS WAIT ARRAY INFO: signal count 0RW-shared spins 0, rounds 0, OS waits 0RW-excl spins 0, rounds 0, OS waits 0RW-sx spins 0, rounds 0, OS waits 0Spin rounds per wait: 0.00 RW-shared, 0.00 RW-excl, 0.00 RW-sx------------TRANSACTIONS------------Trx id counter 200034Purge done for trx's n:o < 0 undo n:o < 0 state: running but idleHistory list length 0LIST OF TRANSACTIONS FOR EACH SESSION:---TRANSACTION 421953253392592, not started0 lock struct(s), heap size 1128, 0 row lock(s)--------FILE I/O--------Pending flushes (fsync) log: 0; buffer pool: 046063 OS file reads, 2 OS file writes, 2 OS fsyncs43976.02 reads/s, 16384 avg bytes/read, 0.00 writes/s, 0.00 fsyncs/s-------------------------------------INSERT BUFFER AND ADAPTIVE HASH INDEX-------------------------------------Ibuf: size 1, free list len 0, seg size 2, 0 mergesmerged operations:insert 0, delete mark 0, delete 0discarded operations:insert 0, delete mark 0, delete 00.00 hash searches/s, 5.99 non-hash searches/s---LOG---Log sequence number 464002612Log flushed up to 464002612Pages flushed up to 464002612Last checkpoint at 4640026000 pending log flushes, 0 pending chkp writes4 log i/o's done, 0.00 log i/o's/second----------------------BUFFER POOL AND MEMORY----------------------Total large memory allocated 136314880Dictionary memory allocated 856536Buffer pool size 8065Free buffers 0Database pages 8065Old database pages 2996Modified db pages 0Percent of dirty pages(LRU & free pages): 0.000Max dirty pages percent: 90.000Pending reads 0Pending writes: LRU 0, flush list 0Pages made young 0, not young 550740.00 youngs/s, 55018.98 non-youngs/sPages read 46051, created 131, written 043976.02 reads/s, 0.00 creates/s, 0.00 writes/sBuffer pool hit rate 390 / 1000, young-making rate 0 / 1000 not 761 / 1000Pages read ahead 0.00/s, evicted without access 608.39/s, Random read ahead 0.00/sLRU len: 8065, unzip_LRU len: 0I/O sum[0]:cur[44024], unzip sum[0]:cur[0]--------------ROW OPERATIONS--------------0 read views open inside InnoDBProcess ID=0, Main thread ID=0, state: sleepingNumber of rows inserted 0, updated 0, deleted 0, read 2000000.00 inserts/s, 0.00 updates/s, 0.00 deletes/s, 199800.20 reads/sNumber of system rows inserted 0, updated 0, deleted 0, read 00.00 inserts/s, 0.00 updates/s, 0.00 deletes/s, 0.00 reads/s----------------------------END OF INNODB MONITOR OUTPUT============================select @now := now(6)||@now := now(6)2023-04-03 12:29:29.420947drop table tp||select timestampdiff(microsecond, @now, now(6))||timestampdiff(microsecond, @now, now(6))237882innodb.pt_large 'innodb' [ pass ] 106435--------------------------------------------------------------------------The servers were restarted 0 timesSpent 106.435 of 115 seconds executing testcasesCompleted: All 1 tests were successful.While on 10.6:
openxs@ao756:~/dbs/maria10.6/mysql-test$ ./mtr --mysqld='--innodb_flush_log_at_trx_commit=0' --mysqld='--innodb_buffer_pool_size=128M' --suite=innodb pt_largeLogging: ./mtr --mysqld=--innodb_flush_log_at_trx_commit=0 --mysqld=--innodb_buffer_pool_size=128M --suite=innodb pt_largeVS config:vardir: /home/openxs/dbs/maria10.6/mysql-test/varChecking leftover processes...Removing old var directory...Creating var directory '/home/openxs/dbs/maria10.6/mysql-test/var'...Checking supported features...MariaDB Version 10.6.13-MariaDB- SSL connections supportedCollecting tests...Installing system database...==============================================================================TEST RESULT TIME (ms) or COMMENT--------------------------------------------------------------------------worker[1] Using MTR_BUILD_THREAD 300, with reserved ports 16000..16019set default_storage_engine=innodb;set use_stat_tables=NEVER||create table tp (id int, c1 date, c2 int, c3 text, primary key(id, c1)) partition by range (to_days(c1)) (partition p1 values less than (734874), partition p2 values less than (735240), partition prest values less than (1000000))||select @now := now(6)||@now := now(6)2023-04-03 12:22:11.874366for i in 1..50000 do execute immediate concat('insert into tp (id, c1, c2, c3) values (', i,', "2023-01-02", 1, repeat("a", 2000))'); execute immediate concat('insert into tp (id, c1, c2, c3) values (', i,', "2023-01-01", 2, repeat("b", 2000))'); end for||select timestampdiff(microsecond, @now, now(6))||timestampdiff(microsecond, @now, now(6))124212858show table status like 'tp';||Name tpEngine InnoDBVersion 10Row_format DynamicRows 97522Avg_row_length 4773Data_length 465551360Max_data_length 0Index_length 0Data_free 5242880Auto_increment NULLCreate_time 2023-04-03 12:22:11Update_time 2023-04-03 12:24:16Check_time NULLCollation latin1_swedish_ciChecksum NULLCreate_options partitionedCommentMax_index_length 0Temporary Nset global innodb_fast_shutdown = 0;show engine innodb status;;Type InnoDBNameStatus=====================================2023-04-03 12:24:19 0x7f17b44e8640 INNODB MONITOR OUTPUT=====================================Per second averages calculated from the last 0 seconds-----------------BACKGROUND THREAD-----------------srv_master_thread loops: 0 srv_active, 0 srv_shutdown, 1 srv_idlesrv_master_thread log flush and writes: 1----------SEMAPHORES----------------------TRANSACTIONS------------Trx id counter 200051Purge done for trx's n:o < 0 undo n:o < 0 state: running but idleHistory list length 0LIST OF TRANSACTIONS FOR EACH SESSION:--------FILE I/O--------Pending flushes (fsync) log: 0; buffer pool: 0810 OS file reads, 2 OS file writes, 2 OS fsyncs0.00 reads/s, 8336 avg bytes/read, 0.00 writes/s, 0.00 fsyncs/s-------------------------------------INSERT BUFFER AND ADAPTIVE HASH INDEX-------------------------------------Ibuf: size 1, free list len 0, seg size 2, 0 mergesmerged operations:insert 0, delete mark 0, delete 0discarded operations:insert 0, delete mark 0, delete 00.00 hash searches/s, 0.00 non-hash searches/s---LOG---Log sequence number 464734981Log flushed up to 464734981Pages flushed up to 464734981Last checkpoint at 4647349690 pending log flushes, 0 pending chkp writes4 log i/o's done, 4.00 log i/o's/second----------------------BUFFER POOL AND MEMORY----------------------Total large memory allocated 136314880Dictionary memory allocated 848424Buffer pool size 8112Free buffers 7185Database pages 927Old database pages 362Modified db pages 0Percent of dirty pages(LRU & free pages): 0.000Max dirty pages percent: 90.000Pending reads 491Pending writes: LRU 0, flush list 0Pages made young 0, not young 00.00 youngs/s, 0.00 non-youngs/sPages read 796, created 131, written 0796000.00 reads/s, 131000.00 creates/s, 0.00 writes/sBuffer pool hit rate 299 / 1000, young-making rate 0 / 1000 not 0 / 1000Pages read ahead 0.00/s, evicted without access 0.00/s, Random read ahead 0.00/sLRU len: 927, unzip_LRU len: 0I/O sum[0]:cur[1], unzip sum[0]:cur[0]--------------ROW OPERATIONS--------------0 read views open inside InnoDBProcess ID=0, Main thread ID=0, state: sleepingNumber of rows inserted 0, updated 0, deleted 0, read 00.00 inserts/s, 0.00 updates/s, 0.00 deletes/s, 0.00 reads/sNumber of system rows inserted 0, updated 0, deleted 0, read 00.00 inserts/s, 0.00 updates/s, 0.00 deletes/s, 0.00 reads/s----------------------------END OF INNODB MONITOR OUTPUT============================select @now := now(6)||@now := now(6)2023-04-03 12:24:19.910352analyze format=json select distinct(c1) from tp partition (prest)as t1||ANALYZE{"query_block": {"select_id": 1,"r_loops": 1,"r_total_time_ms": 27885.85776,"temporary_table": {"table": {"table_name": "t1","partitions": ["prest"],"access_type": "index","key": "PRIMARY","key_length": "7","used_key_parts": ["id", "c1"],"r_loops": 1,"rows": 96653,"r_rows": 100000,"r_table_time_ms": 27748.48687,"r_other_time_ms": 137.3572726,"filtered": 100,"r_filtered": 100,"using_index": true}}}}select timestampdiff(microsecond, @now, now(6))||timestampdiff(microsecond, @now, now(6))27874349select @now := now(6)||@now := now(6)2023-04-03 12:24:47.785130analyze format=json select distinct(c1) from tp partition (prest)as t1||ANALYZE{"query_block": {"select_id": 1,"r_loops": 1,"r_total_time_ms": 23906.68441,"temporary_table": {"table": {"table_name": "t1","partitions": ["prest"],"access_type": "index","key": "PRIMARY","key_length": "7","used_key_parts": ["id", "c1"],"r_loops": 1,"rows": 96653,"r_rows": 100000,"r_table_time_ms": 23770.49161,"r_other_time_ms": 136.1816679,"filtered": 100,"r_filtered": 100,"using_index": true}}}}select timestampdiff(microsecond, @now, now(6))||timestampdiff(microsecond, @now, now(6))23888900show engine innodb status;||Type InnoDBNameStatus=====================================2023-04-03 12:25:11 0x7f17b44e8640 INNODB MONITOR OUTPUT=====================================Per second averages calculated from the last 52 seconds-----------------BACKGROUND THREAD-----------------srv_master_thread loops: 0 srv_active, 0 srv_shutdown, 52 srv_idlesrv_master_thread log flush and writes: 52----------SEMAPHORES----------------------TRANSACTIONS------------Trx id counter 200052Purge done for trx's n:o < 0 undo n:o < 0 state: running but idleHistory list length 0LIST OF TRANSACTIONS FOR EACH SESSION:---TRANSACTION (0x7f17b4790b80), not started0 lock struct(s), heap size 1128, 0 row lock(s)--------FILE I/O--------Pending flushes (fsync) log: 0; buffer pool: 046058 OS file reads, 2 OS file writes, 2 OS fsyncs870.14 reads/s, 15932 avg bytes/read, 0.00 writes/s, 0.00 fsyncs/s-------------------------------------INSERT BUFFER AND ADAPTIVE HASH INDEX-------------------------------------Ibuf: size 1, free list len 0, seg size 2, 0 mergesmerged operations:insert 0, delete mark 0, delete 0discarded operations:insert 0, delete mark 0, delete 00.00 hash searches/s, 0.00 non-hash searches/s---LOG---Log sequence number 464734981Log flushed up to 464734981Pages flushed up to 464734981Last checkpoint at 4647349690 pending log flushes, 0 pending chkp writes4 log i/o's done, 0.00 log i/o's/second----------------------BUFFER POOL AND MEMORY----------------------Total large memory allocated 136314880Dictionary memory allocated 855336Buffer pool size 8112Free buffers 0Database pages 8112Old database pages 3014Modified db pages 0Percent of dirty pages(LRU & free pages): 0.000Max dirty pages percent: 90.000Pending reads 0Pending writes: LRU 0, flush list 0Pages made young 1, not young 549910.02 youngs/s, 1057.50 non-youngs/sPages read 46044, created 131, written 0870.14 reads/s, 0.00 creates/s, 0.00 writes/sBuffer pool hit rate 373 / 1000, young-making rate 0 / 1000 not 761 / 1000Pages read ahead 0.00/s, evicted without access 11.79/s, Random read ahead 0.00/sLRU len: 8112, unzip_LRU len: 0I/O sum[38108]:cur[5894], unzip sum[0]:cur[0]--------------ROW OPERATIONS--------------0 read views open inside InnoDBProcess ID=0, Main thread ID=0, state: sleepingNumber of rows inserted 0, updated 0, deleted 0, read 2000000.00 inserts/s, 0.00 updates/s, 0.00 deletes/s, 3846.08 reads/sNumber of system rows inserted 0, updated 0, deleted 0, read 00.00 inserts/s, 0.00 updates/s, 0.00 deletes/s, 0.00 reads/s----------------------------END OF INNODB MONITOR OUTPUT============================select @now := now(6)||@now := now(6)2023-04-03 12:25:11.675455drop table tp||select timestampdiff(microsecond, @now, now(6))||timestampdiff(microsecond, @now, now(6))146517innodb.pt_large 'innodb' [ pass ] 180017--------------------------------------------------------------------------The servers were restarted 0 timesSpent 180.017 of 200 seconds executing testcasesCompleted: All 1 tests were successful.