Details
-
Bug
-
Status: Closed (View Workflow)
-
Critical
-
Resolution: Fixed
-
10.6.11, 10.6.13, 10.6.14
-
Ubuntu 22.04
-
PERF - Sprint 2023.06
Description
Consider the following MTR test case:
openxs@ao756:~/dbs/maria10.5/mysql-test$ cat suite/innodb/t/pt_large.test
|
source include/have_innodb.inc;
|
source include/have_partition.inc;
|
set default_storage_engine=innodb;
|
delimiter ||;
|
set use_stat_tables=NEVER||
|
|
|
create table tp (id int, c1 date, c2 int, c3 text, primary key(id, c1)) partition by range (to_days(c1)) (partition p1 values less than (734874), partition p2 values less than (735240), partition prest values less than (1000000))||
|
|
|
select @now := now(6)||
|
|
|
for i in 1..50000 do execute immediate concat('insert into tp (id, c1, c2, c3) values (', i,', "2023-01-02", 1, repeat("a", 2000))'); execute immediate concat('insert into tp (id, c1, c2, c3) values (', i,', "2023-01-01", 2, repeat("b", 2000))'); end for||
|
|
|
select timestampdiff(microsecond, @now, now(6))||
|
|
|
--query_vertical show table status like 'tp';
|
|
|
#flush tables for export||
|
#--query_vertical show engine innodb status;
|
|
|
select @now := now(6)||
|
analyze format=json select distinct(c1) from tp partition (prest)
|
as t1||
|
select timestampdiff(microsecond, @now, now(6))||
|
|
|
select @now := now(6)||
|
analyze format=json select distinct(c1) from tp partition (prest)
|
as t1||
|
select timestampdiff(microsecond, @now, now(6))||
|
|
|
--query_vertical show engine innodb status;
|
|
|
select @now := now(6)||
|
drop table tp||
|
select timestampdiff(microsecond, @now, now(6))||
|
On a slow laptop with slow HDD, like this:
openxs@ao756:~/dbs/maria10.5/mysql-test$ pt-summary | more
|
# Percona Toolkit System Summary Report ######################
|
Date | 2023-04-02 15:22:06 UTC (local TZ: EEST +0300)
|
Hostname | ao756
|
Uptime | 5:09, 2 users, load average: 0,15, 1,21, 1,90
|
Platform | Linux
|
Release | Ubuntu 22.04.2 LTS (jammy)
|
Kernel | 5.15.0-58-generic
|
Architecture | CPU = 64-bit, OS = 64-bit
|
Threading | NPTL 2.35
|
SELinux | No SELinux detected
|
Virtualized | No virtualization detected
|
# Processor ##################################################
|
Processors | physical = 1, cores = 2, virtual = 2, hyperthreading = no
|
Speeds | 1x1000.000, 1x142.277
|
Models | 2xIntel(R) Pentium(R) CPU 987 @ 1.50GHz
|
Caches | 2x2048 KB
|
# Memory #####################################################
|
Total | 3,7G
|
Free | 1,3G
|
Used | physical = 665,1M, swap allocated = 980,0M, swap used = 362,3M, vir
|
tual = 1,0G
|
...
|
and in other I/O-bound cases, we see that 10,5 allows to run a query that scans the entire partition via PRIMARY KEY fast enough no matter how many times we try:
openxs@ao756:~/dbs/maria10.5/mysql-test$ ./mtr --mysqld='--innodb_flush_log_at_trx_commit=0' --mysqld='--innodb_buffer_pool_size=128M' --suite=innodb pt_large
|
Logging: ./mtr --mysqld=--innodb_flush_log_at_trx_commit=0 --mysqld=--innodb_buffer_pool_size=128M --suite=innodb pt_large
|
VS config:
|
vardir: /home/openxs/dbs/maria10.5/mysql-test/var
|
Checking leftover processes...
|
mysql-test-run: WARNING: Found non pid file 'mysqld.err' in '/home/openxs/dbs/maria10.5/mysql-test/var/run'
|
- found old pid 90976 in 'mysqld.2.pid', killing it...
|
process did not exist!
|
Removing old var directory...
|
Creating var directory '/home/openxs/dbs/maria10.5/mysql-test/var'...
|
Checking supported features...
|
MariaDB Version 10.5.20-MariaDB
|
- SSL connections supported
|
Collecting tests...
|
Installing system database...
|
|
|
==============================================================================
|
|
|
TEST RESULT TIME (ms) or COMMENT
|
--------------------------------------------------------------------------
|
|
|
worker[1] Using MTR_BUILD_THREAD 300, with reserved ports 16000..16019
|
set default_storage_engine=innodb;
|
set use_stat_tables=NEVER||
|
create table tp (id int, c1 date, c2 int, c3 text, primary key(id, c1)) partition by range (to_days(c1)) (partition p1 values less than (734874), partition p2 values less than (735240), partition prest values less than (1000000))||
|
select @now := now(6)||
|
@now := now(6)
|
2023-04-02 17:20:30.960954
|
for i in 1..50000 do execute immediate concat('insert into tp (id, c1, c2, c3) values (', i,', "2023-01-02", 1, repeat("a", 2000))'); execute immediate concat('insert into tp (id, c1, c2, c3) values (', i,', "2023-01-01", 2, repeat("b", 2000))'); end for||
|
select timestampdiff(microsecond, @now, now(6))||
|
timestampdiff(microsecond, @now, now(6))
|
104310397
|
show table status like 'tp';||
|
Name tp
|
Engine InnoDB
|
Version 10
|
Row_format Dynamic
|
Rows 100009
|
Avg_row_length 4476
|
Data_length 447709184
|
Max_data_length 0
|
Index_length 0
|
Data_free 5242880
|
Auto_increment NULL
|
Create_time 2023-04-02 17:20:30
|
Update_time 2023-04-02 17:22:15
|
Check_time NULL
|
Collation latin1_swedish_ci
|
Checksum NULL
|
Create_options partitioned
|
Comment
|
Max_index_length 0
|
Temporary N
|
select @now := now(6)||
|
@now := now(6)
|
2023-04-02 17:22:15.272766
|
analyze format=json select distinct(c1) from tp partition (prest)
|
as t1||
|
ANALYZE
|
{
|
"query_block": {
|
"select_id": 1,
|
"r_loops": 1,
|
"r_total_time_ms": 483.4085944,
|
"temporary_table": {
|
"table": {
|
"table_name": "t1",
|
"partitions": ["prest"],
|
"access_type": "index",
|
"key": "PRIMARY",
|
"key_length": "7",
|
"used_key_parts": ["id", "c1"],
|
"r_loops": 1,
|
"rows": 100007,
|
"r_rows": 100000,
|
"r_table_time_ms": 439.0825011,
|
"r_other_time_ms": 44.31424626,
|
"filtered": 100,
|
"r_filtered": 100,
|
"using_index": true
|
}
|
}
|
}
|
}
|
select timestampdiff(microsecond, @now, now(6))||
|
timestampdiff(microsecond, @now, now(6))
|
484134
|
select @now := now(6)||
|
@now := now(6)
|
2023-04-02 17:22:15.757233
|
analyze format=json select distinct(c1) from tp partition (prest)
|
as t1||
|
ANALYZE
|
{
|
"query_block": {
|
"select_id": 1,
|
"r_loops": 1,
|
"r_total_time_ms": 496.110545,
|
"temporary_table": {
|
"table": {
|
"table_name": "t1",
|
"partitions": ["prest"],
|
"access_type": "index",
|
"key": "PRIMARY",
|
"key_length": "7",
|
"used_key_parts": ["id", "c1"],
|
"r_loops": 1,
|
"rows": 100007,
|
"r_rows": 100000,
|
"r_table_time_ms": 451.8577746,
|
"r_other_time_ms": 44.20580505,
|
"filtered": 100,
|
"r_filtered": 100,
|
"using_index": true
|
}
|
}
|
}
|
}
|
select timestampdiff(microsecond, @now, now(6))||
|
timestampdiff(microsecond, @now, now(6))
|
497149
|
show engine innodb status;||
|
Type InnoDB
|
Name
|
Status
|
=====================================
|
2023-04-02 17:22:16 0x7f518bdb4640 INNODB MONITOR OUTPUT
|
=====================================
|
Per second averages calculated from the last 46 seconds
|
-----------------
|
BACKGROUND THREAD
|
-----------------
|
srv_master_thread loops: 0 srv_active, 0 srv_shutdown, 100 srv_idle
|
srv_master_thread log flush and writes: 100
|
----------
|
SEMAPHORES
|
----------
|
OS WAIT ARRAY INFO: reservation count 1043
|
OS WAIT ARRAY INFO: signal count 1000
|
RW-shared spins 386, rounds 6780, OS waits 101
|
RW-excl spins 1455, rounds 22817, OS waits 613
|
RW-sx spins 54, rounds 1501, OS waits 47
|
Spin rounds per wait: 17.56 RW-shared, 15.68 RW-excl, 27.80 RW-sx
|
------------
|
TRANSACTIONS
|
------------
|
Trx id counter 200033
|
Purge done for trx's n:o < 200033 undo n:o < 0 state: running
|
History list length 39
|
LIST OF TRANSACTIONS FOR EACH SESSION:
|
---TRANSACTION 421463270588624, not started
|
0 lock struct(s), heap size 1128, 0 row lock(s)
|
--------
|
FILE I/O
|
--------
|
Pending flushes (fsync) log: 0; buffer pool: 0
|
40609 OS file reads, 57765 OS file writes, 2112 OS fsyncs
|
878.26 reads/s, 16384 avg bytes/read, 539.03 writes/s, 19.83 fsyncs/s
|
-------------------------------------
|
INSERT BUFFER AND ADAPTIVE HASH INDEX
|
-------------------------------------
|
Ibuf: size 1, free list len 0, seg size 2, 0 merges
|
merged operations:
|
insert 0, delete mark 0, delete 0
|
discarded operations:
|
insert 0, delete mark 0, delete 0
|
0.00 hash searches/s, 2450.10 non-hash searches/s
|
---
|
LOG
|
---
|
Log sequence number 464003121
|
Log flushed up to 464003121
|
Pages flushed up to 461484600
|
Last checkpoint at 461484600
|
0 pending log flushes, 0 pending chkp writes
|
1497 log i/o's done, 14.28 log i/o's/second
|
----------------------
|
BUFFER POOL AND MEMORY
|
----------------------
|
Total large memory allocated 136314880
|
Dictionary memory allocated 866232
|
Buffer pool size 8065
|
Free buffers 0
|
Database pages 8065
|
Old database pages 2957
|
Modified db pages 395
|
Percent of dirty pages(LRU & free pages): 4.897
|
Max dirty pages percent: 90.000
|
Pending reads 0
|
Pending writes: LRU 0, flush list 0
|
Pages made young 893, not young 58427
|
8.07 youngs/s, 1269.30 non-youngs/s
|
Pages read 40595, created 25867, written 55933
|
878.26 reads/s, 238.65 creates/s, 521.60 writes/s
|
Buffer pool hit rate 959 / 1000, young-making rate 0 / 1000 not 58 / 1000
|
Pages read ahead 0.00/s, evicted without access 0.00/s, Random read ahead 0.00/s
|
LRU len: 8065, unzip_LRU len: 0
|
I/O sum[35628]:cur[37550], unzip sum[0]:cur[0]
|
--------------
|
ROW OPERATIONS
|
--------------
|
0 read views open inside InnoDB
|
Process ID=0, Main thread ID=0, state: sleeping
|
Number of rows inserted 100000, updated 0, deleted 0, read 200000
|
933.26 inserts/s, 0.00 updates/s, 0.00 deletes/s, 4347.73 reads/s
|
Number of system rows inserted 0, updated 0, deleted 0, read 0
|
0.00 inserts/s, 0.00 updates/s, 0.00 deletes/s, 0.00 reads/s
|
----------------------------
|
END OF INNODB MONITOR OUTPUT
|
============================
|
|
|
select @now := now(6)||
|
@now := now(6)
|
2023-04-02 17:22:16.255774
|
drop table tp||
|
select timestampdiff(microsecond, @now, now(6))||
|
timestampdiff(microsecond, @now, now(6))
|
238777
|
innodb.pt_large 'innodb' [ pass ] 105738
|
--------------------------------------------------------------------------
|
The servers were restarted 0 times
|
Spent 105.738 of 122 seconds executing testcases
|
|
|
Completed: All 1 tests were successful.
|
while with 10.6 (maybe because of history list length etc issues as per MDEV-29401) we often get 5 or more times slower execution of the query:
openxs@ao756:~/dbs/maria10.5/mysql-test$ cd ../../maria10.6/mysql-test/
|
openxs@ao756:~/dbs/maria10.6/mysql-test$ cp ../../maria10.5/mysql-test/suite/innodb/t/pt_large.test suite/innodb/t/
|
openxs@ao756:~/dbs/maria10.6/mysql-test$ ./mtr --mysqld='--innodb_flush_log_at_trx_commit=0' --mysqld='--innodb_buffer_pool_size=128M' --suite=innodb pt_large
|
Logging: ./mtr --mysqld=--innodb_flush_log_at_trx_commit=0 --mysqld=--innodb_buffer_pool_size=128M --suite=innodb pt_large
|
VS config:
|
vardir: /home/openxs/dbs/maria10.6/mysql-test/var
|
Checking leftover processes...
|
Removing old var directory...
|
Creating var directory '/home/openxs/dbs/maria10.6/mysql-test/var'...
|
Checking supported features...
|
MariaDB Version 10.6.13-MariaDB
|
- SSL connections supported
|
Collecting tests...
|
Installing system database...
|
|
|
==============================================================================
|
|
|
TEST RESULT TIME (ms) or COMMENT
|
--------------------------------------------------------------------------
|
|
|
worker[1] Using MTR_BUILD_THREAD 300, with reserved ports 16000..16019
|
set default_storage_engine=innodb;
|
set use_stat_tables=NEVER||
|
create table tp (id int, c1 date, c2 int, c3 text, primary key(id, c1)) partition by range (to_days(c1)) (partition p1 values less than (734874), partition p2 values less than (735240), partition prest values less than (1000000))||
|
select @now := now(6)||
|
@now := now(6)
|
2023-04-02 17:24:05.101340
|
for i in 1..50000 do execute immediate concat('insert into tp (id, c1, c2, c3) values (', i,', "2023-01-02", 1, repeat("a", 2000))'); execute immediate concat('insert into tp (id, c1, c2, c3) values (', i,', "2023-01-01", 2, repeat("b", 2000))'); end for||
|
select timestampdiff(microsecond, @now, now(6))||
|
timestampdiff(microsecond, @now, now(6))
|
127794694
|
show table status like 'tp';||
|
Name tp
|
Engine InnoDB
|
Version 10
|
Row_format Dynamic
|
Rows 97501
|
Avg_row_length 4807
|
Data_length 468697088
|
Max_data_length 0
|
Index_length 0
|
Data_free 5242880
|
Auto_increment NULL
|
Create_time 2023-04-02 17:24:05
|
Update_time 2023-04-02 17:26:12
|
Check_time NULL
|
Collation latin1_swedish_ci
|
Checksum NULL
|
Create_options partitioned
|
Comment
|
Max_index_length 0
|
Temporary N
|
select @now := now(6)||
|
@now := now(6)
|
2023-04-02 17:26:12.897397
|
analyze format=json select distinct(c1) from tp partition (prest)
|
as t1||
|
ANALYZE
|
{
|
"query_block": {
|
"select_id": 1,
|
"r_loops": 1,
|
"r_total_time_ms": 23488.31341,
|
"temporary_table": {
|
"table": {
|
"table_name": "t1",
|
"partitions": ["prest"],
|
"access_type": "index",
|
"key": "PRIMARY",
|
"key_length": "7",
|
"used_key_parts": ["id", "c1"],
|
"r_loops": 1,
|
"rows": 97499,
|
"r_rows": 100000,
|
"r_table_time_ms": 23361.07277,
|
"r_other_time_ms": 127.2287723,
|
"filtered": 100,
|
"r_filtered": 100,
|
"using_index": true
|
}
|
}
|
}
|
}
|
select timestampdiff(microsecond, @now, now(6))||
|
timestampdiff(microsecond, @now, now(6))
|
23437366
|
select @now := now(6)||
|
@now := now(6)
|
2023-04-02 17:26:36.335328
|
analyze format=json select distinct(c1) from tp partition (prest)
|
as t1||
|
ANALYZE
|
{
|
"query_block": {
|
"select_id": 1,
|
"r_loops": 1,
|
"r_total_time_ms": 22864.82057,
|
"temporary_table": {
|
"table": {
|
"table_name": "t1",
|
"partitions": ["prest"],
|
"access_type": "index",
|
"key": "PRIMARY",
|
"key_length": "7",
|
"used_key_parts": ["id", "c1"],
|
"r_loops": 1,
|
"rows": 97499,
|
"r_rows": 100000,
|
"r_table_time_ms": 22738.28402,
|
"r_other_time_ms": 126.5225293,
|
"filtered": 100,
|
"r_filtered": 100,
|
"using_index": true
|
}
|
}
|
}
|
}
|
select timestampdiff(microsecond, @now, now(6))||
|
timestampdiff(microsecond, @now, now(6))
|
22815438
|
show engine innodb status;||
|
Type InnoDB
|
Name
|
Status
|
=====================================
|
2023-04-02 17:26:59 0x7f24c4dcf640 INNODB MONITOR OUTPUT
|
=====================================
|
Per second averages calculated from the last 55 seconds
|
-----------------
|
BACKGROUND THREAD
|
-----------------
|
srv_master_thread loops: 0 srv_active, 0 srv_shutdown, 167 srv_idle
|
srv_master_thread log flush and writes: 167
|
----------
|
SEMAPHORES
|
----------
|
------------
|
TRANSACTIONS
|
------------
|
Trx id counter 200050
|
Purge done for trx's n:o < 200050 undo n:o < 0 state: running but idle
|
History list length 12406
|
LIST OF TRANSACTIONS FOR EACH SESSION:
|
---TRANSACTION (0x7f24c5878b80), not started
|
0 lock struct(s), heap size 1128, 0 row lock(s)
|
--------
|
FILE I/O
|
--------
|
Pending flushes (fsync) log: 0; buffer pool: 0
|
41656 OS file reads, 78854 OS file writes, 2646 OS fsyncs
|
744.46 reads/s, 16384 avg bytes/read, 86.42 writes/s, 3.02 fsyncs/s
|
-------------------------------------
|
INSERT BUFFER AND ADAPTIVE HASH INDEX
|
-------------------------------------
|
Ibuf: size 1, free list len 0, seg size 2, 0 merges
|
merged operations:
|
insert 0, delete mark 0, delete 0
|
discarded operations:
|
insert 0, delete mark 0, delete 0
|
0.00 hash searches/s, 0.00 non-hash searches/s
|
---
|
LOG
|
---
|
Log sequence number 464394282
|
Log flushed up to 464394282
|
Pages flushed up to 460080075
|
Last checkpoint at 460080075
|
0 pending log flushes, 0 pending chkp writes
|
1518 log i/o's done, 1.93 log i/o's/second
|
----------------------
|
BUFFER POOL AND MEMORY
|
----------------------
|
Total large memory allocated 136314880
|
Dictionary memory allocated 859944
|
Buffer pool size 8112
|
Free buffers 41
|
Database pages 8071
|
Old database pages 2996
|
Modified db pages 858
|
Percent of dirty pages(LRU & free pages): 10.576
|
Max dirty pages percent: 90.000
|
Pending reads 0
|
Pending writes: LRU 0, flush list 0
|
Pages made young 194, not young 59379
|
0.13 youngs/s, 1075.18 non-youngs/s
|
Pages read 41642, created 26850, written 76855
|
744.46 reads/s, 31.96 creates/s, 83.94 writes/s
|
Buffer pool hit rate 784 / 1000, young-making rate 0 / 1000 not 311 / 1000
|
Pages read ahead 0.00/s, evicted without access 2.44/s, Random read ahead 0.00/s
|
LRU len: 8071, unzip_LRU len: 0
|
I/O sum[46204]:cur[8322], unzip sum[0]:cur[0]
|
--------------
|
ROW OPERATIONS
|
--------------
|
0 read views open inside InnoDB
|
Process ID=0, Main thread ID=0, state: sleeping
|
Number of rows inserted 100000, updated 0, deleted 0, read 200000
|
119.40 inserts/s, 0.00 updates/s, 0.00 deletes/s, 3636.30 reads/s
|
Number of system rows inserted 0, updated 0, deleted 0, read 0
|
0.00 inserts/s, 0.00 updates/s, 0.00 deletes/s, 0.00 reads/s
|
----------------------------
|
END OF INNODB MONITOR OUTPUT
|
============================
|
|
|
select @now := now(6)||
|
@now := now(6)
|
2023-04-02 17:26:59.152604
|
drop table tp||
|
select timestampdiff(microsecond, @now, now(6))||
|
timestampdiff(microsecond, @now, now(6))
|
88100
|
innodb.pt_large 'innodb' [ pass ] 174209
|
--------------------------------------------------------------------------
|
The servers were restarted 0 times
|
Spent 174.209 of 199 seconds executing testcases
|
|
|
Completed: All 1 tests were successful.
|
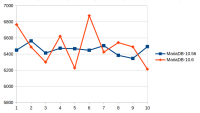
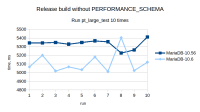
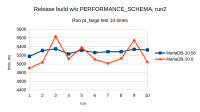
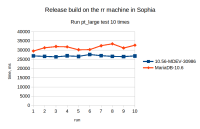
Execution plans, data, settings (other than defaults) are all the same. But if we try many times the problem is obvious. On 10.5:
openxs@ao756:~/dbs/maria10.5/mysql-test$ ./mtr --mysqld='--innodb_flush_log_at_trx_commit=0' --mysqld='--innodb_buffer_pool_size=128M' --repeat=10 --suite=innodb pt_large | grep -e "r_total_time_ms" -e 'History'
|
"r_total_time_ms": 491.6631284,
|
"r_total_time_ms": 507.3302068,
|
History list length 50
|
"r_total_time_ms": 485.4183206,
|
"r_total_time_ms": 544.7983346,
|
History list length 42
|
"r_total_time_ms": 497.4036018,
|
"r_total_time_ms": 542.3594439,
|
History list length 19
|
"r_total_time_ms": 485.4261564,
|
"r_total_time_ms": 504.1408094,
|
History list length 21
|
"r_total_time_ms": 491.8014112,
|
"r_total_time_ms": 506.5794441,
|
History list length 30
|
"r_total_time_ms": 506.0841696,
|
"r_total_time_ms": 512.9175432,
|
History list length 19
|
"r_total_time_ms": 527.1490708,
|
"r_total_time_ms": 509.8647148,
|
History list length 46
|
"r_total_time_ms": 492.577935,
|
"r_total_time_ms": 505.5527027,
|
History list length 5
|
"r_total_time_ms": 527.909722,
|
"r_total_time_ms": 507.3815736,
|
History list length 29
|
"r_total_time_ms": 494.5920197,
|
"r_total_time_ms": 503.798489,
|
History list length 39
|
we see always small History list length and predictable, stable execution time. Now on 10.6 the situation is very different:
openxs@ao756:~/dbs/maria10.6/mysql-test$ ./mtr --mysqld='--innodb_flush_log_at_trx_commit=0' --mysqld='--innodb_buffer_pool_size=128M' --repeat=10 --suite=innodb pt_large | grep -e "r_total_time_ms" -e 'History'
|
"r_total_time_ms": 24131.43297,
|
"r_total_time_ms": 22605.21843,
|
History list length 0
|
"r_total_time_ms": 22972.90129,
|
"r_total_time_ms": 22860.8124,
|
History list length 4165
|
"r_total_time_ms": 24148.09257,
|
"r_total_time_ms": 23086.00005,
|
History list length 0
|
"r_total_time_ms": 24145.83615,
|
"r_total_time_ms": 22688.66274,
|
History list length 10288
|
"r_total_time_ms": 26353.22961,
|
"r_total_time_ms": 23047.84638,
|
History list length 0
|
"r_total_time_ms": 23301.57555,
|
"r_total_time_ms": 22777.66788,
|
History list length 16120
|
"r_total_time_ms": 23641.375,
|
"r_total_time_ms": 22868.85873,
|
History list length 0
|
"r_total_time_ms": 23898.78684,
|
"r_total_time_ms": 22960.07185,
|
History list length 15286
|
"r_total_time_ms": 24282.99769,
|
"r_total_time_ms": 22952.89102,
|
History list length 10849
|
"r_total_time_ms": 24413.22993,
|
"r_total_time_ms": 22775.74191,
|
History list length 2030
|
|
Attachments
Issue Links
- is caused by
-
MDEV-26769 InnoDB internal latches do not support hardware lock elision
-
- Closed
-
- relates to
-
MDEV-29967 innodb_read_ahead_threshold (linear read-ahead) does not work
-
- Closed
-
-
MDEV-31227 innodb_flush_method=O_DIRECT causes 3x regression in workload
-
- Closed
-
-
MDEV-32067 InnoDB linear read ahead had better be logical
-
- Stalled
-
-
MDEV-11378 AliSQL: [Perf] Issue#23 MERGE INNODB AIO REQUEST
-
- Open
-
-
MDEV-24854 Change innodb_flush_method=O_DIRECT by default
-
- Closed
-
