Details
-
Bug
-
Status: Closed (View Workflow)
-
 Critical
-
Resolution: Fixed
-
10.3(EOL), 10.4(EOL), 10.5(EOL), 10.6, 10.11, 11.4, 11.8
-
Related to performance
-
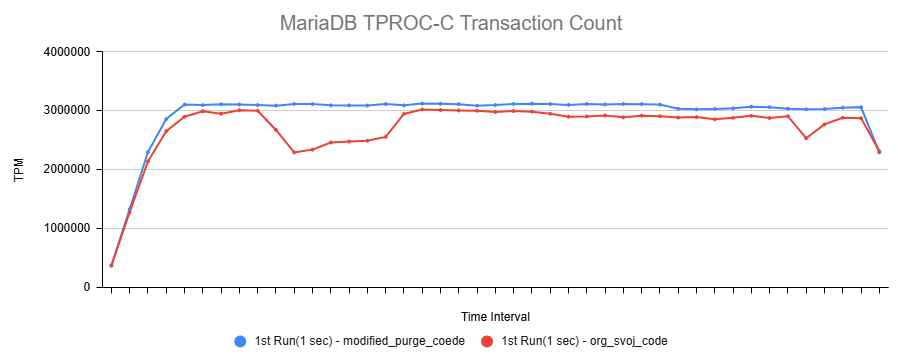
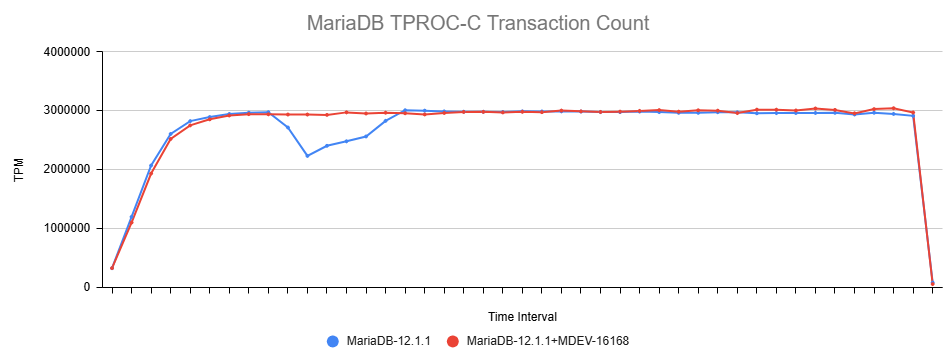
The InnoDB purge subsystem will no longer reset transaction identifiers in freshly inserted records, because it did severely hurt performance in some workloads.
Description
I noticed reduced performance numbers when running somewhat large update_no_index sysbench benchmark, when comparing 10.2 to 10.3
Here is the setup
- Windows Azure VMwith 16 virtual CPUs, 32GB RAM and SSD storage (I used Local temporary disk)
Intel(R) Xeon(R) CPU E5-2673 v4 @ 2.30GHz
Sockets: 1
Virtual processors: 16
- MariaDB 10.2.14 vs 10.3.7 (recent build of 4a5e23e257e229b548599133dbed5162af9df6d9)
the relevant part of my.ini file is as follows[mysqld]back_log=500max_connections=4096max_prepared_stmt_count=500000table_open_cache=10000transaction_isolation=REPEATABLE-READinnodb_status_file=0innodb_buffer_pool_size=20Ginnodb_log_file_size=15Ginnodb_log_buffer_size=1000Minnodb-io-capacity=4000innodb-io-capacity-max=5000innodb_doublewrite=0innodb-page-cleaners=1innodb-buffer-pool-instances=1innodb_adaptive_flushing=0innodb_adaptive_flushing_lwm=10 - sysbench 0.4 (I mention it because current versions of sysbench do not run on Windows anymore, but we do not need anything from the current versions)
The update-no-index run on a single large table (50 mio rows), with number of users ranging from 1 to 4096, in powers of 2
Loading table, sysbench prepare
sysbench --test=oltp --oltp-table-size=50000000 --mysql-host=localhost --mysql-db=sbtest --mysql-user=root --mysql-password= --db-driver=mysql --mysql-table-engine=innodb --max-time=300 --oltp-test-mode=complex --oltp-read-only=off --max-requests=0 --oltp-point-selects=0 --oltp-simple-ranges=0 --oltp-sum-ranges=0 --oltp-order-ranges=0 --oltp-distinct-ranges=0 --oltp-index-updates=0 --oltp-delete-inserts=0 --oltp-non-index-updates=1 --oltp-skip-trx=on --oltp-dist-type=uniform --mysql-socket=MySQL --num-threads=1 prepare
|
sysbench run
sysbench --test=oltp --oltp-table-size=50000000 --mysql-host=localhost --mysql-db=sbtest --mysql-user=root --mysql-password= --db-driver=mysql --mysql-table-engine=innodb --max-time=300 --oltp-test-mode=complex --oltp-read-only=off --max-requests=0 --oltp-point-selects=0 --oltp-simple-ranges=0 --oltp-sum-ranges=0 --oltp-order-ranges=0 --oltp-distinct-ranges=0 --oltp-index-updates=0 --oltp-delete-inserts=0 --oltp-non-index-updates=1 --oltp-skip-trx=on --oltp-dist-type=uniform --mysql-socket=MySQL --num-threads=%N% run
|
where %N% is 1,2,4,8,16,32,64,128,256,512,1024,2048,4096
The test takes a nap of 80 seconds between runs, and also between load and first test, and as far as I can see it is enough for all Innodb backgroup IO activity to finish (MB/sec goes down to 0 on a disk where test is ran). Due to innodb-flush-log-at-trx-commit being default (1), the test does not appear to be very CPU bound (sysbench and mysql use 70% of all available 16 CPUs, in windows measurement, i.e over 10 CPUs are busy)
Below are the results from the runs, for 10.2.4 and recent 10.3.7
UPDATE: marko mentioned the git 1a62c8a39647db00283b4e35fb6db3c7bc31e3ca as the version right before 10.3 switched to lockless, so
I added a column for it too. It appears to be better than 10.3.7, but worse than 10.2.14
| Users | TPS 10.2.14 | TPS 10.3.7 | 10.3-pre-lockless |
|---|---|---|---|
| 1 | 1549.92 | 1547.75 | 1551.07 |
| 2 | 2373.89 | 2209.05 | 2334.80 |
| 4 | 4466.03 | 4276.46 | 4446.64 |
| 8 | 9069.82 | 8587.59 | 9098.95 |
| 16 | 16631.45 | 15719.70 | 16231.39 |
| 32 | 28989.79 | 27482.44 | 27786.32 |
| 64 | 36996.12 | 34843.23 | 35089.44 |
| 128 | 37287.05 | 35172.49 | 36223.68 |
| 256 | 38038.01 | 35896.52 | 36818.22 |
| 512 | 38360.71 | 36567.07 | 37195.47 |
| 1024 | 38265.25 | 36328.62 | 37253.98 |
| 2048 | 39990.85 | 36328.62 | 38572.81 |
| 4096 | 41988.71 | 39032.83 | 39606.38 |
(also see the graph https://docs.google.com/spreadsheets/d/1VqRYCwF4QATCKEKwxKuCcvRXKm2GWnICCdv4fSo4_IU/edit#gid=0)
It is not as big as I thought initially (somehow I counted 15%, and it is more like 5%), but it is consistent starting from 64 users, and keeping until the 4K . So it needs investigating.
It is odd because the test itself is not CPU bound, nor IO bound, the bottleneck in my understanding is waiting for flush in log_write_up_to() . I did not try to make it CPU bound by relaxing durability, this might be another exercise, however with increased TPS purging can become more of a bottleneck, and disturb the picture.
I tried to do some initial profiling (based on CPU sampling), and this is what showed up.
Below., in all places, baseline refers to 10.2.14, and *comparison" is 10.3.7
Exclusive samples comparison
Individual functions (or, exclusive sample percentage with threshold 1% difference)
| Comparison Column | Delta | Baseline Value | Comparison Value |
|---|---|---|---|
| ut_delay | 4.02 | 16.05 | 20.07 |
| l_find | 2.44 | 0.16 | 2.60 |
| PolicyMutex<TTASEventMutex<GenericPolicy> >::enter | 2.42 | 0.18 | 2.60 |
| TTASEventMutex<GenericPolicy>::enter | -4.42 | 4.42 | 0.00 |
| SleepConditionVariableCS | -5.41 | 28.70 | 23.29 |
In short, more busy wait ut_delay, less lazy wait SleepConditionVariableCS . There is a new quite visible function (4th most expensive individual functions now), l_find , which seems to come from replacing stl with custom hashtable in innodb.
Inclusive samples comparison
Comparing inclusive samples with 1% difference threshold, gives the below table, which gives me a vague idea that there something is more expensive in purge, and again that lazy wait was replaced with busy wait somewhere, background threads probably use more CPU , for example "coordinator" purge thread. foreground use less of it (as shown by decreased time in do_command for example)
| Comparison Column | Delta | Baseline Value | Comparison Value |
|---|---|---|---|
| PolicyMutex<TTASEventMutex<GenericPolicy> >::enter | 28.69 | 2.53 | 31.22 |
| ut_delay | 4.02 | 16.05 | 20.07 |
| trx_purge | 3.81 | 5.67 | 9.48 |
| srv_do_purge | 3.80 | 5.70 | 9.49 |
| row_purge | 3.66 | 0.00 | 3.67 |
| row_purge_step | 3.47 | 0.71 | 4.18 |
| que_thr_step | 3.31 | 0.94 | 4.25 |
| srv_purge_coordinator_thread | 3.25 | 6.37 | 9.63 |
| trx_sys_t::clone_oldest_view | 3.18 | 0.00 | 3.18 |
| btr_cur_search_to_nth_level_func | 3.12 | 0.00 | 3.12 |
| row_purge_record_func | 2.94 | 0.00 | 2.94 |
| row_purge_upd_exist_or_extern_func | 2.77 | 0.00 | 2.77 |
| row_purge_reset_trx_id | 2.72 | 0.00 | 2.72 |
| que_run_threads_low | 2.70 | 1.73 | 4.43 |
| que_run_threads | 2.69 | 1.75 | 4.45 |
| l_find | 2.46 | 0.18 | 2.64 |
| ReadView::snapshot | 2.30 | 0.00 | 2.30 |
| rw_trx_hash_t::iterate | 2.27 | 0.00 | 2.27 |
| lf_hash_iterate | 2.25 | 0.00 | 2.25 |
| srv_task_execute | 2.12 | 1.95 | 4.08 |
| row_purge_reposition_pcur | 1.53 | 0.00 | 1.53 |
| row_search_on_row_ref | 1.33 | 0.00 | 1.33 |
| btr_pcur_open_low | 1.31 | 0.00 | 1.31 |
| btr_search_guess_on_hash | 1.31 | 1.54 | 2.85 |
| trx_purge_wait_for_workers_to_complete | 1.10 | 1.52 | 2.62 |
| trx_undo_assign_low | 1.07 | 0.00 | 1.07 |
| mtr_t::commit | 1.05 | 2.57 | 3.62 |
| mtr_t::Command::execute | 1.01 | 2.42 | 3.43 |
| srv_worker_thread | -1.09 | 9.84 | 8.75 |
| sync_array_wait_event | -1.29 | 9.69 | 8.40 |
| trx_write_serialisation_history | -1.34 | 2.62 | 1.28 |
| trx_commit_low | -1.39 | 3.15 | 1.76 |
| innobase_commit | -1.75 | 47.36 | 45.61 |
| trx_commit | -1.75 | 4.79 | 3.04 |
| ha_commit_one_phase | -1.76 | 47.55 | 45.78 |
| commit_one_phase_2 | -1.76 | 47.54 | 45.77 |
| trans_commit_stmt | -1.80 | 48.68 | 46.88 |
| ha_commit_trans | -1.80 | 48.65 | 46.84 |
| btr_cur_search_to_nth_level | -1.85 | 1.85 | 0.00 |
| innobase_commit_ordered_2 | -2.04 | 5.17 | 3.13 |
| trx_commit_for_mysql | -2.05 | 5.10 | 3.05 |
| innobase_commit_low | -2.05 | 5.11 | 3.06 |
| Prepared_statement::execute_loop | -2.05 | 74.58 | 72.52 |
| mysql_stmt_execute_common | -2.14 | 74.85 | 72.71 |
| mysqld_stmt_execute | -2.15 | 74.89 | 72.74 |
| mysql_execute_command | -2.21 | 73.03 | 70.81 |
| trx_undo_assign_undo | -2.24 | 2.24 | 0.00 |
| Prepared_statement::execute | -2.24 | 74.03 | 71.79 |
| threadpool_process_request | -2.32 | 81.71 | 79.38 |
| dispatch_command | -2.33 | 79.21 | 76.88 |
| do_command | -2.34 | 81.33 | 79.00 |
| tp_callback | -2.38 | 82.66 | 80.28 |
| srv_resume_thread | -3.33 | 7.94 | 4.61 |
| os_event::wait_low | -4.98 | 28.41 | 23.43 |
| SleepConditionVariableCS | -5.41 | 28.70 | 23.29 |
| TTASEventMutex<GenericPolicy>::enter | -30.49 | 30.49 | 0.00 |
Attachments


Issue Links
- blocks
-
-
- Closed
-
-
-
- Closed
-
- is caused by
-
MDEV-12288 Reset DB_TRX_ID when the history is removed, to speed up MVCC
-

- Closed
-
- is duplicated by
-
-
- Closed
-
-
-
- Closed
-
- relates to
-
-

- Closed
-
-
-
- Stalled
-
-
-
- Closed
-
-
-
- Closed
-
-
-
- Open
-
-
-
- Closed
-
-
-
- Closed
-
-
-
- Confirmed
-
-
SAMU-322 Loading...
