Details
-
Task
-
Status: Closed (View Workflow)
-
 Major
Major
-
Resolution: Done
Description
We need to benchmark how much slowdown we experience when we add the optimizer trace to the
server.
We would need the comparision for:
1) server without the optimizer trace (current 10.4)
2) server with optimizer trace disabled here. (currently in branch 10.4-mdev6111)
The optimizer trace is currently disabled by default.
Please run sysbench.
Attachments


Issue Links
- is part of
-
-

- Closed
-
- relates to
-
-
- Stalled
-
Activity
| Field | Original Value | New Value |
|---|---|---|
| Description |
We need to benchmark how much slowdown we experience when we add the optimizer trace to the
server. We would need the comparision for: 1) server without the optimizer trace (current 10.4) 2) server with optimizer trace disabled here. (currently in branch 10.4-mdev6111) {code:sql} set optimizer_trace='enabled=off'; {code} |
We need to benchmark how much slowdown we experience when we add the optimizer trace to the
server. We would need the comparision for: 1) server without the optimizer trace (current 10.4) 2) server with optimizer trace disabled here. (currently in branch 10.4-mdev6111) The optimizer trace is currently disabled by default. Please run sysbench. |
| Assignee | Axel Schwenke [ axel ] |
| Affects Version/s | 10.4 [ 22408 ] | |
| Issue Type | Bug [ 1 ] | Task [ 3 ] |
Results are here in the google doc
https://docs.google.com/document/d/11RUOHxXNbUO4oIu4iN9cpdh_mseMVZvAXp77m4kkDNU/edit?usp=sharing
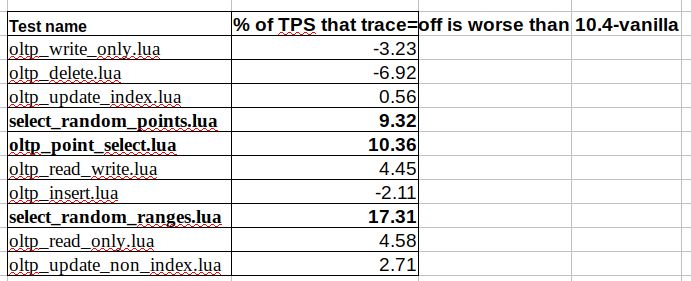
Analyzing the data...
Test name % of TPS that trace=off is worse than 10.4-vanilla
|
oltp_write_only.lua -3.23
|
oltp_delete.lua -6.92
|
oltp_update_index.lua 0.56
|
select_random_points.lua 9.32
|
oltp_point_select.lua 10.36
|
oltp_read_write.lua 4.45
|
oltp_insert.lua -2.11
|
select_random_ranges.lua 17.31
|
oltp_read_only.lua 4.58
|
oltp_update_non_index.lua 2.71
|

| Attachment | image-2019-01-29-17-02-28-197.png [ 47186 ] |
select_random_ranges.lua is 17% worse. According to varun, this is a flaw in the optimizer trace code which can be fixed.
| Attachment | screenshot-1.png [ 47187 ] |
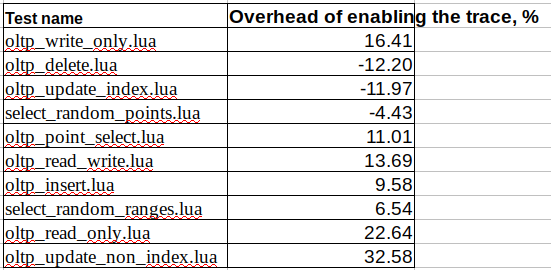
Enabling the trace makes some tests faster? like oltp_delete or oltp_update_index ?
It is also not clear why enabling the trace makes oltp_update_non_index 33% slower, when we dont have tracing for DML statements yet?
| Attachment | mdev18182-analysis.ods [ 47188 ] |
| Assignee | Axel Schwenke [ axel ] | Varun Gupta [ varun ] |
| Status | Open [ 1 ] | In Progress [ 3 ] |
oltp_delete run on my machine. All default settings,
git clone -b 10.4-optimizer_trace git@github.com:MariaDB/server.git 10.4-optimizer-trace;
|
cd 10.4-optimizer-trace;
|
cmake . -DCMAKE_BUILD_TYPE=RelWithDebInfo -DWITHOUT_MROONGA:bool=1 -DWITHOUT_TOKUDB:bool=1 && make -j10
|
(cd mysql-test; ./mtr alias)
|
|
|
git clone 10.4-optimizer-trace 10.4-optimizer-trace-orig
|
cd 10.4-optimizer-trace;
|
git reset --hard 923415ffdb4ce2ef66d53077414abc2845a768e6
|
cmake . -DCMAKE_BUILD_TYPE=RelWithDebInfo -DWITHOUT_MROONGA:bool=1 -DWITHOUT_TOKUDB:bool=1 && make -j10
|
(cd mysql-test; ./mtr alias)
|
sysbench --threads=4 --mysql-socket=/tmp/mysql20.sock \
|
--mysql-user=root --tables=5 --table-size=1000000 \
|
/usr/share/sysbench/oltp_delete.lua prepare
|
|
|
sysbench --threads=3 --events=0 --time=60 --mysql-socket=/tmp/mysql20.sock \
|
--mysql-user=root --tables=5 --table-size=1000000 --range_selects=off \
|
--db-ps-mode=disable --report-interval=1 /usr/share/sysbench/oltp_delete.lua run
|
10.4-optimizer-trace tree:
transactions: 275766 (4595.41 per sec.)
|
10.4-optimizer-trace-orig tree:
transactions: 279959 (4665.76 per sec.)
|
so it was 1.5% slower (on a single run).
A bit of tunning to make it more CPU-bound:
innodb_buffer_pool_size=4G
|
innodb_flush_log_at_trx_commit=0
|
10.4-optimizer-trace-orig:
transactions: 2549706 (42493.02 per sec.)
|
10.4-optimizer-trace:
transactions: 2527543 (42123.71 per sec.)
|
The slowdown is no 0.87%
| Labels | benchmarking |
| Link | This issue relates to MDEV-18822 [ MDEV-18822 ] |
| Attachment | mdev18172-optimizer-trace-benchmark-jun14.ods [ 48214 ] |
mdev18172-optimizer-trace-benchmark-jun14.ods![]() - ran a single threaded benchmark on Intel Core i9 box. Compared "good" branch (just before the trace push) and "bad" branch just after the trace push.
- ran a single threaded benchmark on Intel Core i9 box. Compared "good" branch (just before the trace push) and "bad" branch just after the trace push.
Not very scientific conclusions:
- Trace makes the queries slower
- There's also speed variety across runs, which is greater than the slowdown.
variety in execution speed is not an excuse for adding slowdowns.
Take-aways from discussion with svoj: Profiling with `perf top -p $MYSQLD_PID` shows this:
0,27% mysqld [.] Json_writer_object::Json_writer_object
|
0,23% mysqld [.] Json_writer_object::~Json_writer_object
|
0,17% mysqld [.] Json_writer_object::add
|
0,08% mysqld [.] Json_writer_object::add_table_name
|
0,07% mysqld [.] Json_writer_object::Json_writer_object
|
0,05% mysqld [.] Json_writer_object::add
|
extra load adds up to 0.87%
some time later:
0,25% mysqld [.] Json_writer_object::~Json_writer_object
|
0,25% mysqld [.] Json_writer_object::Json_writer_object
|
0,22% mysqld [.] Json_writer_array::Json_writer_array
|
0,17% mysqld [.] Json_writer_object::add
|
0,12% mysqld [.] Json_writer_array::~Json_writer_array
|
0,09% mysqld [.] Json_writer_object::add_table_name
|
0,07% mysqld [.] Json_writer_object::add
|
0,06% mysqld [.] Json_writer_object::Json_writer_object
|
1.23% in total.
the worlkoad is same as above, sysbench oltp_point_select.lua, 1 thread, 1 table, 100000 records
Trying another metric. Let's count cpu-cycles and instructions it took to run1M queries. The workload is same as above, single-threaded:
perf stat -e cpu-cycles,instructions -p $MYSQLD_PID \
|
sysbench --threads=1 --events=1000000 --time=60 \
|
--mysql-socket=/tmp/mysql4.sock --db-driver=mysql \
|
--mysql-user=root --tables=1 --table-size=100000 \
|
--db-ps-mode=disable --report-interval=1 \
|
/usr/share/sysbench/oltp_point_select.lua run
|
CPU Cycles
Measured %-difference
|
GOOD1 119268709772 0.000
|
GOOD2 119752271354 0.404
|
GOOD2 123604972628 3.508
|
BAD1 124065619931 3.866
|
BAD2 126842976642 5.971
|
BAD3 128390721496 7.105
|
CPU Instructions:
|
Measured %-difference
|
GOOD1 62150155349 0.000
|
GOOD2 62075386099 -0.120
|
GOOD2 62076210080 -0.119
|
BAD1 63453169426 2.054
|
BAD2 63384390710 1.947
|
BAD3 63381281060 1.942
|
Looks like the above are are stabler metric to measure the overhead?
varun, could you try to reproduce the above? Do you get the same #cycles #instructions difference?
Also, perf now shows optimizer trace code. Why weren't Json_writer_array and Json_writer_object ctor/dtor inlined ? (because their code is in .cpp file and not .h file?)
The only tuning I did (except for port# and paths):
datadir=/dev/shm/....
|
innodb_buffer_pool_size=4G
|
| Attachment | Screenshot from 2019-06-17 11-34-59.png [ 48215 ] |
| Attachment | Screenshot from 2019-06-17 11-34-59.png [ 48215 ] |
| Attachment | benchmarks.png [ 48216 ] |
Thinking about the potential overhead that optimizer trace should have...
Measuring the CPU instructions counts from Varun's benchmark , we can see that optimizer trace patch has caused extra 1557 CPU instructions to be executed per query.
Let's assume 10 instructions per "if (optimizer_trace)" check. This means 156 checks are made per query.
Looking at an example trace: https://mariadb.com/kb/en/library/basic-optimizer-trace-example/
one can see 86 (value written + array start + object start) operations and ~50 (array_end + object_end) operations.
This means ~150 "if (optimizer_trace is on)" checks in total, which agrees with the 156 we got above.
(The most arbitrary number is the 10 instructions per check. This looks like a reasonable upper bound, but could one get it lower?)
| Fix Version/s | N/A [ 14700 ] | |
| Fix Version/s | 10.4 [ 22408 ] | |
| Summary | Benchmarking for optimizer trace | Benchmarking 10.4 for optimizer trace |
| Resolution | Done [ 10200 ] | |
| Status | In Progress [ 3 ] | Closed [ 6 ] |
| Workflow | MariaDB v3 [ 91576 ] | MariaDB v4 [ 133811 ] |
Before running the benchmark, please check if branch 10.4-optimizer-trace should be used instead.