Uploaded image for project: 'MariaDB Server'
  1. MariaDB Server
  2. MDEV-18172

Benchmarking 10.4 for optimizer trace

Details

    Description

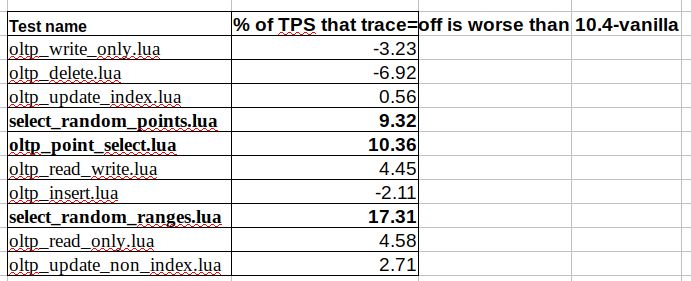
      We need to benchmark how much slowdown we experience when we add the optimizer trace to the
      server.

      We would need the comparision for:
      1) server without the optimizer trace (current 10.4)
      2) server with optimizer trace disabled here. (currently in branch 10.4-mdev6111)

      The optimizer trace is currently disabled by default.
      Please run sysbench.

      Attachments

        Issue Links

          Activity

            Take-aways from discussion with svoj: Profiling with `perf top -p $MYSQLD_PID` shows this:

               0,27%  mysqld  [.] Json_writer_object::Json_writer_object
               0,23%  mysqld  [.] Json_writer_object::~Json_writer_object
               0,17%  mysqld  [.] Json_writer_object::add
               0,08%  mysqld  [.] Json_writer_object::add_table_name
               0,07%  mysqld  [.] Json_writer_object::Json_writer_object 
               0,05%  mysqld  [.] Json_writer_object::add 
            

            extra load adds up to 0.87%

            some time later:

               0,25%  mysqld  [.] Json_writer_object::~Json_writer_object
               0,25%  mysqld  [.] Json_writer_object::Json_writer_object
               0,22%  mysqld  [.] Json_writer_array::Json_writer_array 
               0,17%  mysqld  [.] Json_writer_object::add
               0,12%  mysqld  [.] Json_writer_array::~Json_writer_array 
               0,09%  mysqld  [.] Json_writer_object::add_table_name
               0,07%  mysqld  [.] Json_writer_object::add  
               0,06%  mysqld  [.] Json_writer_object::Json_writer_object 
            

            1.23% in total.

            the worlkoad is same as above, sysbench oltp_point_select.lua, 1 thread, 1 table, 100000 records

            psergei Sergei Petrunia added a comment - Take-aways from discussion with svoj : Profiling with `perf top -p $MYSQLD_PID` shows this: 0,27% mysqld [.] Json_writer_object::Json_writer_object 0,23% mysqld [.] Json_writer_object::~Json_writer_object 0,17% mysqld [.] Json_writer_object::add 0,08% mysqld [.] Json_writer_object::add_table_name 0,07% mysqld [.] Json_writer_object::Json_writer_object 0,05% mysqld [.] Json_writer_object::add extra load adds up to 0.87% some time later: 0,25% mysqld [.] Json_writer_object::~Json_writer_object 0,25% mysqld [.] Json_writer_object::Json_writer_object 0,22% mysqld [.] Json_writer_array::Json_writer_array 0,17% mysqld [.] Json_writer_object::add 0,12% mysqld [.] Json_writer_array::~Json_writer_array 0,09% mysqld [.] Json_writer_object::add_table_name 0,07% mysqld [.] Json_writer_object::add 0,06% mysqld [.] Json_writer_object::Json_writer_object 1.23% in total. the worlkoad is same as above, sysbench oltp_point_select.lua, 1 thread, 1 table, 100000 records

            Trying another metric. Let's count cpu-cycles and instructions it took to run1M queries. The workload is same as above, single-threaded:

            perf stat -e cpu-cycles,instructions -p $MYSQLD_PID \ 
              sysbench --threads=1 --events=1000000 --time=60 \
                       --mysql-socket=/tmp/mysql4.sock   --db-driver=mysql \
                       --mysql-user=root  --tables=1 --table-size=100000 \
                       --db-ps-mode=disable --report-interval=1  \
                       /usr/share/sysbench/oltp_point_select.lua run
            

            CPU Cycles

            	Measured 	%-difference
            GOOD1	119268709772	0.000
            GOOD2	119752271354	0.404
            GOOD2	123604972628	3.508
            BAD1	124065619931	3.866
            BAD2	126842976642	5.971
            BAD3	128390721496	7.105
            

            CPU Instructions:

            		
             	Measured 	%-difference
            GOOD1	62150155349	0.000
            GOOD2	62075386099	-0.120
            GOOD2	62076210080	-0.119
            BAD1	63453169426	2.054
            BAD2	63384390710	1.947
            BAD3	63381281060	1.942
            

            psergei Sergei Petrunia added a comment - Trying another metric. Let's count cpu-cycles and instructions it took to run1M queries. The workload is same as above, single-threaded: perf stat -e cpu-cycles,instructions -p $MYSQLD_PID \ sysbench --threads=1 --events=1000000 --time=60 \ --mysql-socket=/tmp/mysql4.sock --db-driver=mysql \ --mysql-user=root --tables=1 --table-size=100000 \ --db-ps-mode=disable --report-interval=1 \ /usr/share/sysbench/oltp_point_select.lua run CPU Cycles Measured %-difference GOOD1 119268709772 0.000 GOOD2 119752271354 0.404 GOOD2 123604972628 3.508 BAD1 124065619931 3.866 BAD2 126842976642 5.971 BAD3 128390721496 7.105 CPU Instructions: Measured %-difference GOOD1 62150155349 0.000 GOOD2 62075386099 -0.120 GOOD2 62076210080 -0.119 BAD1 63453169426 2.054 BAD2 63384390710 1.947 BAD3 63381281060 1.942

            Looks like the above are are stabler metric to measure the overhead?
            varun, could you try to reproduce the above? Do you get the same #cycles #instructions difference?

            Also, perf now shows optimizer trace code. Why weren't Json_writer_array and Json_writer_object ctor/dtor inlined ? (because their code is in .cpp file and not .h file?)

            psergei Sergei Petrunia added a comment - Looks like the above are are stabler metric to measure the overhead? varun , could you try to reproduce the above? Do you get the same #cycles #instructions difference? Also, perf now shows optimizer trace code. Why weren't Json_writer_array and Json_writer_object ctor/dtor inlined ? (because their code is in .cpp file and not .h file?)

            The only tuning I did (except for port# and paths):

            datadir=/dev/shm/....
            innodb_buffer_pool_size=4G
            

            psergei Sergei Petrunia added a comment - The only tuning I did (except for port# and paths): datadir=/dev/shm/.... innodb_buffer_pool_size=4G
            psergei Sergei Petrunia added a comment - - edited

            Thinking about the potential overhead that optimizer trace should have...

            Measuring the CPU instructions counts from Varun's benchmark , we can see that optimizer trace patch has caused extra 1557 CPU instructions to be executed per query.
            Let's assume 10 instructions per "if (optimizer_trace)" check. This means 156 checks are made per query.

            Looking at an example trace: https://mariadb.com/kb/en/library/basic-optimizer-trace-example/
            one can see 86 (value written + array start + object start) operations and ~50 (array_end + object_end) operations.

            This means ~150 "if (optimizer_trace is on)" checks in total, which agrees with the 156 we got above.

            (The most arbitrary number is the 10 instructions per check. This looks like a reasonable upper bound, but could one get it lower?)

            psergei Sergei Petrunia added a comment - - edited Thinking about the potential overhead that optimizer trace should have... Measuring the CPU instructions counts from Varun's benchmark , we can see that optimizer trace patch has caused extra 1557 CPU instructions to be executed per query. Let's assume 10 instructions per "if (optimizer_trace)" check. This means 156 checks are made per query. Looking at an example trace: https://mariadb.com/kb/en/library/basic-optimizer-trace-example/ one can see 86 (value written + array start + object start) operations and ~50 (array_end + object_end) operations. This means ~150 "if (optimizer_trace is on)" checks in total, which agrees with the 156 we got above. (The most arbitrary number is the 10 instructions per check. This looks like a reasonable upper bound, but could one get it lower?)

            People

              varun Varun Gupta (Inactive)
              varun Varun Gupta (Inactive)
              Votes:
              1 Vote for this issue
              Watchers:
              5 Start watching this issue

              Dates

                Created:
                Updated:
                Resolved:

                Git Integration

                  Error rendering 'com.xiplink.jira.git.jira_git_plugin:git-issue-webpanel'. Please contact your Jira administrators.