Details
-
Bug
-
Status: Closed (View Workflow)
-
 Critical
-
Resolution: Fixed
-
1.5.7
-
None
Description
Observed a mariadb daemon thread leak when using the Aurora protocol with the cluster endpoint. It appears to happen exactly after 2 hours atleast on every instance that i have been able to reproduce this issue. After 2 hours of runtime, mariadb java client would spawn several mariadb threads causing severe problems including excessive garbage collection on the JVM - Was able to capture atleast 10-15 threads a second all resulting in 10-15 minor collections on the JVM.
The issue is not seen while running against the mysql protocol (even against a Aurora database). Only happens when using the aurora protocol against the Aurora Database (jdbc:mysql:aurora://cluster.cluster-xxxx.us-east-1.rds.amazonaws.com:3306/db).
Sample Thread dumps captured from a JVM that had been in this state for more than 12 hours:
mariaDb-2-117978934" daemon prio=10 tid=0x00007fa14c01b800 nid=0x29b3 runnable [0x0000000000000000]
java.lang.Thread.State: RUNNABLE
Locked ownable synchronizers:
- None
"mariaDb-2-117980090" daemon prio=10 tid=0x00007fa14c01b800 nid=0x2e43 runnable [0x0000000000000000]
java.lang.Thread.State: RUNNABLE
Locked ownable synchronizers:
- None
"mariaDb-2-117980089" daemon prio=10 tid=0x00007fa14c143800 nid=0x2e42 runnable [0x0000000000000000]
java.lang.Thread.State: RUNNABLE
Locked ownable synchronizers:
- None
"mariaDb-2-117981286" daemon prio=10 tid=0x00007fa14c01b800 nid=0x32fd runnable [0x0000000000000000]
java.lang.Thread.State: RUNNABLE
Locked ownable synchronizers:
- None
mariaDb-2-117982489" daemon prio=10 tid=0x00007fa14c01b800 nid=0x37bc runnable [0x0000000000000000]
java.lang.Thread.State: RUNNABLE
Locked ownable synchronizers:
- None
"mariaDb-2-117982488" daemon prio=10 tid=0x00007fa14c176800 nid=0x37bb runnable [0x0000000000000000]
java.lang.Thread.State: RUNNABLE
Locked ownable synchronizers:
- None
"mariaDb-2-117983690" daemon prio=10 tid=0x00007fa14c01b800 nid=0x3c80 runnable [0x0000000000000000]
java.lang.Thread.State: RUNNABLE
Locked ownable synchronizers:
- None
"mariaDb-2-117983689" daemon prio=10 tid=0x00007fa14c143800 nid=0x3c7f runnable [0x0000000000000000]
java.lang.Thread.State: RUNNABLE
Locked ownable synchronizers:
- None
Notice that the daemon threads keep incrementing indefinitely.
Sample Garbage Collection Logs:
64677.059: [GC [PSYoungGen: 86560K->32K(87040K)] 155549K->69021K(227328K), 0.0032420 secs] [Times: user=0.01 sys=0.00, real=0.00 secs]
64677.159: [GC [PSYoungGen: 86560K->64K(87040K)] 155549K->69053K(227328K), 0.0033700 secs] [Times: user=0.00 sys=0.00, real=0.00 secs]
64677.233: [GC [PSYoungGen: 86592K->32K(87040K)] 155581K->69021K(227328K), 0.0037880 secs] [Times: user=0.00 sys=0.00, real=0.00 secs]
64677.298: [GC [PSYoungGen: 86560K->64K(87040K)] 155549K->69053K(227328K), 0.0273960 secs] [Times: user=0.04 sys=0.01, real=0.03 secs]
64677.385: [GC [PSYoungGen: 86592K->64K(87040K)] 155581K->69061K(227328K), 0.0155870 secs] [Times: user=0.02 sys=0.00, real=0.01 secs]
64677.458: [GC [PSYoungGen: 86592K->64K(87040K)] 155589K->69061K(227328K), 0.0032730 secs] [Times: user=0.01 sys=0.00, real=0.00 secs]
64677.517: [GC [PSYoungGen: 86592K->32K(87040K)] 155589K->69029K(227328K), 0.0153590 secs] [Times: user=0.03 sys=0.00, real=0.01 secs]
64677.613: [GC [PSYoungGen: 86560K->32K(87040K)] 155557K->69029K(227328K), 0.0033720 secs] [Times: user=0.00 sys=0.00, real=0.01 secs]
64677.684: [GC [PSYoungGen: 86560K->64K(87040K)] 155557K->69061K(227328K), 0.0113370 secs] [Times: user=0.02 sys=0.01, real=0.01 secs]
64677.747: [GC [PSYoungGen: 86592K->32K(87040K)] 155589K->69029K(227328K), 0.0155070 secs] [Times: user=0.03 sys=0.01, real=0.02 secs]
64677.835: [GC [PSYoungGen: 86560K->32K(87040K)] 155557K->69029K(227328K), 0.0032410 secs] [Times: user=0.01 sys=0.00, real=0.00 secs]
64677.903: [GC [PSYoungGen: 86560K->32K(87040K)] 155557K->69029K(227328K), 0.0263050 secs] [Times: user=0.03 sys=0.00, real=0.03 secs]
64677.989: [GC [PSYoungGen: 86560K->64K(87040K)] 155557K->69061K(227328K), 0.0032160 secs] [Times: user=0.00 sys=0.00, real=0.00 secs]
64678.052: [GC [PSYoungGen: 86592K->32K(87040K)] 155589K->69029K(227328K), 0.0036990 secs] [Times: user=0.00 sys=0.00, real=0.01 secs]
64678.112: [GC [PSYoungGen: 86560K->32K(87040K)] 155557K->69029K(227328K), 0.0193080 secs] [Times: user=0.02 sys=0.00, real=0.02 secs]
64678.183: [GC [PSYoungGen: 86560K->64K(87040K)] 155557K->69061K(227328K), 0.0029340 secs] [Times: user=0.01 sys=0.00, real=0.00 secs]
64678.258: [GC [PSYoungGen: 86592K->64K(87040K)] 155589K->69061K(227328K), 0.0275680 secs] [Times: user=0.02 sys=0.01, real=0.03 secs]
64678.340: [GC [PSYoungGen: 86592K->64K(87040K)] 155589K->69061K(227328K), 0.0265170 secs] [Times: user=0.04 sys=0.00, real=0.03 secs]
64678.451: [GC [PSYoungGen: 86592K->64K(87040K)] 155589K->69069K(227328K), 0.0033880 secs] [Times: user=0.00 sys=0.00, real=0.01 secs]
64678.506: [GC [PSYoungGen: 86592K->64K(87040K)] 155597K->69069K(227328K), 0.0305550 secs] [Times: user=0.03 sys=0.01, real=0.03 secs]
64678.585: [GC [PSYoungGen: 86592K->32K(87040K)] 155597K->69037K(227328K), 0.0033300 secs] [Times: user=0.01 sys=0.00, real=0.00 secs]
64678.669: [GC [PSYoungGen: 86560K->64K(87040K)] 155565K->69069K(227328K), 0.0032000 secs] [Times: user=0.01 sys=0.00, real=0.00 secs]
64678.732: [GC [PSYoungGen: 86592K->64K(87040K)] 155597K->69069K(227328K), 0.0191150 secs] [Times: user=0.01 sys=0.00, real=0.02 secs]
64678.807: [GC [PSYoungGen: 86592K->32K(87040K)] 155597K->69037K(227328K), 0.0033350 secs] [Times: user=0.00 sys=0.00, real=0.00 secs]
64678.895: [GC [PSYoungGen: 86560K->64K(87040K)] 155565K->69069K(227328K), 0.0033410 secs] [Times: user=0.00 sys=0.00, real=0.00 secs]
64678.991: [GC [PSYoungGen: 86592K->32K(87040K)] 155597K->69037K(227328K), 0.0032990 secs] [Times: user=0.01 sys=0.00, real=0.01 secs]
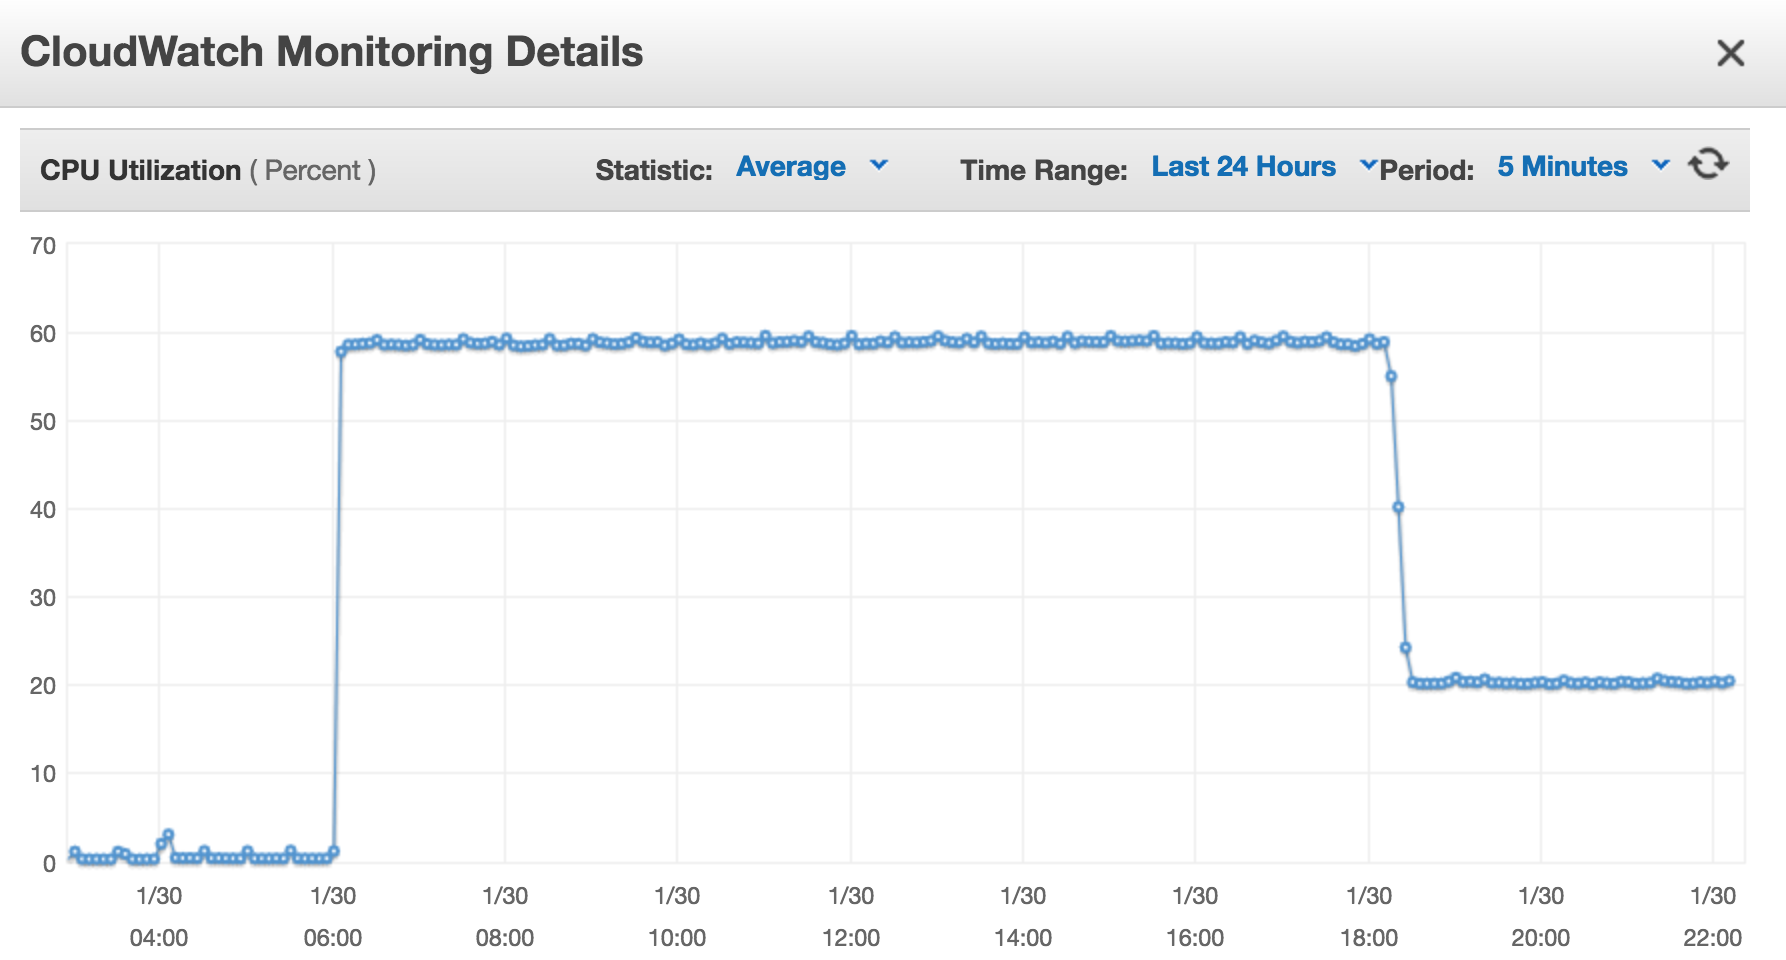
Please find attached cpu snapshots from 2 different application servers where you could see garbage collection causing cpu spikes exactly after 2 hours of uptime (servers started at 04.00 UTC and the spikes start at 06:00 UTC).