Details
-
Bug
-
Status: Closed (View Workflow)
-
 Critical
-
Resolution: Fixed
-
10.2.10, 10.6.19
-
Centos 7.9 X86_64
-
Related to performance
-
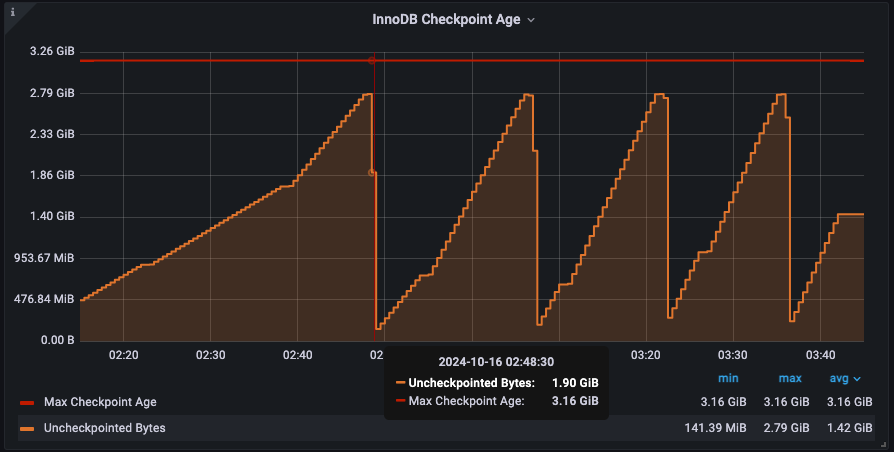
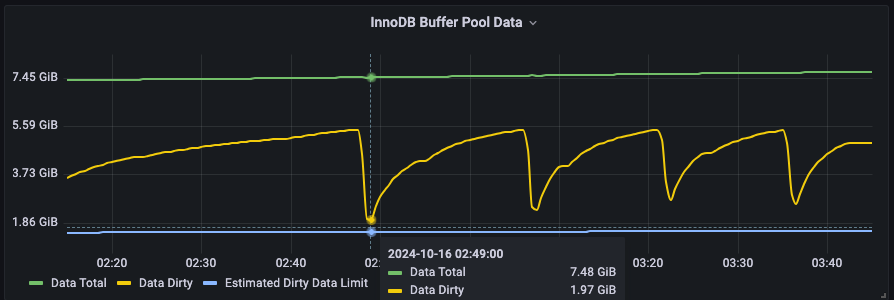
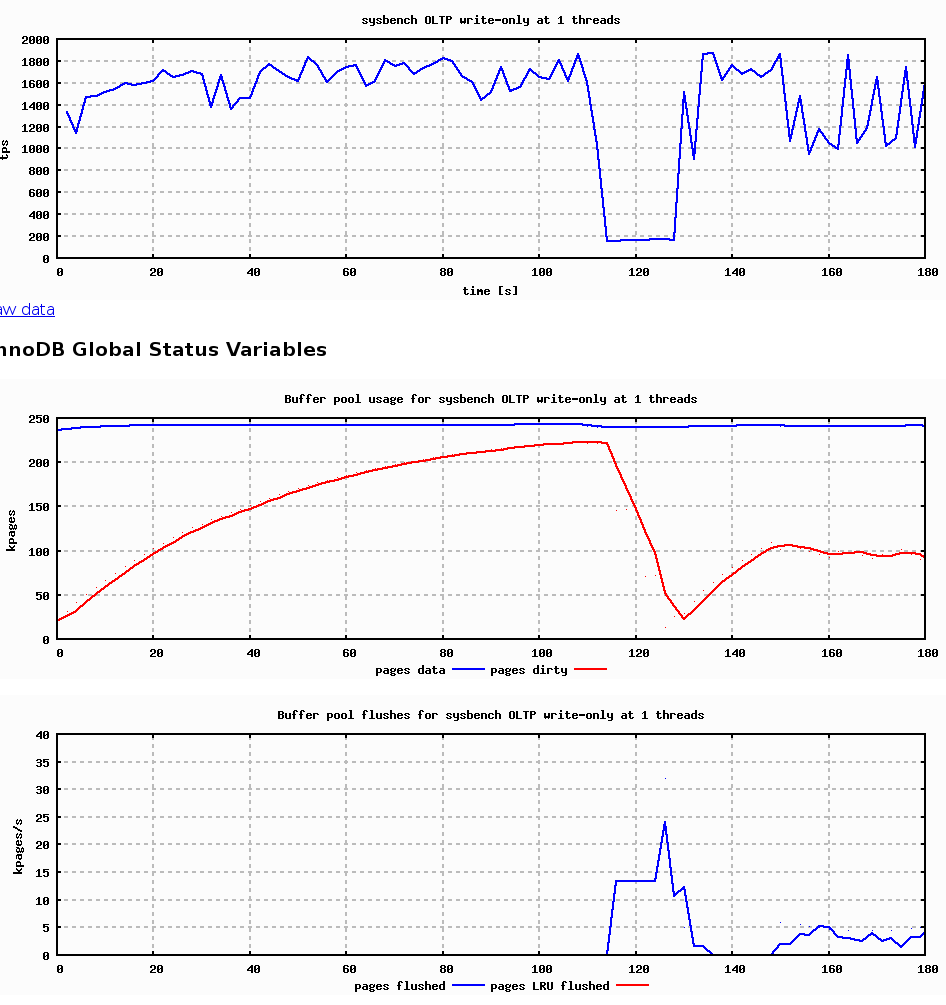
Workloads that are bound by innodb_log_file_size would write out unnecessarily many data pages in an attempt to advance the log checkpoint.
-
Q3/2025 Maintenance, Q4/2025 Server Development
Description
I plan to migrate our MariaDB instances from `10.2.10` to `10.6.19`, and have run some performance benchmarks. And I observed performance is not stable compared to `10.2.10`, especially for in-memory workload.
Here is my test setup.
Test tool: sysbench 1.0.X
OS: CentOS 7.9 X86_64
MariaDB version: 10.2.10 10.6.19
Dataset: create 10 tables and each with 5M rows, each table ~ 1.2GB, the total size is ~ 12GB
Almost all config options are the same, except I removed some options which is deprecated/removed in 10.6, e.g. `innodb_buffer_pool_instances`, `innodb_page_cleaners`,`innodb-thread-concurrency`,`innodb_checksum_algorithm` etc.
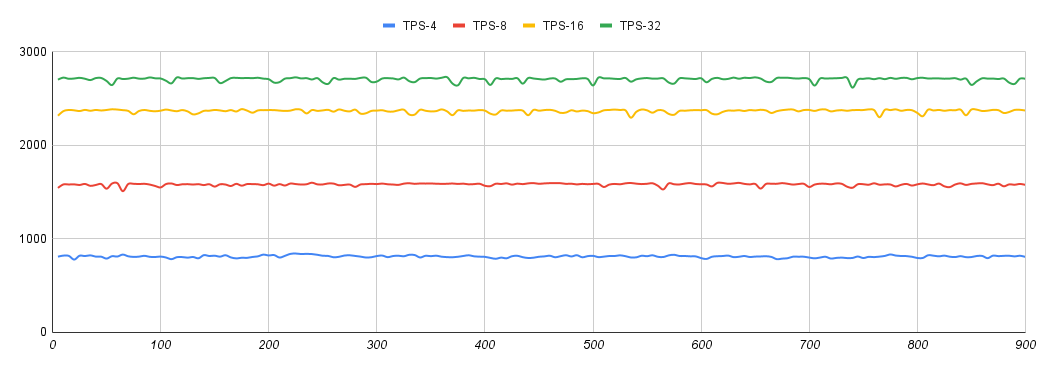
Test 1.
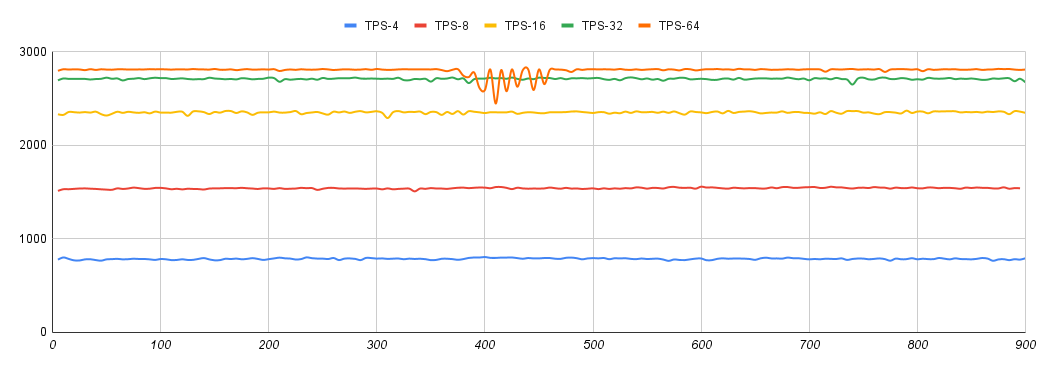
In-memory workset, with `innodb_buffer_pool_size`=188GB
> NOTE:
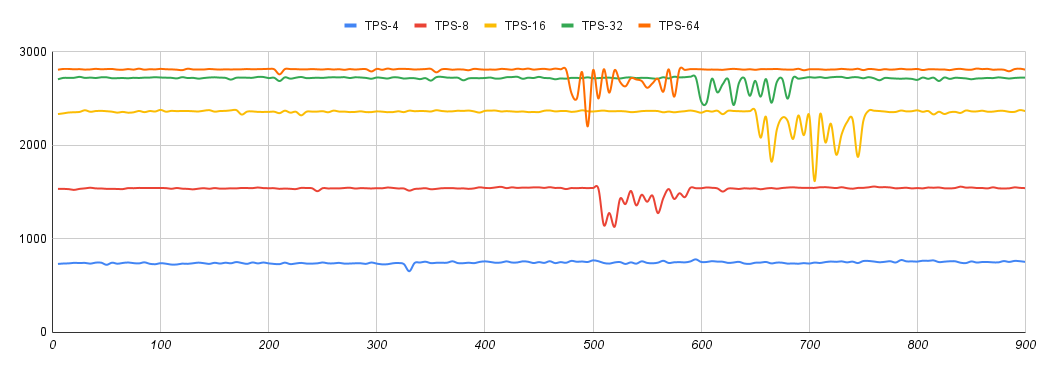
> TPS-X means using X threads run sysbench `oltp_read_write.lua` test
10.2.10
10.6.19
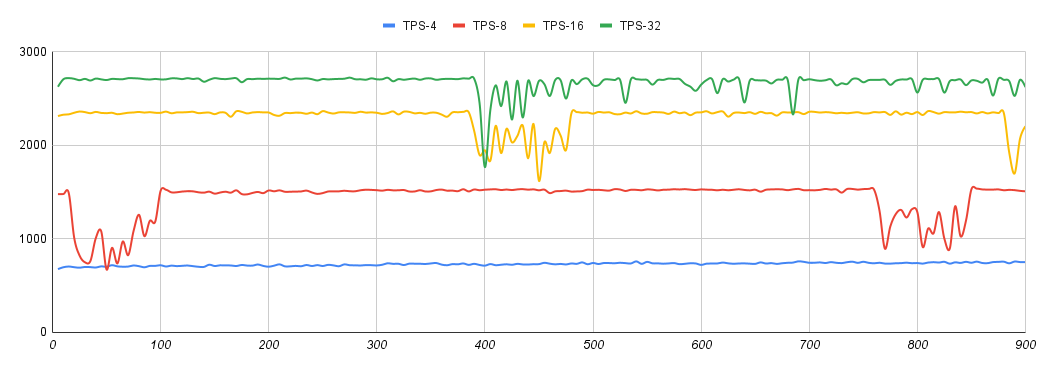
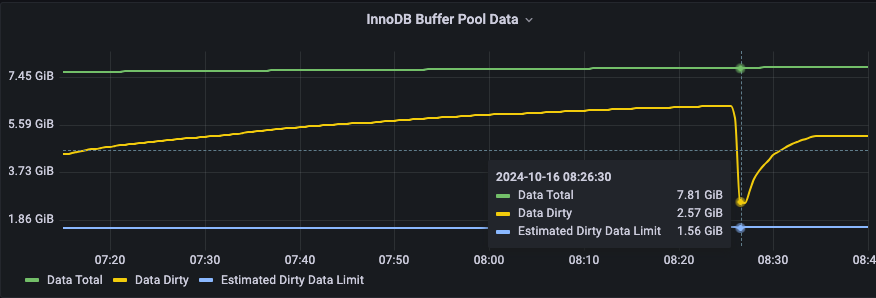
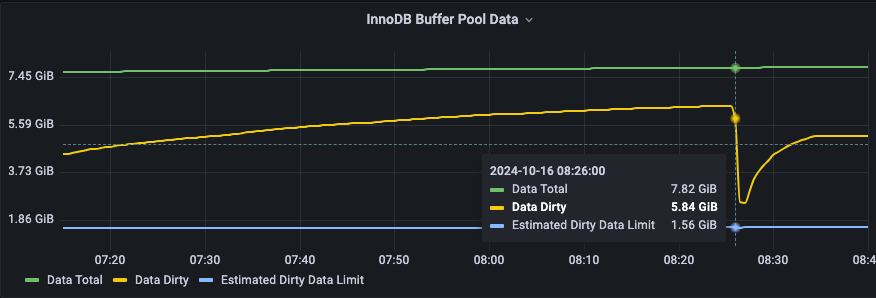
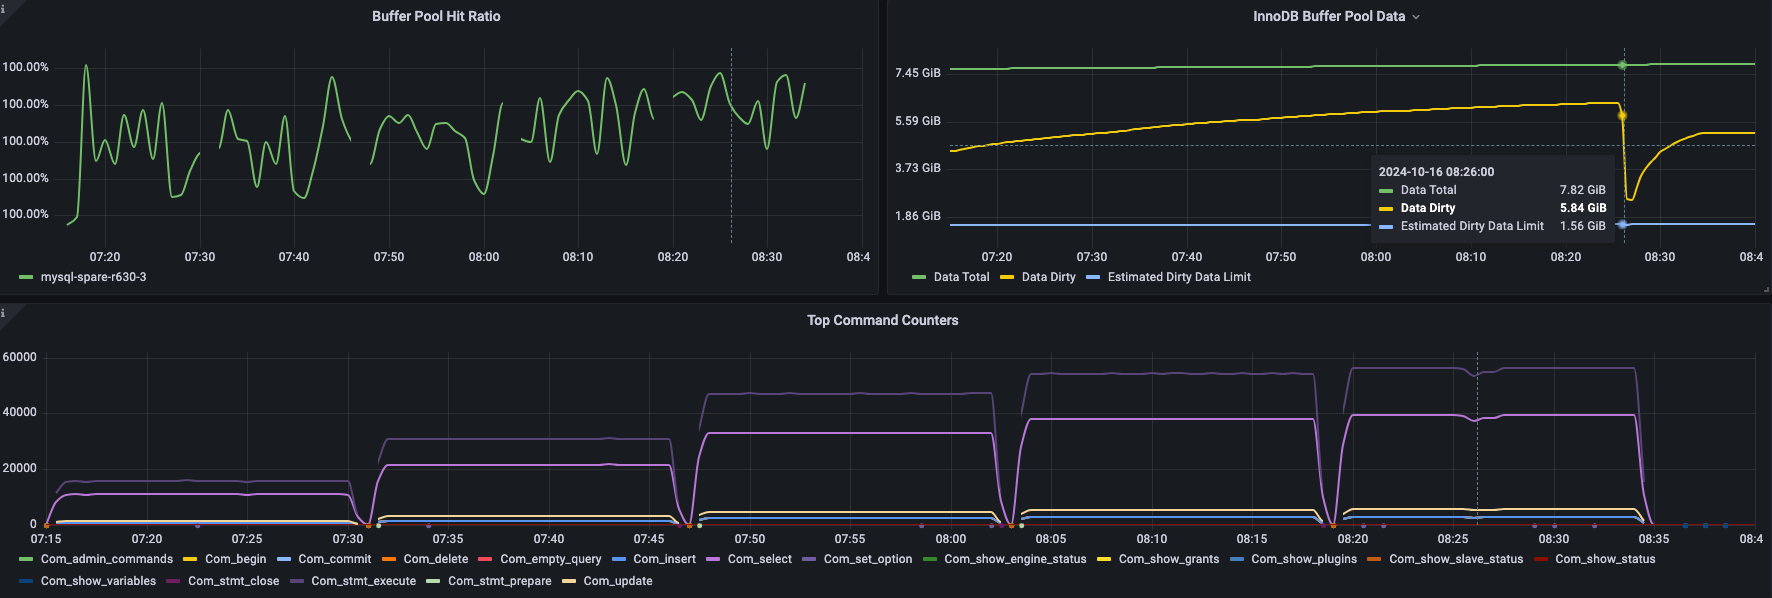
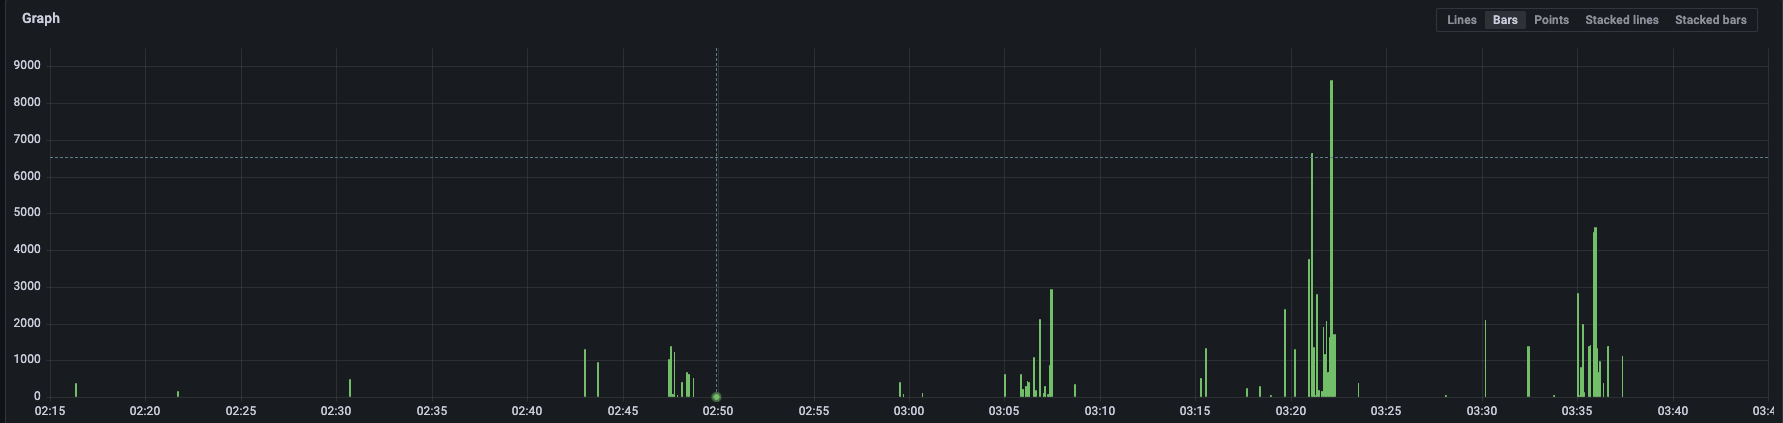
We can see there are performance drops periodically with version `10.6.19`. The `10.6.19` can keep stable only in `4` threads case, while `10.2.10` 's performance is always stable with threads `4, 8, 16, and 32`.
Test 2:
Disk io bund test with `innodb_buffer_pool_size=2G`
10.2.10

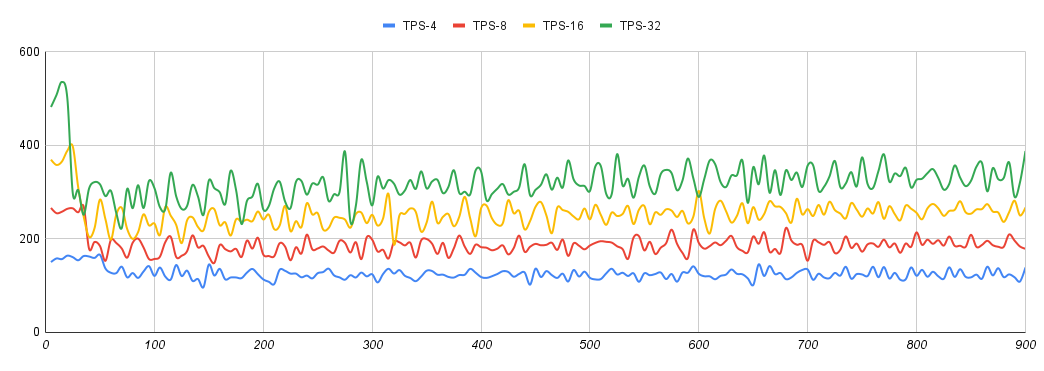
10.6.19
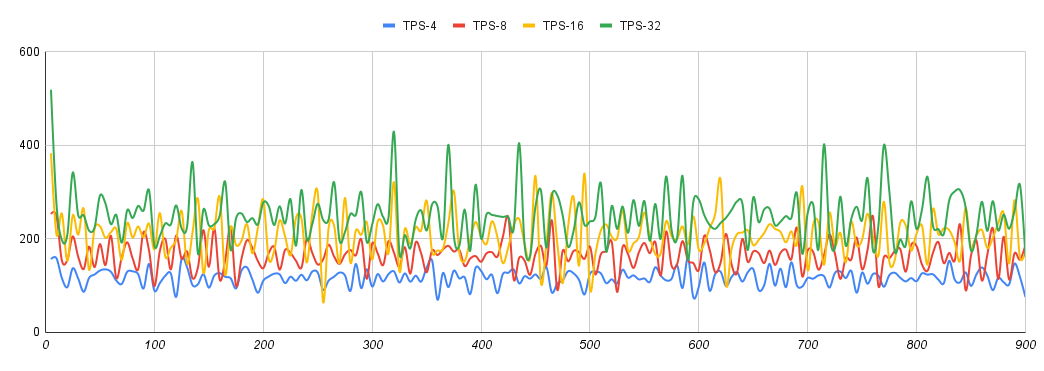
you can see `10.2.10` is also more stable compared to `10.6.19`.
Attachments


Issue Links
- causes
-
-

- Closed
-
- is blocked by
-
-
- Closed
-
-
-
- Closed
-
- relates to
-
-
- Stalled
-
-
MDEV-37924 buf_pool.mutex contention under I/O-limited OLTP workload
-
- In Progress
-
-
-

- Closed
-
-
SAMU-322 Loading...
-
