Details
-
Epic
-
Status: Open (View Workflow)
-
Major
-
Resolution: Unresolved
-
Stored Routine Performance
Description
The benchmark decribed here has been locally reproduced with similar results.
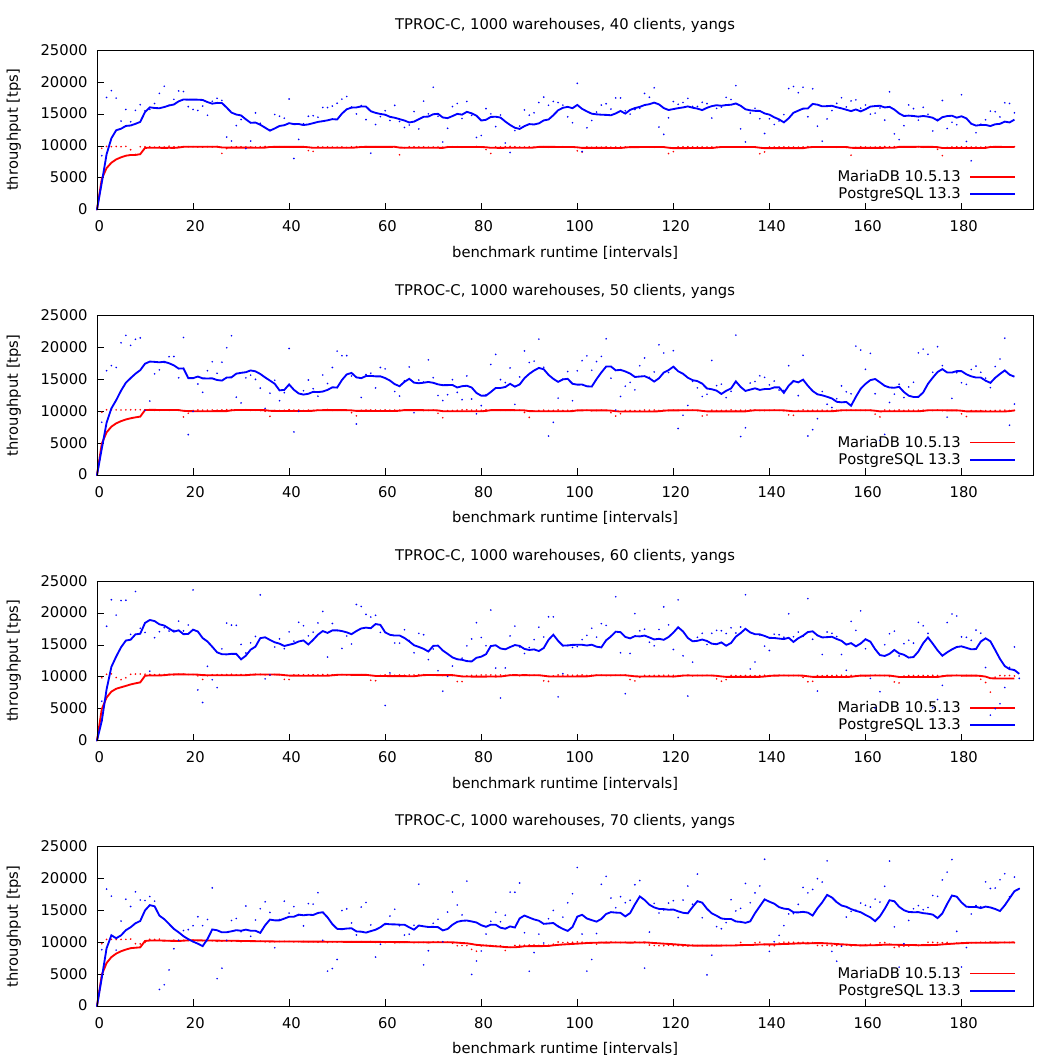
A flamegraph for the server (taken at 40 client TPROC-C workload) shows high activity for table open/close and parser/lexer operations. See attached mariadb.svg
Attachments
Issue Links
- relates to
-
MDEV-30889 Memory leak issues with MariaDB 10.6.12 and OOM Crashes
-
- Confirmed
-
Activity
Field | Original Value | New Value |
---|---|---|
Assignee | Sergei Golubchik [ serg ] |
Fix Version/s | 10.5 [ 23123 ] |
Fix Version/s | 10.6 [ 24028 ] | |
Fix Version/s | 10.7 [ 24805 ] |
Link | This issue relates to PERF-120 [ PERF-120 ] |
Attachment | sysbench-tpcc.nonprepared.svg [ 62113 ] | |
Attachment | sysbench-tpcc.prepared.svg [ 62114 ] |
Epic Child |
|
Fix Version/s | 10.7 [ 24805 ] |
Link | This issue relates to MDEV-30889 [ MDEV-30889 ] |
Attached two more flame graphs:
in numbers: ~6800 tps prepared and ~6200 tps non-prepared. The default is prepared.