Details
-
Bug
-
Status: Closed (View Workflow)
-
 Critical
-
Resolution: Fixed
-
10.6, 10.7(EOL)
Description
Users can configure the number of purge threads to use.
Currently, the existing logic looks at the increasing history length and accordingly increases the purge threads (respecting the user-set threshold). User active user workload causes history length to increase that, in turn, leads to more purge threads to get scheduled.
Purge operation generates redo-records in addition to user workload redo-records. This dual redo generations cause intense pressure on redo-log which can easily cause redo-log to hit the threshold and there-by-causing jitter in overall throughput (including furious flushing).
In order to improve the user workload performance and it is important to ensure background activity like a purge is not overdone while ensuring history length is kept in check to avoid an increase in select latency.
The proposed patch explores an adaptive purge thread scheduling approach based on the redo log fill factor. Logic tends to dynamically increase or decrease the purge threads based on how much redo log is filled, leaving enough space/resources/flush bandwidth for the user workload.
Testing done so far has revealed quite encouraging results especially with slower disk where-in flush is unable to catch up with redo log generation rate. Increasing in history length doesn't tend to have a regressing effect on the queries.
Attachments
Issue Links
- is blocked by
-
-
- Closed
-
- relates to
-
MDEV-21751 innodb_fast_shutdown=0 can be unnecessarily slow
-

- Closed
-
-
-
- Closed
-
-
-
- Closed
-
-
MDEV-16260 Scale the purge effort according to the workload
-
- Open
-
-
-
- Closed
-
-
-
- Closed
-
Activity
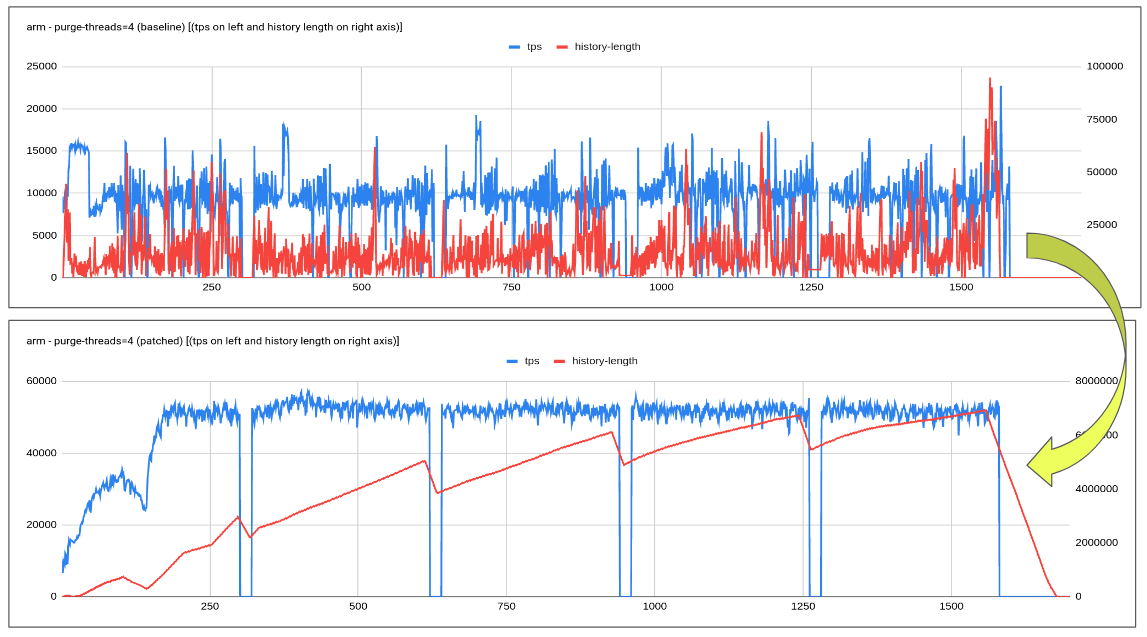
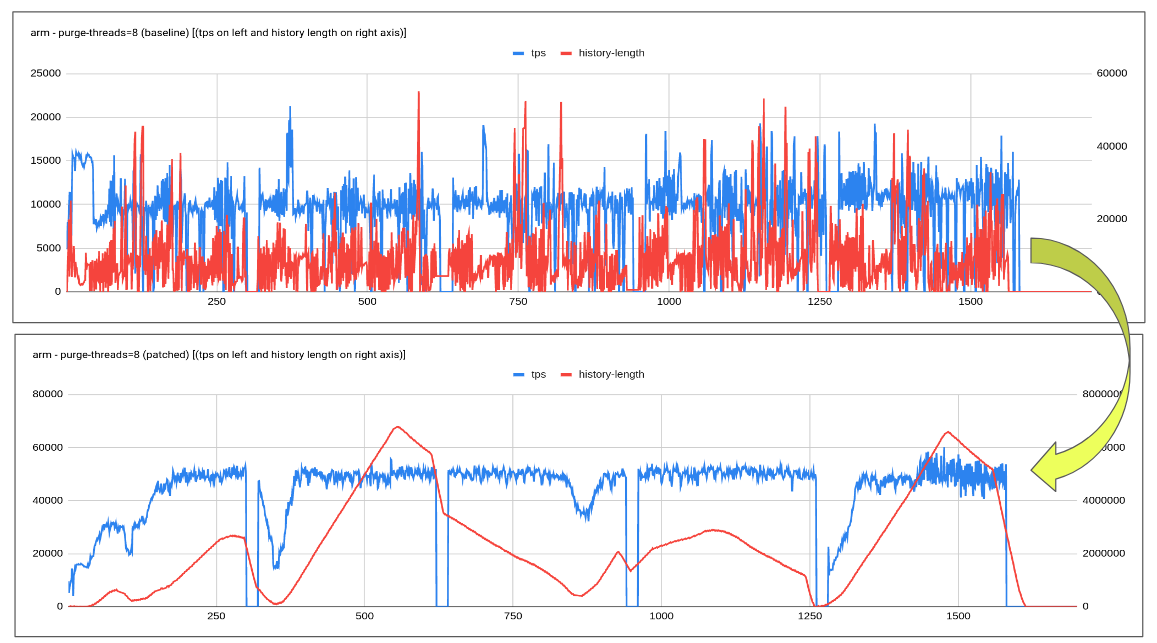
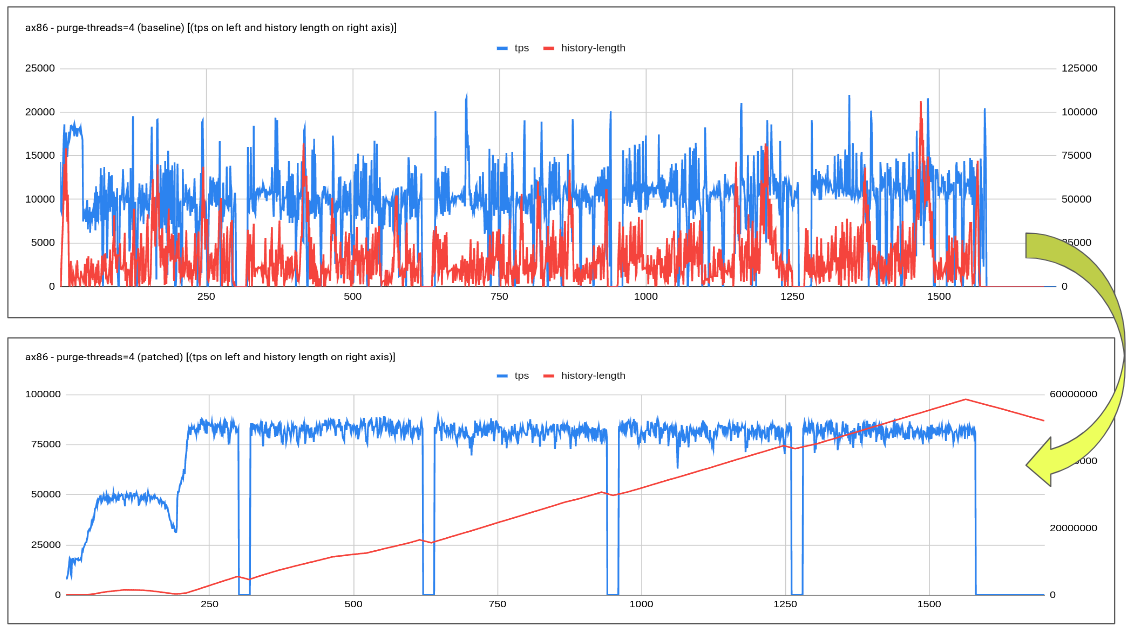
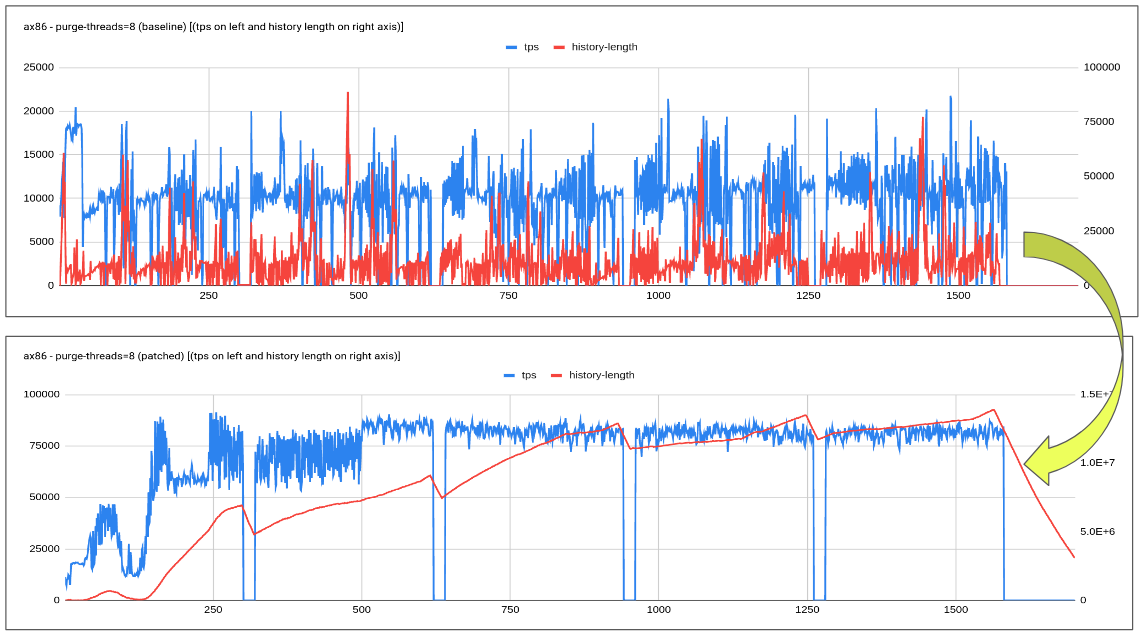
Check the attached graph for the details on how the patch helps slow disk case.
1. slow disk represents a case when flush is unable to catch up with redo log generation there-by causing flush storm or furious flush.
2. this could be eased by limiting the redo log generated by the background purge operation. Note: purge is not blocked or paused it just controlled to ensure user-workload continue to make progress and get priority ensuring keeping a close tab on history length.
As we could see from the graph above not only the performance stabilizes it also helps improve the performance by 2-2.5x. Visible user workload improvement with less jitter and controlled history length increase.
I think that this must be treated as a bug in 10.6, to avoid an apparent performance regression after the fix of MDEV-24258. If the purge activity is not throttled based on the buffer pool or redo log capacity, purge tasks can reduce the overall system throughput.
Marko,
I don't foresee this has anything to do with dict_sys mutex removal as the new heading points it to.
Issue of purge causing the redo generating there-by affecting the user workload is what is being addressed.
krunalbauskar, you are right that this optimization is meaningful independently of MDEV-24258. What I observed in my limited performance testing so far is that when the adaptive purge scheduling is present, the purge throttling work-around to counter the performance regression is no longer needed.
The change of the title documents why we would want to apply this change already in the 10.6 GA release series, instead of handling this as a performance enhancement in 10.7.
It might be useful to additionally throttle the purge activity based on buffer pool contention (buf_pool.LRU eviction rate). But, because of MDEV-20301 delaying the purge could cause even more LRU eviction, given that in the worst case, MVCC or implicit lock checks will involve a primary key lookup and undo log traversal for each visited secondary index record.
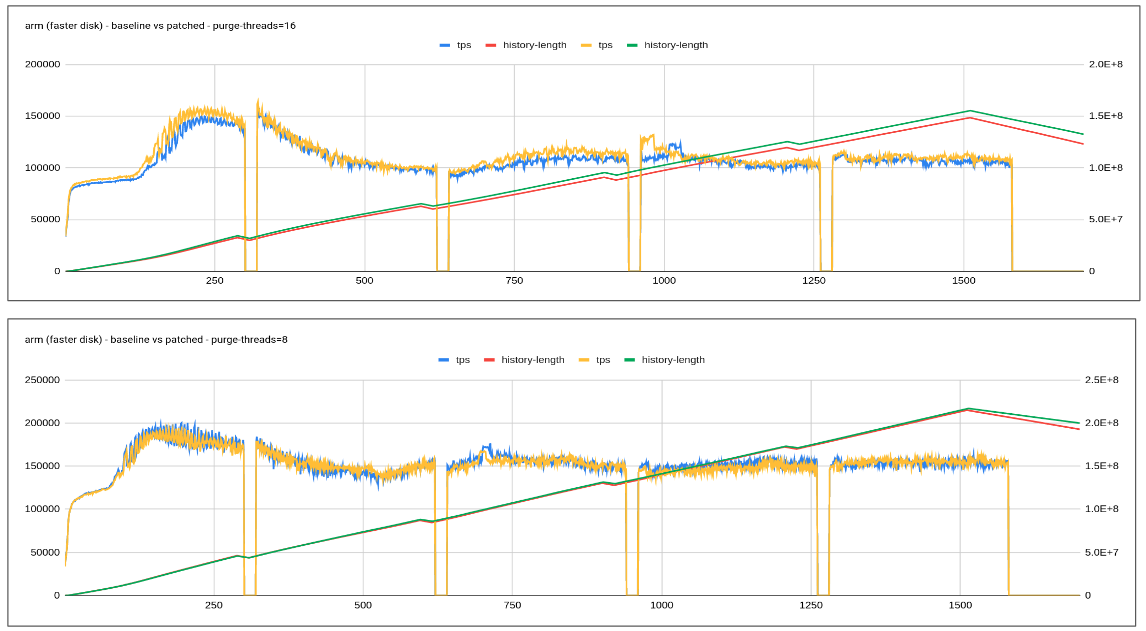
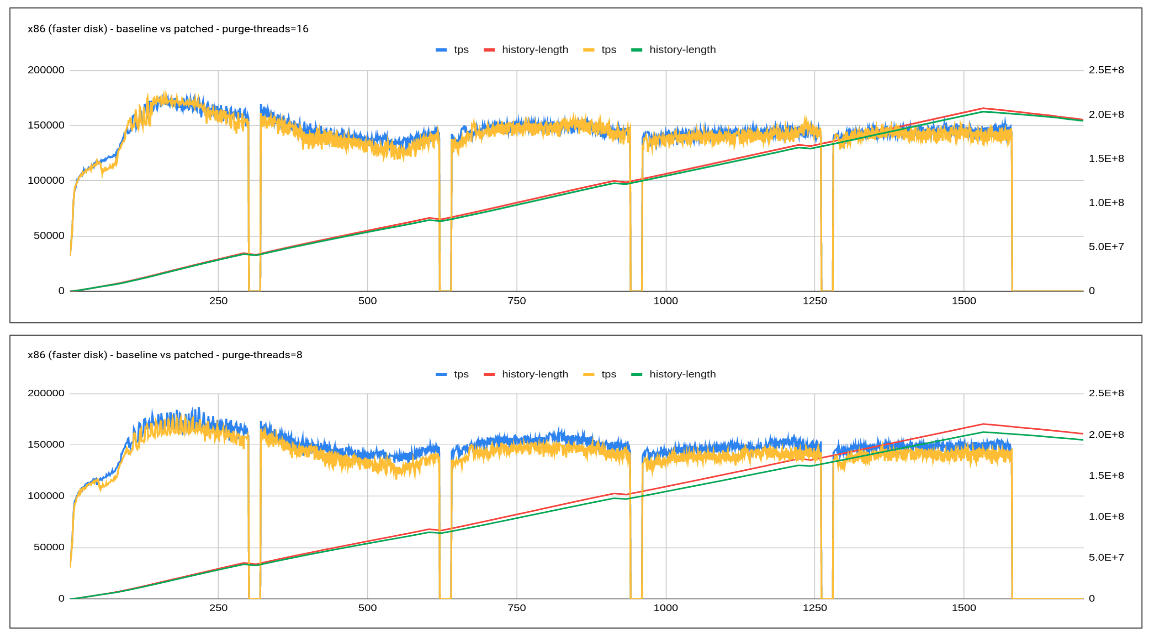
1. Base purge framework was simplified and the patch of the adaptive purge was then applied over and above it. All that development is now being tracked under bb-10.6-MDEV-26356.
2. I tested this new branch with adaptive purge enabled with 4/8/16 purge thread and found the adaptive purge is working as expected.
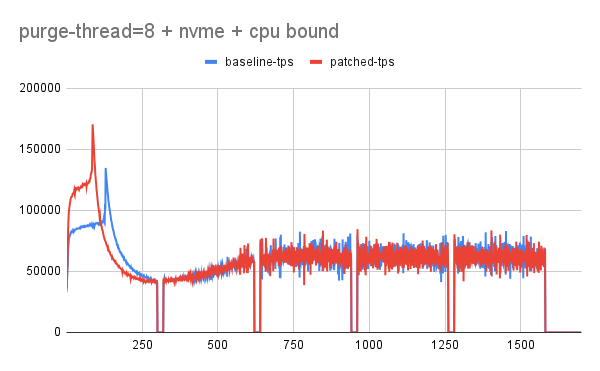
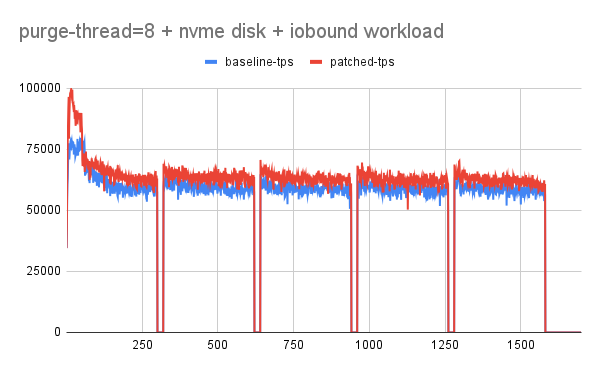
please check "purge-thread=8 + nvme disk + [cpu|io-bound]"
I tried the baseline and the patched branch with nvme disk and here are my observation
1. for cpu-bound there is no change in tps. (expected)
2. for io-bound, patched version has slightly better tps.
Note: in both cases we didn't hit the redo-log contention that would show the real effect of purge given disk was nvme and redo-log-size=20G (with data-size=70 and buffer-pool=80G/35G).
krunalbauskar, thank you.
I ran some more tests locally. On a SATA SSD misconfigured with too high innodb_io_capacity, using 40G buffer pool and 40G of data, this patch reduced the number of 5-second intervals with 0tps. The results are somewhat random, probably due to ‘furious flushing’ related to checkpointing. But, my general impression is that this does improve or stabilize performance.
I will run one more comparison with the NVMe storage to get a more complete picture.
After running oltp_update_non_index all day with different configurations, I can confirm that this seems to be an improvement. I observed an occasional regression (see adaptive_purge.tar.gz![]() for the raw data and the script, and adaptive_purge.gnumeric
for the raw data and the script, and adaptive_purge.gnumeric![]() for the throughput numbers), but that can be due to our page flushing or badly set configuration parameters. I used the same innodb_io_capacity also for the SSD, which was clearly wrong.
for the throughput numbers), but that can be due to our page flushing or badly set configuration parameters. I used the same innodb_io_capacity also for the SSD, which was clearly wrong.
On both the SATA SSD and the NVMe, this patch seems to reduce the amount or duration of throughput dips.
There were 2 tests hanging in wait_all_purged.inc. I tracked it down to the following code:
else if (n_use_threads == 1 && lsn_age_factor >= 100 - safety_net) |
{
|
wakeup= true; |
break; |
}
|
That is, if we consider the log to be too full, we will skip purge forever.
It turns out that we sometimes failed to advance the log checkpoint even if the buffer pool was clean (MDEV-26626). I suppose that this could occur when LRU flushing removes the last dirty page, or when a page write that was initiated during a previous batch completes before the next batch is initiated.
Before the break statement above, we might want to initiate a page flush. For now, I did not change that, to avoid the need to run extensive performance tests again. Instead, I patched the innodb_max_purge_lag_wait logic so that the innodb_gis.rtree_compress test would not time out.
While analyzing MDEV-32050, I found that this throttling logic may effectively reintroduce MDEV-21751, that is, a shutdown with innodb_fast_shutdown=0 will only keep one CPU busy while purging the history of committed transactions.
I reran bench.sh from adaptive_purge.tar.gz![]() on the SATA SSD, with innodb_log_file_size=10g and innodb_buffer_pool_size=40g (and 12GiB of data files). The previous run should correspond to the file patched-ssd40.txt inside the archive. In adaptive_purge.gnumeric
on the SATA SSD, with innodb_log_file_size=10g and innodb_buffer_pool_size=40g (and 12GiB of data files). The previous run should correspond to the file patched-ssd40.txt inside the archive. In adaptive_purge.gnumeric![]() I think that this corresponds to the tab "SSD 40G/40G". In that data, we can see a few 5-second intervals where the throughput dropped to 0, both for the baseline and the originally tested patch.
I think that this corresponds to the tab "SSD 40G/40G". In that data, we can see a few 5-second intervals where the throughput dropped to 0, both for the baseline and the originally tested patch.
With my experimental revert in MDEV-32050, I see no intervals of 0tps, but the average and maximum throughput were in the worst case dropping to half, in the best case doubled. It is possible that MDEV-26827 and MDEV-26055 as well as the other changes in MDEV-32050 have contributed to this. I attached the raw log from this experiment as patched2-ssd40.txt![]() .
.
During the 1-hour test run (most time being spent in a sequential load of data), the 10GiB redo log was overwritten more than 7 times (the LSN grew to 73G):
2023-09-27 16:06:24 0 [Note] /dev/shm/10.6g/sql/mariadbd: ready for connections.
|
Version: '10.6.16-MariaDB' socket: '/mnt/sbtest/mysqld.sock' port: 3306 Source distribution
|
2023-09-27 17:06:47 0 [Note] /dev/shm/10.6g/sql/mariadbd (initiated by: root[root] @ localhost []): Normal shutdown
|
2023-09-27 17:06:47 0 [Note] InnoDB: FTS optimize thread exiting.
|
2023-09-27 17:06:47 0 [Note] InnoDB: to purge 26366271 transactions
|
2023-09-27 17:12:19 0 [Note] InnoDB: Starting shutdown...
|
2023-09-27 17:12:19 0 [Note] InnoDB: Dumping buffer pool(s) to /mnt/sbtest/ib_buffer_pool
|
2023-09-27 17:12:19 0 [Note] InnoDB: Buffer pool(s) dump completed at 230927 17:12:19
|
2023-09-27 17:12:19 0 [Note] InnoDB: Removed temporary tablespace data file: "./ibtmp1"
|
2023-09-27 17:12:19 0 [Note] InnoDB: Shutdown completed; log sequence number 73559731602; transaction id 173642215
|
2023-09-27 17:12:19 0 [Note] /dev/shm/10.6g/sql/mariadbd: Shutdown complete
|
This is clearly a misconfigured (on purpose) system; the innodb_log_file_size should be large enough to accommodate 1 or 2 hours of writes.
I repeated the experiment with innodb_log_file_size=80g; the raw data is in patched2-ssd40-80.txt![]() . Now the history during the workload would grow 5×, to 110794627 transactions, and also the size of the data directory (excluding the redo log) would grow from 12GiB to 47GiB. The slow shutdown reached a history size of 47105527 in about 18½ minutes. Only about 1½ CPUs are busy; the workload is I/O bound because the 47GiB of data exceeds the buffer pool size of 40GiB.
. Now the history during the workload would grow 5×, to 110794627 transactions, and also the size of the data directory (excluding the redo log) would grow from 12GiB to 47GiB. The slow shutdown reached a history size of 47105527 in about 18½ minutes. Only about 1½ CPUs are busy; the workload is I/O bound because the 47GiB of data exceeds the buffer pool size of 40GiB.
I think that better performance could be achieved by not setting innodb_max_dirty_pages_pct_lwm=10 or touching the LRU parameters, and perhaps setting innodb_purge_threads=32. After all, we are testing with 10, 20, 40, 80, and 160 concurrent writer connections.
I did one more run, with 40GiB buffer pool, 80GiB log, no flushing related parameters. I intended this to employ 32 purge threads, hence the file name for the raw data: patched2-ssd40-80-32.txt![]() . But, it in fact was the same default innodb_purge_threads=4, because the script had passed the parameter twice.
. But, it in fact was the same default innodb_purge_threads=4, because the script had passed the parameter twice.
This time, the history list grew to 89 million transactions, and the slow shutdown took almost 25 minutes:
2023-09-27 19:27:25 0 [Note] /dev/shm/10.6g/sql/mariadbd: ready for connections.
|
Version: '10.6.16-MariaDB' socket: '/mnt/sbtest/mysqld.sock' port: 3306 Source distribution
|
2023-09-27 20:24:17 0 [Note] /dev/shm/10.6g/sql/mariadbd (initiated by: root[root] @ localhost []): Normal shutdown
|
2023-09-27 20:24:17 0 [Note] InnoDB: FTS optimize thread exiting.
|
2023-09-27 20:24:17 0 [Note] InnoDB: to purge 89374144 transactions
|
2023-09-27 20:49:08 0 [Note] InnoDB: Starting shutdown...
|
2023-09-27 20:49:08 0 [Note] InnoDB: Dumping buffer pool(s) to /mnt/sbtest/ib_buffer_pool
|
2023-09-27 20:49:09 0 [Note] InnoDB: Buffer pool(s) dump completed at 230927 20:49:09
|
2023-09-27 20:49:09 0 [Note] InnoDB: Removed temporary tablespace data file: "./ibtmp1"
|
2023-09-27 20:49:09 0 [Note] InnoDB: Shutdown completed; log sequence number 110644210169; transaction id 359504570
|
2023-09-27 20:49:09 0 [Note] /dev/shm/10.6g/sql/mariadbd: Shutdown complete
|
The slow shutdown (which automatically switches to the maximum innodb_purge_threads=32) fully employed only about 1.7 CPU cores. I checked some perf record while it was running, and I noticed that quite some CPU time was being spent on table lookup. Maybe each purge task should maintain a larger local cache that maps table ID to table pointers. Eviction would be prevented by reference counts. This test uses 100 tables of 1½ million rows each.
Unlike my test in MDEV-32050, this test oltp_update_non_index should not involve any bottleneck due to secondary indexes (to be fixed by MDEV-17598).
In MDEV-32050, I confirmed that this bottleneck is related to table lookups. Up to 32 tables being modified in the test is no problem.
PR created: https://github.com/MariaDB/server/pull/1889