Details
-
Task
-
Status: Closed (View Workflow)
-
 Major
Major
-
Resolution: Fixed
-
None
Description
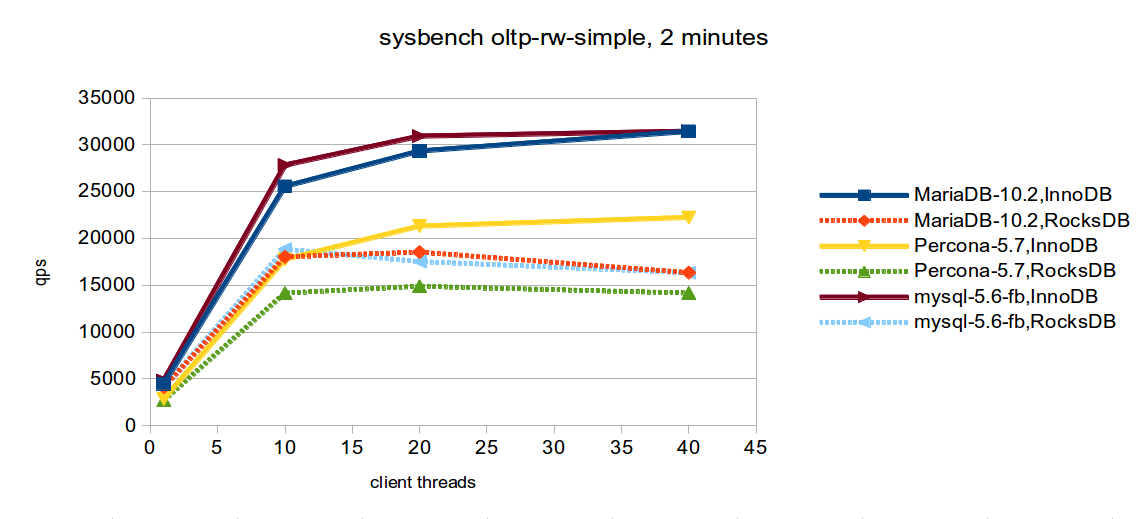
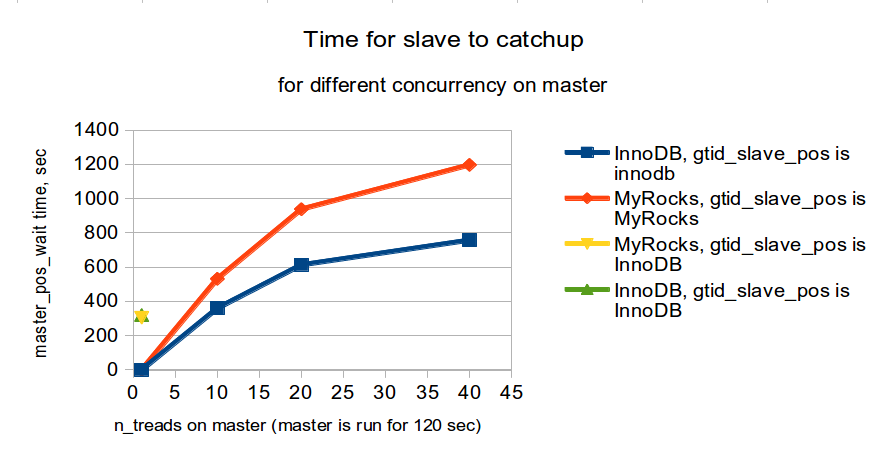
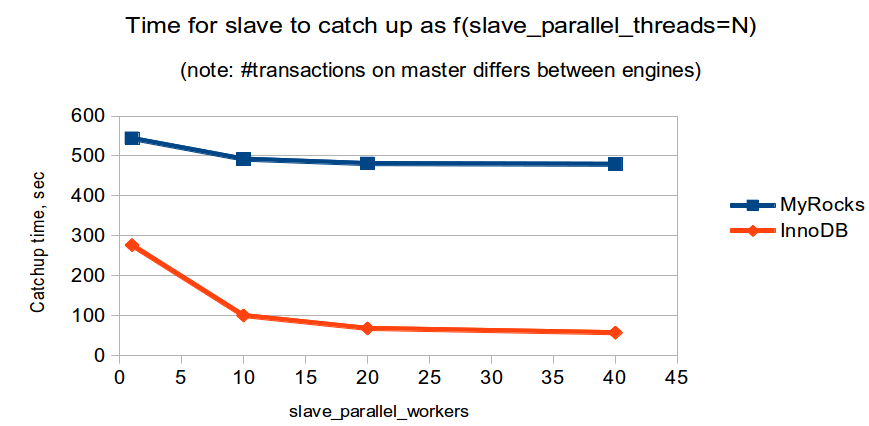
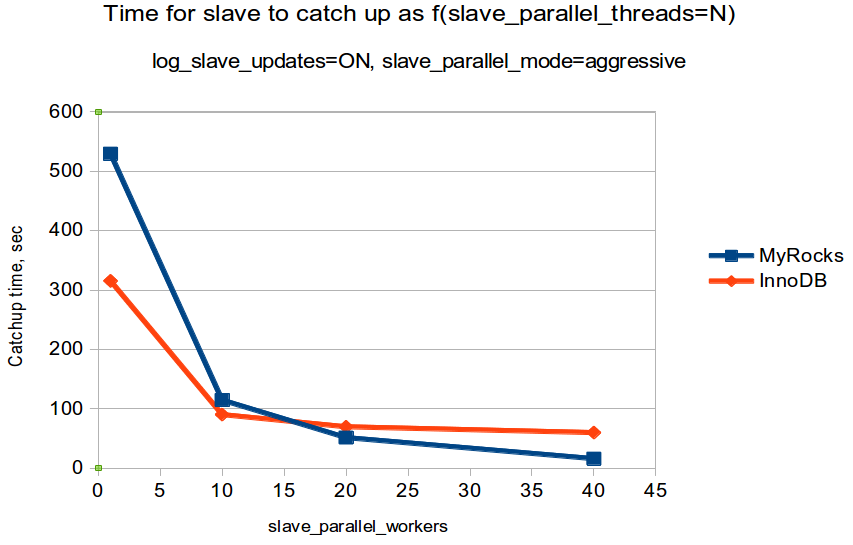
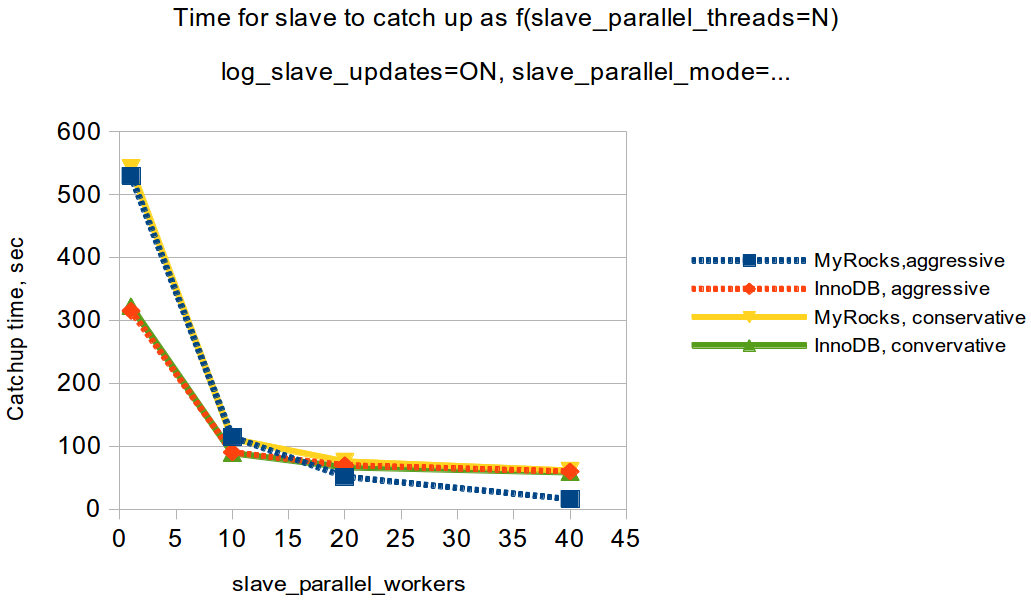
Run some pre-release performance checks to make sure MyRocks build is adequate.
Attachments
Issue Links
- relates to
-
MDEV-15372 Parallel slave speedup very limited when log_slave_updates=OFF
-
- Closed
-
