Uploaded image for project: 'MariaDB Server'
  1. MariaDB Server
  2. MDEV-13403

Mariadb (with TokuDB) excessive memory usage/leak

Details

    Description

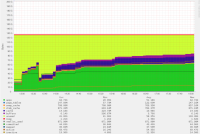
      We have been running MariaDB 10.1 with TokuDB on a Ubuntu 14.04 VPS with 4GB ram. This always worked fine. We recently updated to 10.2 and suddenly MariaDB started eating all the memory there is and also uses a lot of swap. We did upgrade our VPS to a Ubuntu 16.04 8 GB instance (not because of the problems, but just because that would improve performance). Here the issues continued.

      Settings did not change between te VPS instances, we only allocated 4GB ram to TokuDB instead of 2GB.

      Under the same workload 10.2 eats up all RAM (using 7/8GB ram + 2/8GB Swap) after 2 days, while under 10.1 the ram usage stayed in line with what you would expect.

      Unfortunately we can't go back to 10.1, since importing our dataset takes a week.

      Our database consists mainly of TokuDB tables, with one table having 9 billion rows. Other tables are in the lower million rows. Total size inclusing indexes is 900GB (uncompressed) and 300GB without indexes.
      Workload is lots of reads and inserts, but no deletes.
      Strangely the memory balloons most when running the daily stats gathering, which is almost a pure read query, except for some stats entries that get inserted.

      We do have a staging server that we can use to run valgrind massive on, and if necessary also on production, since the project is not very critical. However, we are still looking to reproduce the issue on the staging server. Also valgrind massive output does show a lot of '??' entries, even though we installed mariadb-server-core-dgbsym, mariadb-server-dbgsym and mariadb-plugins-tokudb-dbgsym.

      I will try to replicate the issue on the staging environment or otherwise use valgrind on production. However, I am not sure if massive option doesn't use much extra ram, making it hard to actually get to the ballooned ram issue.

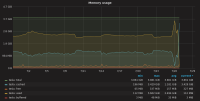
      I attached the most relevant output from mysql and some graphs from grafana.
      Let me know if you need more.

      Attachments

        1. 10.2.10_leak.png
          10.2.10_leak.png
          25 kB
        2. connections-memory-usage.txt
          1 kB
        3. dbserver-memory-usage.png
          dbserver-memory-usage.png
          36 kB
        4. dbserver-swap-usage.png
          dbserver-swap-usage.png
          20 kB
        5. dbserver-swap-usage.txt
          0.7 kB
        6. innodb-status.txt
          5 kB
        7. leak.png
          leak.png
          34 kB
        8. memory usage 1-day.png
          memory usage 1-day.png
          682 kB
        9. my.cnf
          2 kB
        10. my.cnf
          4 kB
        11. mysql-psaux.txt
          0.2 kB
        12. mysqltuner.txt
          3 kB
        13. old-version-older-server.png
          old-version-older-server.png
          62 kB
        14. status.txt
          88 kB
        15. stefano-1-ps-mysqld-rss.png
          stefano-1-ps-mysqld-rss.png
          19 kB
        16. stefano-1-ps-mysqld-rss.txt
          185 kB
        17. stefano-mariadb-10_02_16-ram-20180825.png
          stefano-mariadb-10_02_16-ram-20180825.png
          204 kB
        18. tokudb.cnf
          0.1 kB
        19. tokudb-status.txt
          46 kB

        Issue Links

          Activity

            After another day the mem usage has grown to: 7.3GB of mem and 3.8GB of swap.

            Peterdk Peter de Kraker added a comment - After another day the mem usage has grown to: 7.3GB of mem and 3.8GB of swap.

            Upgraded to 10.2.8. We still seem to have major memory leaks. A few queries on TokuDB and our server stopped responding due to taking our 8GB swap.

            I don't understand why there has not been any reaction on this issue...

            Anyway, we have decided to move to Percona server since almost all of our data is in TokuDB. Hopefully this leads to a more stable setup.

            Peterdk Peter de Kraker added a comment - Upgraded to 10.2.8. We still seem to have major memory leaks. A few queries on TokuDB and our server stopped responding due to taking our 8GB swap. I don't understand why there has not been any reaction on this issue... Anyway, we have decided to move to Percona server since almost all of our data is in TokuDB. Hopefully this leads to a more stable setup.

            It took 3 days to reimport our data into Percona, and it's running stable now. No schema changes.
            Memory leaks are gone, the daily stats query that caused massive leaking is gone, and perfomance is better.

            Peterdk Peter de Kraker added a comment - It took 3 days to reimport our data into Percona, and it's running stable now. No schema changes. Memory leaks are gone, the daily stats query that caused massive leaking is gone, and perfomance is better.

            I am having the same issue with MariaDB 10.2.8 on Debian Stretch.

            Gabscap Gabriel Paradzik added a comment - I am having the same issue with MariaDB 10.2.8 on Debian Stretch.
            Gabscap Gabriel Paradzik added a comment - - edited

            I made following discovery

            MariaDB [(none)]> SELECT SUM(i.bt_size_allocated) / POW(1024, 3), SUM(i.bt_size_in_use) / POW(1024, 3) FROM information_schema.TokuDB_fractal_tree_info i;
            +-----------------------------------------+--------------------------------------+
            | SUM(i.bt_size_allocated) / POW(1024, 3) | SUM(i.bt_size_in_use) / POW(1024, 3) |
            +-----------------------------------------+--------------------------------------+
            |                       75.59528657607734 |                   47.638405677862465 |
            +-----------------------------------------+--------------------------------------+
            MariaDB [(none)]> SHOW GLOBAL VARIABLES LIKE 'tokudb_cache_size';
            +-------------------+-------------+
            | Variable_name     | Value       |
            +-------------------+-------------+
            | tokudb_cache_size | 10737418240 |
            +-------------------+-------------+
            

            while the mysqld process is using 60.9G VIRT / 48.4G RES.
            Does this mean that all TokuDB tables/keys/etc. are using 47.6G memory? Isn't this limited by the tokudb_cache_size variable (= 10G)? I could not find any documentation of the TokuDB_fractal_tree_info table.

            Gabscap Gabriel Paradzik added a comment - - edited I made following discovery MariaDB [(none)]> SELECT SUM(i.bt_size_allocated) / POW(1024, 3), SUM(i.bt_size_in_use) / POW(1024, 3) FROM information_schema.TokuDB_fractal_tree_info i; +-----------------------------------------+--------------------------------------+ | SUM(i.bt_size_allocated) / POW(1024, 3) | SUM(i.bt_size_in_use) / POW(1024, 3) | +-----------------------------------------+--------------------------------------+ | 75.59528657607734 | 47.638405677862465 | +-----------------------------------------+--------------------------------------+ MariaDB [(none)]> SHOW GLOBAL VARIABLES LIKE 'tokudb_cache_size'; +-------------------+-------------+ | Variable_name | Value | +-------------------+-------------+ | tokudb_cache_size | 10737418240 | +-------------------+-------------+ while the mysqld process is using 60.9G VIRT / 48.4G RES. Does this mean that all TokuDB tables/keys/etc. are using 47.6G memory? Isn't this limited by the tokudb_cache_size variable (= 10G)? I could not find any documentation of the TokuDB_fractal_tree_info table.
            Peterdk Peter de Kraker added a comment - - edited

            I ran your query on my Percona instance and think it does not correspond to RAM usage.

            SELECT SUM(i.bt_size_allocated) / POW(1024, 3), SUM(i.bt_size_in_use) / POW(1024, 3) FROM information_schema.TokuDB_fractal_tree_info i;
            +-----------------------------------------+--------------------------------------+
            | SUM(i.bt_size_allocated) / POW(1024, 3) | SUM(i.bt_size_in_use) / POW(1024, 3) |
            +-----------------------------------------+--------------------------------------+
            |                      195.24247750546783 |                   191.78201553877443 |
            +-----------------------------------------+--------------------------------------+
            

            Percona/TokuDB is using 5GB of memory here, not 191. It seems to indicate total size of raw data files or so.

            Peterdk Peter de Kraker added a comment - - edited I ran your query on my Percona instance and think it does not correspond to RAM usage. SELECT SUM(i.bt_size_allocated) / POW(1024, 3), SUM(i.bt_size_in_use) / POW(1024, 3) FROM information_schema.TokuDB_fractal_tree_info i; +-----------------------------------------+--------------------------------------+ | SUM(i.bt_size_allocated) / POW(1024, 3) | SUM(i.bt_size_in_use) / POW(1024, 3) | +-----------------------------------------+--------------------------------------+ | 195.24247750546783 | 191.78201553877443 | +-----------------------------------------+--------------------------------------+ Percona/TokuDB is using 5GB of memory here, not 191. It seems to indicate total size of raw data files or so.

            Here is my month old question on StackOverflow which contains more information (eg. SHOW STATUS .. ENGINE). I'm open to suggestions to help debug this issue.

            Gabscap Gabriel Paradzik added a comment - Here is my month old question on StackOverflow which contains more information (eg. SHOW STATUS .. ENGINE). I'm open to suggestions to help debug this issue.

            Exact same issue, super high mysqld memory usage with InnoDB + TokuDB on MariaDB 10.2.8.

            Ubuntu 16.04.3
            MariaDB 10.2.8
            TokuDB tables: 5 (about 25GB of data compressed)
            InnoDB tables: ~50 (<1GB of data)
            Workload: Mostly writes, int and text data types

            Host has 32GB memory + 24GB swap, mysqld is using about 30GB of that memory + 10+GB of swap after running for a few hours (starts very low of course).

            my.cnf

            obrienmd Michael OBrien added a comment - Exact same issue, super high mysqld memory usage with InnoDB + TokuDB on MariaDB 10.2.8. Ubuntu 16.04.3 MariaDB 10.2.8 TokuDB tables: 5 (about 25GB of data compressed) InnoDB tables: ~50 (<1GB of data) Workload: Mostly writes, int and text data types Host has 32GB memory + 24GB swap, mysqld is using about 30GB of that memory + 10+GB of swap after running for a few hours (starts very low of course). my.cnf
            andyn Andrew Newt added a comment -

            Same issue on CentOS 7.

            MariaDB: 10.2.8
            Linux kernel: 4.9.36-x86_64

            TokuDB tables: 3 (about 12GB of compressed data)
            InnoDB: 62 tables (less than 10GB of data)

            8GB of ram total on the server, 1GB allocated for InnoDB and 1GB for TokuDB. Total memory allocation for MariaDB was higher initially, but has been lowered because we keep running out of memory.

            andyn Andrew Newt added a comment - Same issue on CentOS 7. MariaDB: 10.2.8 Linux kernel: 4.9.36-x86_64 TokuDB tables: 3 (about 12GB of compressed data) InnoDB: 62 tables (less than 10GB of data) 8GB of ram total on the server, 1GB allocated for InnoDB and 1GB for TokuDB. Total memory allocation for MariaDB was higher initially, but has been lowered because we keep running out of memory.
            Roze Reinis Rozitis added a comment - - edited

            Have exactly the same problem on OpenSuse Leap 42.3 with Mariadb 10.2.9.

            Upgraded from 10.2.4 and suddenly all of ram is exhausted in minutes.

            Tried to test several versions (from 10.2.5 till 10.2.9) and the last not leaking memory is 10.2.4.

            p.s. it doesn't affect Slaves only Master.

            Roze Reinis Rozitis added a comment - - edited Have exactly the same problem on OpenSuse Leap 42.3 with Mariadb 10.2.9. Upgraded from 10.2.4 and suddenly all of ram is exhausted in minutes. Tried to test several versions (from 10.2.5 till 10.2.9) and the last not leaking memory is 10.2.4. p.s. it doesn't affect Slaves only Master.
            jeffscott2 Jeff added a comment -

            Just adding another vote for this. We didn't have the leak on an early version of 10.2, but have seen it in 10.2.{7,8,9).

            CentOS 7.4.1708
            3.10.0-514.26.2.el7.x86_64
            Database size is in the hundreds of gigs and the server has 192G of ram which about 25 is allocated to mariadb, though it grows to take it all.

            I used to run a nightly table analysis job, basically $(mysqlcheck -a), but that really chewed up ram which wasn't released afterwards.

            Please get in touch with me if there's any more information I can provide to debug this. This has been going on for months and if it's not resolved soon I'm sure we'll be forced to move off of mariadb.

            jeffscott2 Jeff added a comment - Just adding another vote for this. We didn't have the leak on an early version of 10.2, but have seen it in 10.2.{7,8,9). CentOS 7.4.1708 3.10.0-514.26.2.el7.x86_64 Database size is in the hundreds of gigs and the server has 192G of ram which about 25 is allocated to mariadb, though it grows to take it all. I used to run a nightly table analysis job, basically $(mysqlcheck -a), but that really chewed up ram which wasn't released afterwards. Please get in touch with me if there's any more information I can provide to debug this. This has been going on for months and if it's not resolved soon I'm sure we'll be forced to move off of mariadb.

            10.2.10 seems still to be affected.

            By looking at changelog and seing memory leak related fixes (like "fts_create_doc_id() unnecessarily allocates 8 bytes for every inserted row" ) while we don't use fulltext indexes, I was hoping that the some similar change could have been made into current release, but no - after updating from 10.2.4 to 10.2.10 Mariadb populates all the buffers and then goes on to happily leak afterwards until oom.

            Roze Reinis Rozitis added a comment - 10.2.10 seems still to be affected. By looking at changelog and seing memory leak related fixes (like "fts_create_doc_id() unnecessarily allocates 8 bytes for every inserted row" ) while we don't use fulltext indexes, I was hoping that the some similar change could have been made into current release, but no - after updating from 10.2.4 to 10.2.10 Mariadb populates all the buffers and then goes on to happily leak afterwards until oom.
            marc.langevin@usherbrooke.ca Marc added a comment -

            Is it confirmed that the bug is only with using TokuDb? We have similar leaks problems with 10.2.8, on RH6, but we are not using TokuDB, only innodb.

            marc.langevin@usherbrooke.ca Marc added a comment - Is it confirmed that the bug is only with using TokuDb? We have similar leaks problems with 10.2.8, on RH6, but we are not using TokuDB, only innodb.

            > Is it confirmed that the bug is only with using TokuDb? We have similar leaks problems with 10.2.8, on RH6, but we are not using TokuDB, only innodb.

            It feels more like InnoDB leak or some specific case - I have an instance running 10.2.9 with only tokudb and also an instace with mixed toku and innodb tables and they work just fine, while another instance (with exact same hardware/OS/mysql config) but with different dataset and the leak manifests immediately (also only for versions 10.2.5+).

            Haven't got the chance to test InnnoDB-only instaces after 10.2.4 since kind of uneasy to upgrade production while there is this possibility of oom-kill-crash.

            Roze Reinis Rozitis added a comment - > Is it confirmed that the bug is only with using TokuDb? We have similar leaks problems with 10.2.8, on RH6, but we are not using TokuDB, only innodb. It feels more like InnoDB leak or some specific case - I have an instance running 10.2.9 with only tokudb and also an instace with mixed toku and innodb tables and they work just fine, while another instance (with exact same hardware/OS/mysql config) but with different dataset and the leak manifests immediately (also only for versions 10.2.5+). Haven't got the chance to test InnnoDB-only instaces after 10.2.4 since kind of uneasy to upgrade production while there is this possibility of oom-kill-crash.
            mariodb Stefano added a comment -

            Confirming issue as well in my case - MariaDB 10.2.6 on Gentoo Linux:
            using only 4 TokuDB tables, 1 big one (4'295'032'832 rows) being only read and 3 tiny ones (~1000 rows) getting updates- or insert-DMLs, the memory allocation is normal at the start (~3GBs) but keeps on increasing forever (aborted last test when it reached ~13GBs).

            Downgraded to 10.1.24 => problem does not occur anymore.

            mariodb Stefano added a comment - Confirming issue as well in my case - MariaDB 10.2.6 on Gentoo Linux: using only 4 TokuDB tables, 1 big one (4'295'032'832 rows) being only read and 3 tiny ones (~1000 rows) getting updates- or insert-DMLs, the memory allocation is normal at the start (~3GBs) but keeps on increasing forever (aborted last test when it reached ~13GBs). Downgraded to 10.1.24 => problem does not occur anymore.

            mariodb, can you please provide a test case, so that we can repeat the issue? These things could be highly dependent on the schema and the data.

            marc.langevin@usherbrooke.ca, Roze, there was a similar issue in InnoDB when using FULLTEXT INDEX: MDEV-13446 fts_create_doc_id() unnecessarily allocates 8 bytes for every inserted row.

            I am unaware of any actual memory leaks in InnoDB, except MDEV-13818 CREATE INDEX leaks memory if running out of undo log space.
            I normally compile and test InnoDB like this, to detect problems related to heap memory allocation:

            cmake -DWITH_ASAN=1 … && make -j$(nproc)
            cd mysql-test
            ASAN_OPTIONS=abort_on_error=1 ./mtr --parallel=auto …
            

            There may be some unnecessary memory allocation (not freeing memory as soon as possible) and fragmentation in the memory allocator. I recently analyzed what happens in an UPDATE, and identified several places where InnoDB is unnecessarily allocating (and freeing) heap memory. Fixing that would involve extensive code changes, which are probably too excessive in a GA release.

            If you find something similarly excessive as MDEV-13446 in InnoDB, please file a new issue for it, and include a test case.

            marko Marko Mäkelä added a comment - mariodb , can you please provide a test case, so that we can repeat the issue? These things could be highly dependent on the schema and the data. marc.langevin@usherbrooke.ca , Roze , there was a similar issue in InnoDB when using FULLTEXT INDEX: MDEV-13446 fts_create_doc_id() unnecessarily allocates 8 bytes for every inserted row. I am unaware of any actual memory leaks in InnoDB, except MDEV-13818 CREATE INDEX leaks memory if running out of undo log space. I normally compile and test InnoDB like this, to detect problems related to heap memory allocation: cmake -DWITH_ASAN=1 … && make -j$(nproc) cd mysql-test ASAN_OPTIONS=abort_on_error=1 ./mtr --parallel=auto … There may be some unnecessary memory allocation (not freeing memory as soon as possible) and fragmentation in the memory allocator. I recently analyzed what happens in an UPDATE, and identified several places where InnoDB is unnecessarily allocating (and freeing) heap memory. Fixing that would involve extensive code changes, which are probably too excessive in a GA release. If you find something similarly excessive as MDEV-13446 in InnoDB, please file a new issue for it, and include a test case.
            mariodb Stefano added a comment - - edited

            @Marko Mäkelä working on it.

            Edit 24.Nov.2017: sorry, haven't been able to replicate the issue so far on my test PC using simulated testcases and fake data (and btw., I Gentoo does not offer anymore v.10.2.6 in its package tree, so I am running the tests using MariaDB 10.2.10, therefore I am not sure if my tests are not good enough or if there was some fix in 10.2.10) => continuing to try to replicate the issue.

            Edit 25.Nov.2017 00:40: might have found a candidate testcase (RAM allocation kept on growing up to 3187MBs to then stabilize, which is still more than what I would have expected with settings of test-database, but which did not grow further within the next 20 minutes) => currently recreating base table but with a bit more entropy => will then rerun testcase and see if the data itself and/or duration of test has any impact on RAM allocation.

            Edit 26.Nov.2017
            Sorry, I'm not able to replicate the exact issue that I had originally (I did manage to find and install 10.2.6, but behaviour is same as 10.2.10), meaning that I didn't manage to get the apparently "infinite" growth of allocated RAM by MariaDB.
            However in the tests I do see that the amount of allocated RAM ends up becoming still much more than what I would expect and to what versions earlier than 10.2 allocate.

            I did copy 1:1 the settings that I use with MariaDB 10.1 but at least in Gentoo the config files have changed (starting from MariaDB 10.2 they're split between "/etc/mysql/mariadb.d/50-distro-client.cnf" and "/etc/mysql/mariadb.d/50-distro-server.cnf") so it could still be that I'm making some kind of mistake there?
            Well, in any case posting below the details about the testcase.

            General informations
            Originally identified issue using:

            • HW: E3-1260L v5 @ 2.90GHz, 32GB RAM, 2TB SDD
            • Kernel: 4.9.6-gentoo-r1
            • Mariadb: 10.2.6
            • GCC: 4.9.4

            PC used for testing:

            • HW: E3-1270 v1 @ 3.40GHz, 16GB RAM, 1.4TB HDD
            • Kernel: 4.8.15-gentoo
            • Mariadb: 10.2.6 and 10.2.10
            • GCC: 4.9.4 and 5.4.0

            Summary
            My expectation is to have MariaDB allocate some RAM for sorting etc... in the area of 0.5-1GB and then in addition whatever I specify in the parameter "tokudb_cache_size".
            For example if I set "tokudb_cache_size" to be 1GB then I would expect MariaDB to use max ~2GBs in total.
            The above does happen with version < 10.2, but with 10.2.x the allocated RAM (visible as RSS&RES in ps&htop) keeps on growing => here what I saw after running my test, using different settings for "tokudb_cache_size", for a couple of hours (each time I stopped the test when I had the feeling that it stopped growing):

            tokudb_cache_size(GBs) RES/RSS(MBs)
            0.5 2418
            1.0 3619
            1.5 4591
            4.0 7753
            mariodb Stefano added a comment - - edited @Marko Mäkelä working on it. Edit 24.Nov.2017 : sorry, haven't been able to replicate the issue so far on my test PC using simulated testcases and fake data (and btw., I Gentoo does not offer anymore v.10.2.6 in its package tree, so I am running the tests using MariaDB 10.2.10, therefore I am not sure if my tests are not good enough or if there was some fix in 10.2.10) => continuing to try to replicate the issue. Edit 25.Nov.2017 00:40 : might have found a candidate testcase (RAM allocation kept on growing up to 3187MBs to then stabilize, which is still more than what I would have expected with settings of test-database, but which did not grow further within the next 20 minutes) => currently recreating base table but with a bit more entropy => will then rerun testcase and see if the data itself and/or duration of test has any impact on RAM allocation. Edit 26.Nov.2017 Sorry, I'm not able to replicate the exact issue that I had originally (I did manage to find and install 10.2.6, but behaviour is same as 10.2.10), meaning that I didn't manage to get the apparently "infinite" growth of allocated RAM by MariaDB. However in the tests I do see that the amount of allocated RAM ends up becoming still much more than what I would expect and to what versions earlier than 10.2 allocate. I did copy 1:1 the settings that I use with MariaDB 10.1 but at least in Gentoo the config files have changed (starting from MariaDB 10.2 they're split between "/etc/mysql/mariadb.d/50-distro-client.cnf" and "/etc/mysql/mariadb.d/50-distro-server.cnf") so it could still be that I'm making some kind of mistake there? Well, in any case posting below the details about the testcase. General informations Originally identified issue using: HW: E3-1260L v5 @ 2.90GHz, 32GB RAM, 2TB SDD Kernel: 4.9.6-gentoo-r1 Mariadb: 10.2.6 GCC: 4.9.4 PC used for testing: HW: E3-1270 v1 @ 3.40GHz, 16GB RAM, 1.4TB HDD Kernel: 4.8.15-gentoo Mariadb: 10.2.6 and 10.2.10 GCC: 4.9.4 and 5.4.0 Summary My expectation is to have MariaDB allocate some RAM for sorting etc... in the area of 0.5-1GB and then in addition whatever I specify in the parameter "tokudb_cache_size". For example if I set "tokudb_cache_size" to be 1GB then I would expect MariaDB to use max ~2GBs in total. The above does happen with version < 10.2, but with 10.2.x the allocated RAM (visible as RSS&RES in ps&htop) keeps on growing => here what I saw after running my test, using different settings for "tokudb_cache_size", for a couple of hours (each time I stopped the test when I had the feeling that it stopped growing): tokudb_cache_size(GBs) RES/RSS(MBs) 0.5 2418 1.0 3619 1.5 4591 4.0 7753
            sjmcdowall Steven McDowall added a comment - - edited

            We have the same issue and filed an issue with MariaDB direct – working with various people there mostly @kurtpastore and Paul Moen.. we downgraded to 10.1 for now.

            sjmcdowall Steven McDowall added a comment - - edited We have the same issue and filed an issue with MariaDB direct – working with various people there mostly @kurtpastore and Paul Moen.. we downgraded to 10.1 for now.
            mariodb Stefano added a comment - - edited

            Test running on:

            • HW: E3-1270 v1 @ 3.40GHz, 16GB RAM, 1.4TB HDD
            • Kernel: 4.8.15-gentoo
            • Mariadb: 10.2.10
            • GCC: 4.9.4

            Built MariaDB with following USEflags:
            [ebuild R ~] dev-db/mariadb-10.2.10:0/18::gentoo USE="backup cracklib extraengine innodb-lz4 innodb-lzo jemalloc oqgraph pam server sphinx tokudb xml -bindist -debug -embedded -galera -innodb-snappy -jdbc -kerberos -latin1 -libressl -mroonga -numa -odbc -perl -profiling -rocksdb (-selinux) -sst-mariabackup -sst-rsync -sst-xtrabackup -static -static-libs -systemd -systemtap -tcmalloc {-test} -yassl" ABI_X86="(64) -32 (-x32)" 0 KiB

            Looking at RAM usage by using utility "htop" at column "RES" of "mysqld" process and overall "Mem" line of host, and logging "RSS" of "mysqld" from "ps" using the following:


            echo -n "$(date): " > ps-res-mysql.txt && ps aux | head -n1 >> ps-res-mysql.txt
            watch -n10 "echo -n \"$(date): \" >> ps-res-mysql.txt && ps aux | grep -i mysqld | grep -v grep | grep -v \"ps-res-mysql\" >> ps-res-mysql.txt"


            Test simplified to perform only "select"-SQLs (no update/insert/delete nor DDLs) against a big prepopulated table.
            The SQL that is used for the test is pretty simple:

            select col3, count(*) from mytbl3
            where (col1, col2) in
            (
            	(1,2)
            	,(3,4)
            	,(5,6)
            	...
            )
            group by col3
            order by count(*) desc, col3
            limit 1;"
            

            TEST PREPARATION
            Create table and prepopulate with data (~63 GB storage needed, sorting not included!)


            create table mytbl3
            (
            col1 smallint unsigned not null
            ,col2 tinyint unsigned not null
            ,col3 mediumint unsigned not null
            ,key mykey1 (col2, col1, col3)
            )
            ENGINE=TokuDB
            COMPRESSION=TOKUDB_ZLIB
            DEFAULT CHARSET=utf8 COLLATE=utf8_bin
            ;

            insert into mytbl3
            SELECT round(rand(seq) *65535,0)
            ,round(rand(seq) *255,0)
            ,round(rand(seq/3) *65535,0)
            FROM seq_0_to_4295032832
            ;

            commit
            ;


            Shutdown & restart DB.

            TEST SCRIPT
            (using python 3.4 + package pymysql 0.7.11)

            #!/usr/bin/python
             
            import os
            import sys
            import time
            import random
            import pymysql as mydb #Needs package dev-python/pymysql
             
            #Changeme-Start
            sDBhostName = "CHANGEME-HOST"
            sDBport = 3306
            sDBdatabaseName = "CHANGEME-DATABASENAME"
            sDBuserName = "CHANGEME-USERNAME"
            sDBuserPwd = "CHANGEME-PASSWORD"
            sDBsocketPath = "/var/run/mysqld/mysqld.sock"
            bUseSocket = False
            #Changeme-End
             
            #Functions-Start
            def logFileAppend(sMessage):
            	with open('/tmp/log-' + os.path.basename(sys.argv[0]) + '-pid_' + str(os.getpid()) +'.txt', 'a') as file:
            		file.write(sMessage + "\n")
            		file.close()
             
            def printMsg(msg):
            	sDateTime = time.strftime("%G-%m-%d %H:%M:%S")
            	sResult = sDateTime + " " + msg
            	print(sResult)
            	logFileAppend(sResult)
            	
            def printError(msg):
            	printMsg("ERROR DETECTED");
            	printMsg(msg)
            	printMsg("Terminating program")
            	exit(1)
            #Functions-End
             
            #Vars-Start
            dbHandle = None
            iArrayMaxLength = 65536
            iQueryCounter = 1
            #Vars-End
             
             
            try:
            	if(bUseSocket):
            		dbHandle = mydb.connect(user=sDBuserName, password=sDBuserPwd, autocommit=False, charset='utf8', database=sDBdatabaseName, unix_socket=sDBsocketPath, cursorclass=mydb.cursors.SSCursor)
            	else:
            		dbHandle = mydb.connect(user=sDBuserName, password=sDBuserPwd, host=sDBhostName, port=sDBport, autocommit=False, charset='utf8', database=sDBdatabaseName, cursorclass=mydb.cursors.SSCursor)
            except mydb.Error as err:
            	printError("Connection failed - The detailed error message was:\n" + str(err))
            else:
            	printMsg("Connection to DB established.")
            	dbHandle.autocommit(False)
             
            printMsg("Starting the big query loop.")
            while(True):
            	#Create a random array of values
            	listValues = []
            	for iLoopMain in range(0, random.randint(10,iArrayMaxLength)):
            		listValues.append(random.randint(0,255))
             
            	#Build the SQL
            	bComma = False
            	sSQL = "select col3, count(*) from mytbl3 where (col1, col2) in ("
            	for iLoopArrayPos in range(0, len(listValues)):
            		if( bComma ):
            			sSQL += ","
            		else:
            			bComma = True
            		sSQL += "(" + str(iLoopArrayPos) + "," + str(listValues[iLoopArrayPos]) + ")"
            	sSQL += ") group by col3 order by count(*) desc, col3 limit 1;"
             
            	#Run the SQL
            	dbCursor = dbHandle.cursor()
            	dbCursor.execute(sSQL)
            	objResult = dbCursor.fetchone()
            	dbCursor.close()
            	if (objResult != None):
            		printMsg("\tThe result of the query run " + str(iQueryCounter) + " with a length of " + str(len(listValues)) + " is: \"" + str(objResult) + "\".")
            	else:
            		printMsg("\tMmmhhh, weirdness detected in query run " + str(iQueryCounter) + " - got no results.")
            		
            	iQueryCounter += 1
             
            dbHandle.close()


            Database settings
            50-distro-server.cnf:

            # grep -v \# /etc/mysql/mariadb.d/50-distro-server.cnf | grep -v "^$"
            [mysqld]
            character-set-server				= utf8
            user						= mysql
            port						= 3306
            socket						= /var/run/mysqld/mysqld.sock
            pid-file					= /var/run/mysqld/mariadb.pid
            log-error					= /var/log/mysql/mysqld.err
            basedir						= /usr
            datadir						= /opt/ste_custom/mariadb_datadir/normal/permanent
            skip-external-locking
            lc_messages_dir					= /usr/share/mariadb
            lc_messages					= en_US
            bind-address    =       10.0.24.1
            log-bin
            server-id					= 1
            tmpdir                                          = /opt/ste_custom/mariadb_datadir/normal/temp/
            sql_mode=NO_AUTO_CREATE_USER,NO_ENGINE_SUBSTITUTION,STRICT_ALL_TABLES,ERROR_FOR_DIVISION_BY_ZERO
            collation-server = utf8_bin
            sort_buffer_size = 2M
            init_connect='SET collation_connection = utf8_bin'
            feedback = ON
            innodb_ft_min_token_size=0
            expire_logs_days = 1
            binlog_format=row
            innodb_log_buffer_size = 32M
            innodb_buffer_pool_size = 512M
            innodb_log_file_size = 128M
            innodb_flush_log_at_trx_commit = 2
            innodb_lock_wait_timeout = 50
            innodb_file_per_table
            innodb_data_file_path = ibdata1:10M:autoextend
            query_cache_type=0
            performance_schema=off
            optimizer_switch="subquery_cache=off"
            plugin-load=ha_tokudb
            tokudb_cache_size = 4G
            tokudb_data_dir = /opt/ste_custom/mariadb_datadir/normal/permanent_tokudb/data
            tokudb_log_dir = /opt/ste_custom/mariadb_datadir/normal/permanent_tokudb/log
            tokudb_tmp_dir = /opt/ste_custom/mariadb_datadir/normal/temp_tokudb/tmp
            

            50-distro-client.cnf:

            # grep -v \# /etc/mysql/mariadb.d/50-distro-client.cnf | grep -v "^$"
            [client]
            socket						= /var/run/mysqld/mysqld.sock
            character-sets-dir				= /usr/share/mariadb/charsets
            default-character-set=utf8
            [mysql]
            [mysqldump]
            quick
            max_allowed_packet                      = 128M
            [myisamchk]
            character-sets-dir=/usr/share/mariadb/charsets
            [myisampack]
            character-sets-dir=/usr/share/mariadb/charsets


            I stopped the test when the RES/RSS size of mariadb reached ~7753MBs (having 4GBs for "tokudb_cache_size" my expectation is to have a RES/RSS between 4 and 5GBs - e.g. currently my other PC that runs MariaDB 10.1.24-r1 has ~4.8GBs RES/RSS for MariaDB after a week of looping through a similar SQL).


            stefano-1-ps-mysqld-rss.txt

            mariodb Stefano added a comment - - edited Test running on: HW: E3-1270 v1 @ 3.40GHz, 16GB RAM, 1.4TB HDD Kernel: 4.8.15-gentoo Mariadb: 10.2.10 GCC: 4.9.4 Built MariaDB with following USEflags: [ebuild R ~] dev-db/mariadb-10.2.10:0/18::gentoo USE="backup cracklib extraengine innodb-lz4 innodb-lzo jemalloc oqgraph pam server sphinx tokudb xml -bindist -debug -embedded -galera -innodb-snappy -jdbc -kerberos -latin1 -libressl -mroonga -numa -odbc -perl -profiling -rocksdb (-selinux) -sst-mariabackup -sst-rsync -sst-xtrabackup -static -static-libs -systemd -systemtap -tcmalloc {-test} -yassl" ABI_X86="(64) -32 (-x32)" 0 KiB Looking at RAM usage by using utility "htop" at column "RES" of "mysqld" process and overall "Mem" line of host, and logging "RSS" of "mysqld" from "ps" using the following: echo -n "$(date): " > ps-res-mysql.txt && ps aux | head -n1 >> ps-res-mysql.txt watch -n10 "echo -n \"$(date): \" >> ps-res-mysql.txt && ps aux | grep -i mysqld | grep -v grep | grep -v \"ps-res-mysql\" >> ps-res-mysql.txt" Test simplified to perform only "select"-SQLs (no update/insert/delete nor DDLs) against a big prepopulated table. The SQL that is used for the test is pretty simple: select col3, count(*) from mytbl3 where (col1, col2) in ( (1,2) ,(3,4) ,(5,6) ... ) group by col3 order by count(*) desc, col3 limit 1;" TEST PREPARATION Create table and prepopulate with data (~63 GB storage needed, sorting not included!) create table mytbl3 ( col1 smallint unsigned not null ,col2 tinyint unsigned not null ,col3 mediumint unsigned not null ,key mykey1 (col2, col1, col3) ) ENGINE=TokuDB COMPRESSION=TOKUDB_ZLIB DEFAULT CHARSET=utf8 COLLATE=utf8_bin ; insert into mytbl3 SELECT round(rand(seq) *65535,0) ,round(rand(seq) *255,0) ,round(rand(seq/3) *65535,0) FROM seq_0_to_4295032832 ; commit ; Shutdown & restart DB. TEST SCRIPT (using python 3.4 + package pymysql 0.7.11) #!/usr/bin/python   import os import sys import time import random import pymysql as mydb #Needs package dev-python/pymysql   #Changeme-Start sDBhostName = "CHANGEME-HOST" sDBport = 3306 sDBdatabaseName = "CHANGEME-DATABASENAME" sDBuserName = "CHANGEME-USERNAME" sDBuserPwd = "CHANGEME-PASSWORD" sDBsocketPath = "/var/run/mysqld/mysqld.sock" bUseSocket = False #Changeme-End   #Functions-Start def logFileAppend(sMessage): with open('/tmp/log-' + os.path.basename(sys.argv[0]) + '-pid_' + str(os.getpid()) +'.txt', 'a') as file: file.write(sMessage + "\n") file.close()   def printMsg(msg): sDateTime = time.strftime("%G-%m-%d %H:%M:%S") sResult = sDateTime + " " + msg print(sResult) logFileAppend(sResult) def printError(msg): printMsg("ERROR DETECTED"); printMsg(msg) printMsg("Terminating program") exit(1) #Functions-End   #Vars-Start dbHandle = None iArrayMaxLength = 65536 iQueryCounter = 1 #Vars-End     try: if(bUseSocket): dbHandle = mydb.connect(user=sDBuserName, password=sDBuserPwd, autocommit=False, charset='utf8', database=sDBdatabaseName, unix_socket=sDBsocketPath, cursorclass=mydb.cursors.SSCursor) else: dbHandle = mydb.connect(user=sDBuserName, password=sDBuserPwd, host=sDBhostName, port=sDBport, autocommit=False, charset='utf8', database=sDBdatabaseName, cursorclass=mydb.cursors.SSCursor) except mydb.Error as err: printError("Connection failed - The detailed error message was:\n" + str(err)) else: printMsg("Connection to DB established.") dbHandle.autocommit(False)   printMsg("Starting the big query loop.") while(True): #Create a random array of values listValues = [] for iLoopMain in range(0, random.randint(10,iArrayMaxLength)): listValues.append(random.randint(0,255))   #Build the SQL bComma = False sSQL = "select col3, count(*) from mytbl3 where (col1, col2) in (" for iLoopArrayPos in range(0, len(listValues)): if( bComma ): sSQL += "," else: bComma = True sSQL += "(" + str(iLoopArrayPos) + "," + str(listValues[iLoopArrayPos]) + ")" sSQL += ") group by col3 order by count(*) desc, col3 limit 1;"   #Run the SQL dbCursor = dbHandle.cursor() dbCursor.execute(sSQL) objResult = dbCursor.fetchone() dbCursor.close() if (objResult != None): printMsg("\tThe result of the query run " + str(iQueryCounter) + " with a length of " + str(len(listValues)) + " is: \"" + str(objResult) + "\".") else: printMsg("\tMmmhhh, weirdness detected in query run " + str(iQueryCounter) + " - got no results.") iQueryCounter += 1   dbHandle.close() Database settings 50-distro-server.cnf: # grep -v \# /etc/mysql/mariadb.d/50-distro-server.cnf | grep -v "^$" [mysqld] character-set-server = utf8 user = mysql port = 3306 socket = /var/run/mysqld/mysqld.sock pid-file = /var/run/mysqld/mariadb.pid log-error = /var/log/mysql/mysqld.err basedir = /usr datadir = /opt/ste_custom/mariadb_datadir/normal/permanent skip-external-locking lc_messages_dir = /usr/share/mariadb lc_messages = en_US bind-address = 10.0.24.1 log-bin server-id = 1 tmpdir = /opt/ste_custom/mariadb_datadir/normal/temp/ sql_mode=NO_AUTO_CREATE_USER,NO_ENGINE_SUBSTITUTION,STRICT_ALL_TABLES,ERROR_FOR_DIVISION_BY_ZERO collation-server = utf8_bin sort_buffer_size = 2M init_connect='SET collation_connection = utf8_bin' feedback = ON innodb_ft_min_token_size=0 expire_logs_days = 1 binlog_format=row innodb_log_buffer_size = 32M innodb_buffer_pool_size = 512M innodb_log_file_size = 128M innodb_flush_log_at_trx_commit = 2 innodb_lock_wait_timeout = 50 innodb_file_per_table innodb_data_file_path = ibdata1:10M:autoextend query_cache_type=0 performance_schema=off optimizer_switch="subquery_cache=off" plugin-load=ha_tokudb tokudb_cache_size = 4G tokudb_data_dir = /opt/ste_custom/mariadb_datadir/normal/permanent_tokudb/data tokudb_log_dir = /opt/ste_custom/mariadb_datadir/normal/permanent_tokudb/log tokudb_tmp_dir = /opt/ste_custom/mariadb_datadir/normal/temp_tokudb/tmp 50-distro-client.cnf: # grep -v \# /etc/mysql/mariadb.d/50-distro-client.cnf | grep -v "^$" [client] socket = /var/run/mysqld/mysqld.sock character-sets-dir = /usr/share/mariadb/charsets default-character-set=utf8 [mysql] [mysqldump] quick max_allowed_packet = 128M [myisamchk] character-sets-dir=/usr/share/mariadb/charsets [myisampack] character-sets-dir=/usr/share/mariadb/charsets I stopped the test when the RES/RSS size of mariadb reached ~7753MBs (having 4GBs for "tokudb_cache_size" my expectation is to have a RES/RSS between 4 and 5GBs - e.g. currently my other PC that runs MariaDB 10.1.24-r1 has ~4.8GBs RES/RSS for MariaDB after a week of looping through a similar SQL). stefano-1-ps-mysqld-rss.txt
            neocogent Chris Savery added a comment -

            I'm having the same or similar issue here. I was using TokuDB with MariaDB 10.2.11 and had run away memory consumption and OOM shutdowns. This is on a Ubuntu 16.04 VPS 4vCPU,8GB with one database with high level of insertions (initial loading), but only around 1-2 GB of total data.

            I had to give up on TokuDB for this and other poor performance reasons. So I disabled TokuDB, and enabled the RocksDB plugin and started testing my application with this engine. However, I am getting similar issues with RocksDB, though admittedly not as severe. I can do ongoing insertions for about 6-8 hours before memory climbs to >6GB (total 8GB, cnf set at 4GB).

            In both plugin cases I set only one my.cnf setting - tokudb_cache_size or rocksdb_cache_size both for 4G and then in later trials for 3200M. Now with RocksDB it will grow steadily til about 4-5GB and then slows down and crawls up to more than 6GB over several hours. At some point when it exceeds this level it will always start slowing and overloading the system so that nothing can work. Insertion rate drops to near zero. Even typing commands in the terminal or another ssh login will take several minutes. htop shows massive cpu wait cycles (gray bars). At this point if I'm lucky I can stop the mysql daemon but often only a hard reboot from the host company control panel will resurrect the system. Once rebooted, or MariaDB restarted, it will operate fine, and so far has not lost data (I'm aware of), and starts again at 120MB and moves upwards and repeats the cycle. It really is unusable as is without some kind of way to limit MariaDB memory use. In the case of RocksDB I don't think there is an option to downgrade as I think it's only supported in 10.2.

            For the reasons above I expect this is either another unrelated memory leak or it is a leak in MariaDB and not TokuDB plugin specific. I cannot imagine that it is expected behavior for MariaDB to consume memory until it crashes.

            neocogent Chris Savery added a comment - I'm having the same or similar issue here. I was using TokuDB with MariaDB 10.2.11 and had run away memory consumption and OOM shutdowns. This is on a Ubuntu 16.04 VPS 4vCPU,8GB with one database with high level of insertions (initial loading), but only around 1-2 GB of total data. I had to give up on TokuDB for this and other poor performance reasons. So I disabled TokuDB, and enabled the RocksDB plugin and started testing my application with this engine. However, I am getting similar issues with RocksDB, though admittedly not as severe. I can do ongoing insertions for about 6-8 hours before memory climbs to >6GB (total 8GB, cnf set at 4GB). In both plugin cases I set only one my.cnf setting - tokudb_cache_size or rocksdb_cache_size both for 4G and then in later trials for 3200M. Now with RocksDB it will grow steadily til about 4-5GB and then slows down and crawls up to more than 6GB over several hours. At some point when it exceeds this level it will always start slowing and overloading the system so that nothing can work. Insertion rate drops to near zero. Even typing commands in the terminal or another ssh login will take several minutes. htop shows massive cpu wait cycles (gray bars). At this point if I'm lucky I can stop the mysql daemon but often only a hard reboot from the host company control panel will resurrect the system. Once rebooted, or MariaDB restarted, it will operate fine, and so far has not lost data (I'm aware of), and starts again at 120MB and moves upwards and repeats the cycle. It really is unusable as is without some kind of way to limit MariaDB memory use. In the case of RocksDB I don't think there is an option to downgrade as I think it's only supported in 10.2. For the reasons above I expect this is either another unrelated memory leak or it is a leak in MariaDB and not TokuDB plugin specific. I cannot imagine that it is expected behavior for MariaDB to consume memory until it crashes.
            leciel leo cardia added a comment -

            I also have same issue here.

            Serve1r: 250 Gb memory
            mariadb uses tokudb_directio, tokudb_cache_size=40G
            compressed tokudb database size is 400Gb in ZLib

            result is [ERROR] mysqld: Out of memory (Needed 262143960 bytes)

            TCS(tokudb_cache_size) = 40G = drains 250Gb memory in 6 Hours.
            TCS(tokudb_cache_size) = 35G = drains 250Gb memory in 12 Hours.
            TCS(tokudb_cache_size) = 30G = drains 250Gb memory in 24 Hours.

            Tokudb cache drains lots of memory.

            Several configuration, I have slave mariadb server with 128GB configuration.
            I checked that TCS must not set over 8% , it may depends what queries running.
            Huge table scanning queries will drain server memory faster. Tokudb designed for huge database. but It can't hold up huge database actually. at least performance you may need 40GB of tokudb cache size. performance reason, you should set 4TB or much memory for longer operation.

            leciel leo cardia added a comment - I also have same issue here. Serve1r: 250 Gb memory mariadb uses tokudb_directio, tokudb_cache_size=40G compressed tokudb database size is 400Gb in ZLib result is [ERROR] mysqld: Out of memory (Needed 262143960 bytes) TCS(tokudb_cache_size) = 40G = drains 250Gb memory in 6 Hours. TCS(tokudb_cache_size) = 35G = drains 250Gb memory in 12 Hours. TCS(tokudb_cache_size) = 30G = drains 250Gb memory in 24 Hours. Tokudb cache drains lots of memory. Several configuration, I have slave mariadb server with 128GB configuration. I checked that TCS must not set over 8% , it may depends what queries running. Huge table scanning queries will drain server memory faster. Tokudb designed for huge database. but It can't hold up huge database actually. at least performance you may need 40GB of tokudb cache size. performance reason, you should set 4TB or much memory for longer operation.
            marc.langevin@usherbrooke.ca Marc added a comment -

            I finally discovered that my memory problem was caused by innodb not using large pages and there was no memory leak in my case, we are not using TokuDb neither. Problem was happening because in huge pages configuration I was including the one that were supposed to be used by Innodb but since there were not , but still were reserved, when innodb needed memory it was allocated from remaining memory of the system so appearing as leaking ... I reconfigured huge pages minus pages needed by innodb and memory usage went down immediately.
            Could it be possible that it also affects this problem with TokuDB?
            Innodb bug is MDEV-13785 and is still there in MariaDb 10.2.12.

            marc.langevin@usherbrooke.ca Marc added a comment - I finally discovered that my memory problem was caused by innodb not using large pages and there was no memory leak in my case, we are not using TokuDb neither. Problem was happening because in huge pages configuration I was including the one that were supposed to be used by Innodb but since there were not , but still were reserved, when innodb needed memory it was allocated from remaining memory of the system so appearing as leaking ... I reconfigured huge pages minus pages needed by innodb and memory usage went down immediately. Could it be possible that it also affects this problem with TokuDB? Innodb bug is MDEV-13785 and is still there in MariaDb 10.2.12.
            neocogent Chris Savery added a comment - - edited

            I've just been bitten by this again. I was testing a table using RocksDB engine and 32GB RAM on a server. I hadn't noticed that memory was climbing up and the kernel went OOM and locked up everything. Only recourse was a hard reboot and RocksDB table was corrupted and non-recoverable afterwards.

            I know this issue is filed under TokuDB but given comments above and my own experiences with this initially on TokuDB and switching to RocksDB and having the same problems I'm pretty sure this issue is not specific to TokuDB and a more general MariabDB - perhaps engine plugin related. I ran for 2 weeks on this server with only MyISAM tables (InnoDB enabled but no use/activity). With 5 hours of altering a table to use RocksDB engine it went OOM and crashed. The only sql being run was an insert ...select from a MyISAM table as a test of inserting 100 million records. Nothing more complex or demanding.

            This was on MariabDB 10.2.12 on an Ubuntu 16.04 i6700 server with 32GB 480GB SSD (RAID1).

            neocogent Chris Savery added a comment - - edited I've just been bitten by this again. I was testing a table using RocksDB engine and 32GB RAM on a server. I hadn't noticed that memory was climbing up and the kernel went OOM and locked up everything. Only recourse was a hard reboot and RocksDB table was corrupted and non-recoverable afterwards. I know this issue is filed under TokuDB but given comments above and my own experiences with this initially on TokuDB and switching to RocksDB and having the same problems I'm pretty sure this issue is not specific to TokuDB and a more general MariabDB - perhaps engine plugin related. I ran for 2 weeks on this server with only MyISAM tables (InnoDB enabled but no use/activity). With 5 hours of altering a table to use RocksDB engine it went OOM and crashed. The only sql being run was an insert ...select from a MyISAM table as a test of inserting 100 million records. Nothing more complex or demanding. This was on MariabDB 10.2.12 on an Ubuntu 16.04 i6700 server with 32GB 480GB SSD (RAID1).

            We have hit this too – many times and consistently – when inserting large amounts (> 10TB) of data into TokuDB via LOAD DATA INFILES .. This only happened in 10.2X and never in 10.0 or 10.1. Sounds like large data insertion maybe the underlying culprit and not TokuDB per se? I'm surprised at how long this rather large problem has been still around without much (any?) word from MariaDB .. especially if it's a cross engine issue and not TokuDB itself .. (i.e. it's not Percona)

            sjmcdowall Steven McDowall added a comment - We have hit this too – many times and consistently – when inserting large amounts (> 10TB) of data into TokuDB via LOAD DATA INFILES .. This only happened in 10.2X and never in 10.0 or 10.1. Sounds like large data insertion maybe the underlying culprit and not TokuDB per se? I'm surprised at how long this rather large problem has been still around without much (any?) word from MariaDB .. especially if it's a cross engine issue and not TokuDB itself .. (i.e. it's not Percona)

            > This only happened in 10.2X and never in 10.0 or 10.1.

            It doesn't happen on 10.2 also till 10.2.4 .. after that there are some changes regarding how the storage engines plug in (at least for example from packaging point of view tokudb gets external package).

            Roze Reinis Rozitis added a comment - > This only happened in 10.2X and never in 10.0 or 10.1. It doesn't happen on 10.2 also till 10.2.4 .. after that there are some changes regarding how the storage engines plug in (at least for example from packaging point of view tokudb gets external package).

            also happpened with massive

            insert into table(a,b,c)values(1,2,3),(2,4,5),.....(1,2,3)

            into a tokudb table.

            Confirmed, happen with 10.2 but not 10.1

            Richard Richard Stracke added a comment - also happpened with massive insert into table(a,b,c)values(1,2,3),(2,4,5),.....(1,2,3) into a tokudb table. Confirmed, happen with 10.2 but not 10.1

            Can also confirm the same issue in 10.3.7

            yudelevi Daniel Yudelevich added a comment - Can also confirm the same issue in 10.3.7

            It seems like setting the malloc-lib explicitly to jemalloc resolves this issue (at least for my case in 10.3.7)

            [mysqld_safe]
            malloc-lib=jemalloc
            

            MariaDB [(none)]> show variables like '%malloc%';
            +------------------------+------------------------------------------------------------+
            | Variable_name          | Value                                                      |
            +------------------------+------------------------------------------------------------+
            | tokudb_check_jemalloc  | ON                                                         |
            | version_malloc_library | jemalloc 3.6.0-0-g46c0af68bd248b04df75e4f92d5fb804c3d75340 |
            +------------------------+------------------------------------------------------------+
            2 rows in set (0.001 sec)
            

            yudelevi Daniel Yudelevich added a comment - It seems like setting the malloc-lib explicitly to jemalloc resolves this issue (at least for my case in 10.3.7) [mysqld_safe] malloc-lib=jemalloc MariaDB [(none)]> show variables like '%malloc%'; +------------------------+------------------------------------------------------------+ | Variable_name | Value | +------------------------+------------------------------------------------------------+ | tokudb_check_jemalloc | ON | | version_malloc_library | jemalloc 3.6.0-0-g46c0af68bd248b04df75e4f92d5fb804c3d75340 | +------------------------+------------------------------------------------------------+ 2 rows in set (0.001 sec)
            mariodb Stefano added a comment - - edited

            Can you guys confirm that the bug has been fixed?
            I've got "tokudb_cache_size = 12G" in 10.2.16 but after ~1.5hrs I saw the process being at around 21G in "htop" in the "RES" column (I then anyway shut down the DB because of other problems, see below).
            My "show variables like '%malloc%'" returns only "tokudb_check_jemalloc ON" and "version_malloc_library system" (compiled mariaDB in Gentoo Linux with "jemalloc" flag explicitly switched on - the version of jemalloc on my system is "3.6.0").

            Side story - just fyi
            At the same time, the overall performance of 10.2.16 is disappointing; I'm running since weeks a lot of "insert"-statements and in 10.1 I had something like ~120 millions executed per hour, but today in 10.2 I get ~90 millions.
            In 10.2 I see that when the checkpoint-thing gets executed (I set "tokudb_checkpointing_period=120") I have only ~40% CPU usage, but in 10.1 this used to be 100% (no special HW - "Intel(R) Xeon(R) CPU E31270 @ 3.40GHz")
            I did try to set explicitly very high fantasy-values for "tokudb_cachetable_pool_threads"/"tokudb_checkpoint_pool_threads"/"tokudb_client_pool_threads" but it changed absolutely nothing.

            I am currently exporting all data to then [reimport it under 10.2 + run workload] and then if 10.2 is still bad [reimport it into 10.1 + run
            workload].
            I think that the "stable" keyword is misleading here (https://downloads.mariadb.org/mariadb/+releases/) => maybe it should say "released"?
            Cheers

            mariodb Stefano added a comment - - edited Can you guys confirm that the bug has been fixed? I've got "tokudb_cache_size = 12G" in 10.2.16 but after ~1.5hrs I saw the process being at around 21G in "htop" in the "RES" column (I then anyway shut down the DB because of other problems, see below). My "show variables like '%malloc%'" returns only "tokudb_check_jemalloc ON" and "version_malloc_library system" (compiled mariaDB in Gentoo Linux with "jemalloc" flag explicitly switched on - the version of jemalloc on my system is "3.6.0"). Side story - just fyi At the same time, the overall performance of 10.2.16 is disappointing; I'm running since weeks a lot of "insert"-statements and in 10.1 I had something like ~120 millions executed per hour, but today in 10.2 I get ~90 millions. In 10.2 I see that when the checkpoint-thing gets executed (I set "tokudb_checkpointing_period=120") I have only ~40% CPU usage, but in 10.1 this used to be 100% (no special HW - "Intel(R) Xeon(R) CPU E31270 @ 3.40GHz") I did try to set explicitly very high fantasy-values for "tokudb_cachetable_pool_threads"/"tokudb_checkpoint_pool_threads"/"tokudb_client_pool_threads" but it changed absolutely nothing. I am currently exporting all data to then [reimport it under 10.2 + run workload] and then if 10.2 is still bad [reimport it into 10.1 + run workload]. I think that the "stable" keyword is misleading here ( https://downloads.mariadb.org/mariadb/+releases/ ) => maybe it should say "released"? Cheers

            I cannot truly confirm it, as I wasn't able to repeat the issue.

            But all previous comments seem to imply that it didn't happen in 10.1 (where MariaDB is linked with jemalloc) and only happen in 10.2+ (where only TokuDB is linked with jemalloc) and this issue disappears when jemalloc is ld-preloaded.

            So, this means that this behavior happen when a shared library linked with jemalloc is dynamically loaded (dlopen) into a non-jemalloc binary. Jemalloc apparently wants to be the only memory allocator for the whole executable and doesn't like to share.

            So, we fixed this issue by not linking tokudb with jemalloc and instead ld-preloading jemalloc. Which resolves the issue according to earlier comments.

            This automatic ld-preloading only works in our deb and rpm packages (where tokudb package installs a .cnf file with the malloc-lib=jemalloc line). As you build yourself on Gentoo, you need to make sure that either the mysqld executable is linked with jemalloc or nothing is linked with jemalloc and you ld-preload it.

            As far as the performance goes, could you please report it as a separate bug, so that we could investigate it? Thanks.

            serg Sergei Golubchik added a comment - I cannot truly confirm it, as I wasn't able to repeat the issue. But all previous comments seem to imply that it didn't happen in 10.1 (where MariaDB is linked with jemalloc) and only happen in 10.2+ (where only TokuDB is linked with jemalloc) and this issue disappears when jemalloc is ld-preloaded. So, this means that this behavior happen when a shared library linked with jemalloc is dynamically loaded (dlopen) into a non-jemalloc binary. Jemalloc apparently wants to be the only memory allocator for the whole executable and doesn't like to share. So, we fixed this issue by not linking tokudb with jemalloc and instead ld-preloading jemalloc. Which resolves the issue according to earlier comments. This automatic ld-preloading only works in our deb and rpm packages (where tokudb package installs a .cnf file with the malloc-lib=jemalloc line). As you build yourself on Gentoo, you need to make sure that either the mysqld executable is linked with jemalloc or nothing is linked with jemalloc and you ld-preload it. As far as the performance goes, could you please report it as a separate bug, so that we could investigate it? Thanks.
            mariodb Stefano added a comment -

            Thanks Sergei
            Sorry for the complaining post - I was very tired and frustrated after 48hrs of debugging and up&downgrading & testing multiple config settings => realizing that I had no way out and deciding to export and then later import all data (to downgrade) was the final heavy hit.

            I'm currently downgrading back to 10.1(.33) mainly because I noticed that I had non-optimal insert-performance as well with the old 10.2.15 (when I wrote the above post I did not realize that I did not have to export+import again everything to do a minor downgrade) and as well with 10.3.8 (the major upgrade was my final hope...) => I therefore suppose that some change done in 10.2/3 is causing this.
            I'll then upgrade to 10.1.35 whenever it becomes available (I need a bugfix which is included there) and then I think that I'll try to stay on 10.1.35 hoping that I don't need anything new.

            Yes, I will try to simplify and reproduce the "good vs bad" performance (in VMs) and then post a bug report.

            I will shut up about the memory leak for the time being as long as nobody else complains and I don't have to upgrade to 10.2/3

            Cheers and thanks a lot for your help.

            mariodb Stefano added a comment - Thanks Sergei Sorry for the complaining post - I was very tired and frustrated after 48hrs of debugging and up&downgrading & testing multiple config settings => realizing that I had no way out and deciding to export and then later import all data (to downgrade) was the final heavy hit. I'm currently downgrading back to 10.1(.33) mainly because I noticed that I had non-optimal insert-performance as well with the old 10.2.15 (when I wrote the above post I did not realize that I did not have to export+import again everything to do a minor downgrade) and as well with 10.3.8 (the major upgrade was my final hope...) => I therefore suppose that some change done in 10.2/3 is causing this. I'll then upgrade to 10.1.35 whenever it becomes available (I need a bugfix which is included there) and then I think that I'll try to stay on 10.1.35 hoping that I don't need anything new. Yes, I will try to simplify and reproduce the "good vs bad" performance (in VMs) and then post a bug report. I will shut up about the memory leak for the time being as long as nobody else complains and I don't have to upgrade to 10.2/3 Cheers and thanks a lot for your help.

            Can confirm that with 10.2.16 the leak/excessive memory usage is gone.
            (tested on several databases/datasets which hit OOM few minutes later with versions 10.2.5+, now 10.2.16 running for several days within constant memory amount/limits without a problem).

            Thank you for the fix.

            Roze Reinis Rozitis added a comment - Can confirm that with 10.2.16 the leak/excessive memory usage is gone. (tested on several databases/datasets which hit OOM few minutes later with versions 10.2.5+, now 10.2.16 running for several days within constant memory amount/limits without a problem). Thank you for the fix.

            We are running MariaDB 10.3.7 with tokudb 5.6.39-83.1 on Debian 9 and we are experiencing exactly the same problem. It seems that all queries drive memory up, which is never released, but some big selects on very large tables (400 million rows) like this:
            select * from x where y in (4000 strings here)
            can increase memory usage by several GB instantaneously that are never released. A few consecutive invocations of this query will crash mysqld.

            mhadji@gmail.com Marios Hadjieleftheriou added a comment - We are running MariaDB 10.3.7 with tokudb 5.6.39-83.1 on Debian 9 and we are experiencing exactly the same problem. It seems that all queries drive memory up, which is never released, but some big selects on very large tables (400 million rows) like this: select * from x where y in (4000 strings here) can increase memory usage by several GB instantaneously that are never released. A few consecutive invocations of this query will crash mysqld.
            mariodb Stefano added a comment - - edited

            Hi all
            Sorry, I still have to complain, ggghhh
            I'm still seeing high RAM usage.
            And sorry, I did not do any "clean" tests yet - I just felt I had to post what I knew so far (so many stability problems with MariaDB so far => starting to turn my attention towards Apache Kudu & Yandex Clickhouse...).

            It's definitely not as obviously visible as with versions equal/lower than 10.2.15, but in my opinion the problem is still there.

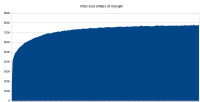
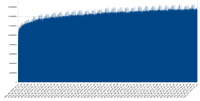
            Attaching the file "stefano-mariadb-10_02_16-ram-20180825.png":

            The graph shows the RSS allocation from a clean start up to ~2.5 billion inserts (2'537'827'547) (some very few selects & updates were executed as well, but at most 0.001% of all DMLs).

            My current setting is"tokudb_cache_size = 12G", so I wouldn't expect it to go a lot beyond that - 15GB is definitely beyond my expectations. Sometimes it went up to 26 GBs, but I've always been able to shut it down before it started doing some serious swapping.

            I admit that the graph isn't very exciting, but I've seen numbers grow a lot faster under certain conditions (e.g. concurrent queries like "insert into [my_isam_table] select a_single_column from [my_tokudb_tbl]>" + "insert into [my_VEC_table] select some, other, cols from [my_tokudb_tbl]" made my 32GB server start swapping within minutes - sorry, I did not repeat the experiment.

            MariaDB 10.1 (used mostly 10.1.34) did not have this problem but totally hanged after ~1 days of continuous "insert"s with no kind of hint of "why" anywhere => I usually had to "kill -9 xxx" the mariadb-process & start it & wait for a recovery", so from this point of view the 10.2-series is better (no hard hangs even after having processed the same amount of data as the 10.1-series) but for me it's still ultimately unstable.

            (btw. when using TokuDB the insert-rate with the 10.1-series is still 10-20% faster than with 10.2/3-series; looks like 10.2/3 uses max 25-50-75% of the available vCPUs for the checkpoints, but this is another issue...)

            Question:
            is anybody doing at least ~1 million "inserts" upwards per minute for an extended amount of time (hours, days, weeks) and if yes, do you see any suspicious RAM allocation/behaviour?
            (asking this because the factor of "time elapsed vs. amount of inserts" might have something to do with the problem)
            Thanks a lot
            Stefano

            mariodb Stefano added a comment - - edited Hi all Sorry, I still have to complain, ggghhh I'm still seeing high RAM usage. And sorry, I did not do any "clean" tests yet - I just felt I had to post what I knew so far (so many stability problems with MariaDB so far => starting to turn my attention towards Apache Kudu & Yandex Clickhouse...). It's definitely not as obviously visible as with versions equal/lower than 10.2.15, but in my opinion the problem is still there. Attaching the file "stefano-mariadb-10_02_16-ram-20180825.png": The graph shows the RSS allocation from a clean start up to ~2.5 billion inserts (2'537'827'547) (some very few selects & updates were executed as well, but at most 0.001% of all DMLs). My current setting is"tokudb_cache_size = 12G", so I wouldn't expect it to go a lot beyond that - 15GB is definitely beyond my expectations. Sometimes it went up to 26 GBs, but I've always been able to shut it down before it started doing some serious swapping. I admit that the graph isn't very exciting, but I've seen numbers grow a lot faster under certain conditions (e.g. concurrent queries like "insert into [my_isam_table] select a_single_column from [my_tokudb_tbl] >" + "insert into [my_VEC_table] select some, other, cols from [my_tokudb_tbl] " made my 32GB server start swapping within minutes - sorry, I did not repeat the experiment. MariaDB 10.1 (used mostly 10.1.34) did not have this problem but totally hanged after ~1 days of continuous "insert"s with no kind of hint of "why" anywhere => I usually had to "kill -9 xxx" the mariadb-process & start it & wait for a recovery", so from this point of view the 10.2-series is better (no hard hangs even after having processed the same amount of data as the 10.1-series) but for me it's still ultimately unstable. (btw. when using TokuDB the insert-rate with the 10.1-series is still 10-20% faster than with 10.2/3-series; looks like 10.2/3 uses max 25-50-75% of the available vCPUs for the checkpoints, but this is another issue...) Question: is anybody doing at least ~1 million "inserts" upwards per minute for an extended amount of time (hours, days, weeks) and if yes, do you see any suspicious RAM allocation/behaviour? (asking this because the factor of "time elapsed vs. amount of inserts" might have something to do with the problem) Thanks a lot Stefano

            > My current setting is"tokudb_cache_size = 12G", so I wouldn't expect it to go a lot beyond that - 15GB is definitely beyond my expectations.

            For 12G only tokudb cache 15Gb memory usage for the whole mysqld process seems fairly normal - there are bunch of other things mysqls uses/wastes memory on (like connection / sort buffers / other engines etc) and the 10.2.x/10.3.x series use a bit more ram anyways (might be just the changes in upstream).

            For testing purposes I would suggest setting the cache size to something smaller like 1G and then checking if the server starts to swap or at what point the used memory stabilises (before this patch (the way Mariadb was compiled/packed) the cache size didn't even matter and you hit OOM sooner or later anyways).

            p.s. It's also worth checking what Jemalloc version you are running - for example I found out that 5.0 (coming with OpenSuse Leap 15) makes the mysqld crash on shutdown which then makes the sytemd to restart the process into loop. With 5.1 ( https://github.com/jemalloc/jemalloc/releases/tag/5.1.0 ) haven't noticed any problems so far.

            Roze Reinis Rozitis added a comment - > My current setting is"tokudb_cache_size = 12G", so I wouldn't expect it to go a lot beyond that - 15GB is definitely beyond my expectations. For 12G only tokudb cache 15Gb memory usage for the whole mysqld process seems fairly normal - there are bunch of other things mysqls uses/wastes memory on (like connection / sort buffers / other engines etc) and the 10.2.x/10.3.x series use a bit more ram anyways (might be just the changes in upstream). For testing purposes I would suggest setting the cache size to something smaller like 1G and then checking if the server starts to swap or at what point the used memory stabilises (before this patch (the way Mariadb was compiled/packed) the cache size didn't even matter and you hit OOM sooner or later anyways). p.s. It's also worth checking what Jemalloc version you are running - for example I found out that 5.0 (coming with OpenSuse Leap 15) makes the mysqld crash on shutdown which then makes the sytemd to restart the process into loop. With 5.1 ( https://github.com/jemalloc/jemalloc/releases/tag/5.1.0 ) haven't noticed any problems so far.

            People

              serg Sergei Golubchik
              Peterdk Peter de Kraker
              Votes:
              17 Vote for this issue
              Watchers:
              27 Start watching this issue

              Dates

                Created:
                Updated:
                Resolved:

                Git Integration

                  Error rendering 'com.xiplink.jira.git.jira_git_plugin:git-issue-webpanel'. Please contact your Jira administrators.