Uploaded image for project: 'MariaDB Server'
  1. MariaDB Server
  2. MDEV-13403

Mariadb (with TokuDB) excessive memory usage/leak

Details

    Description

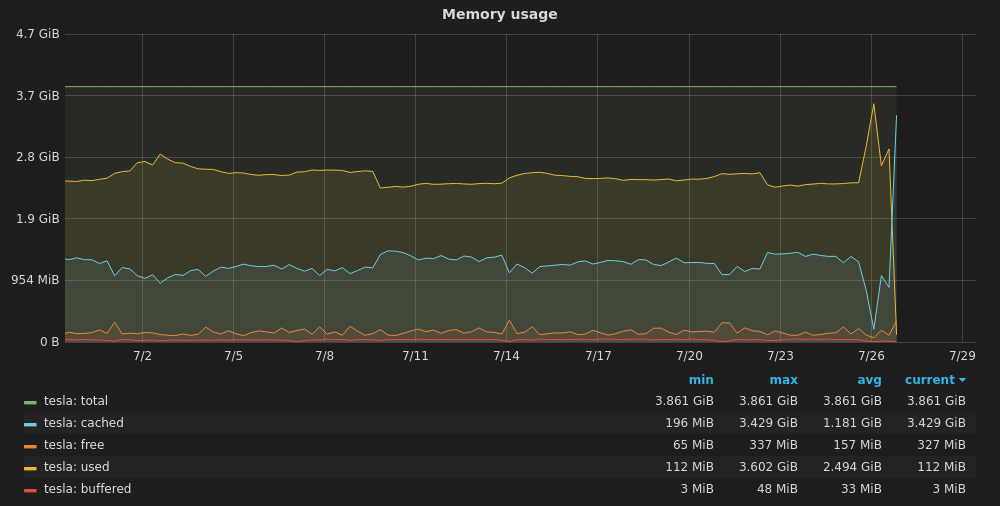
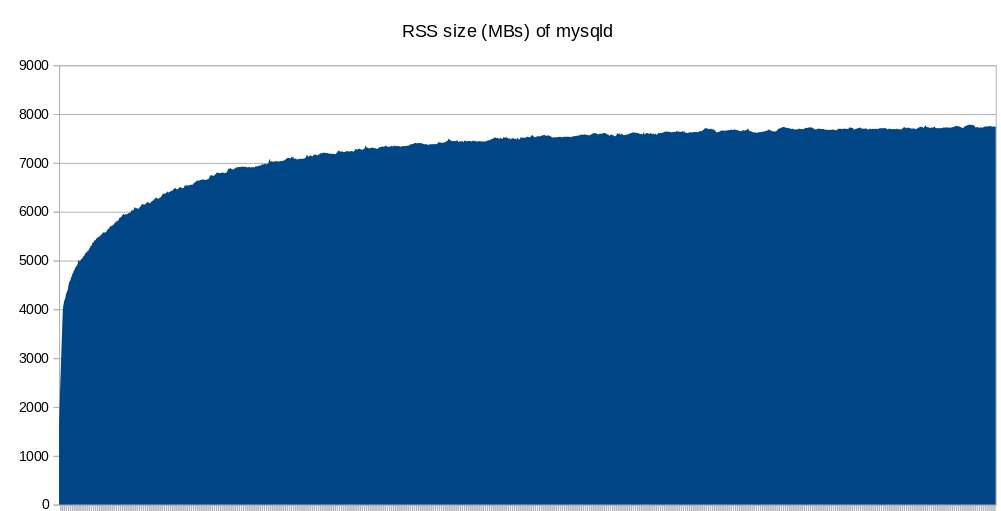
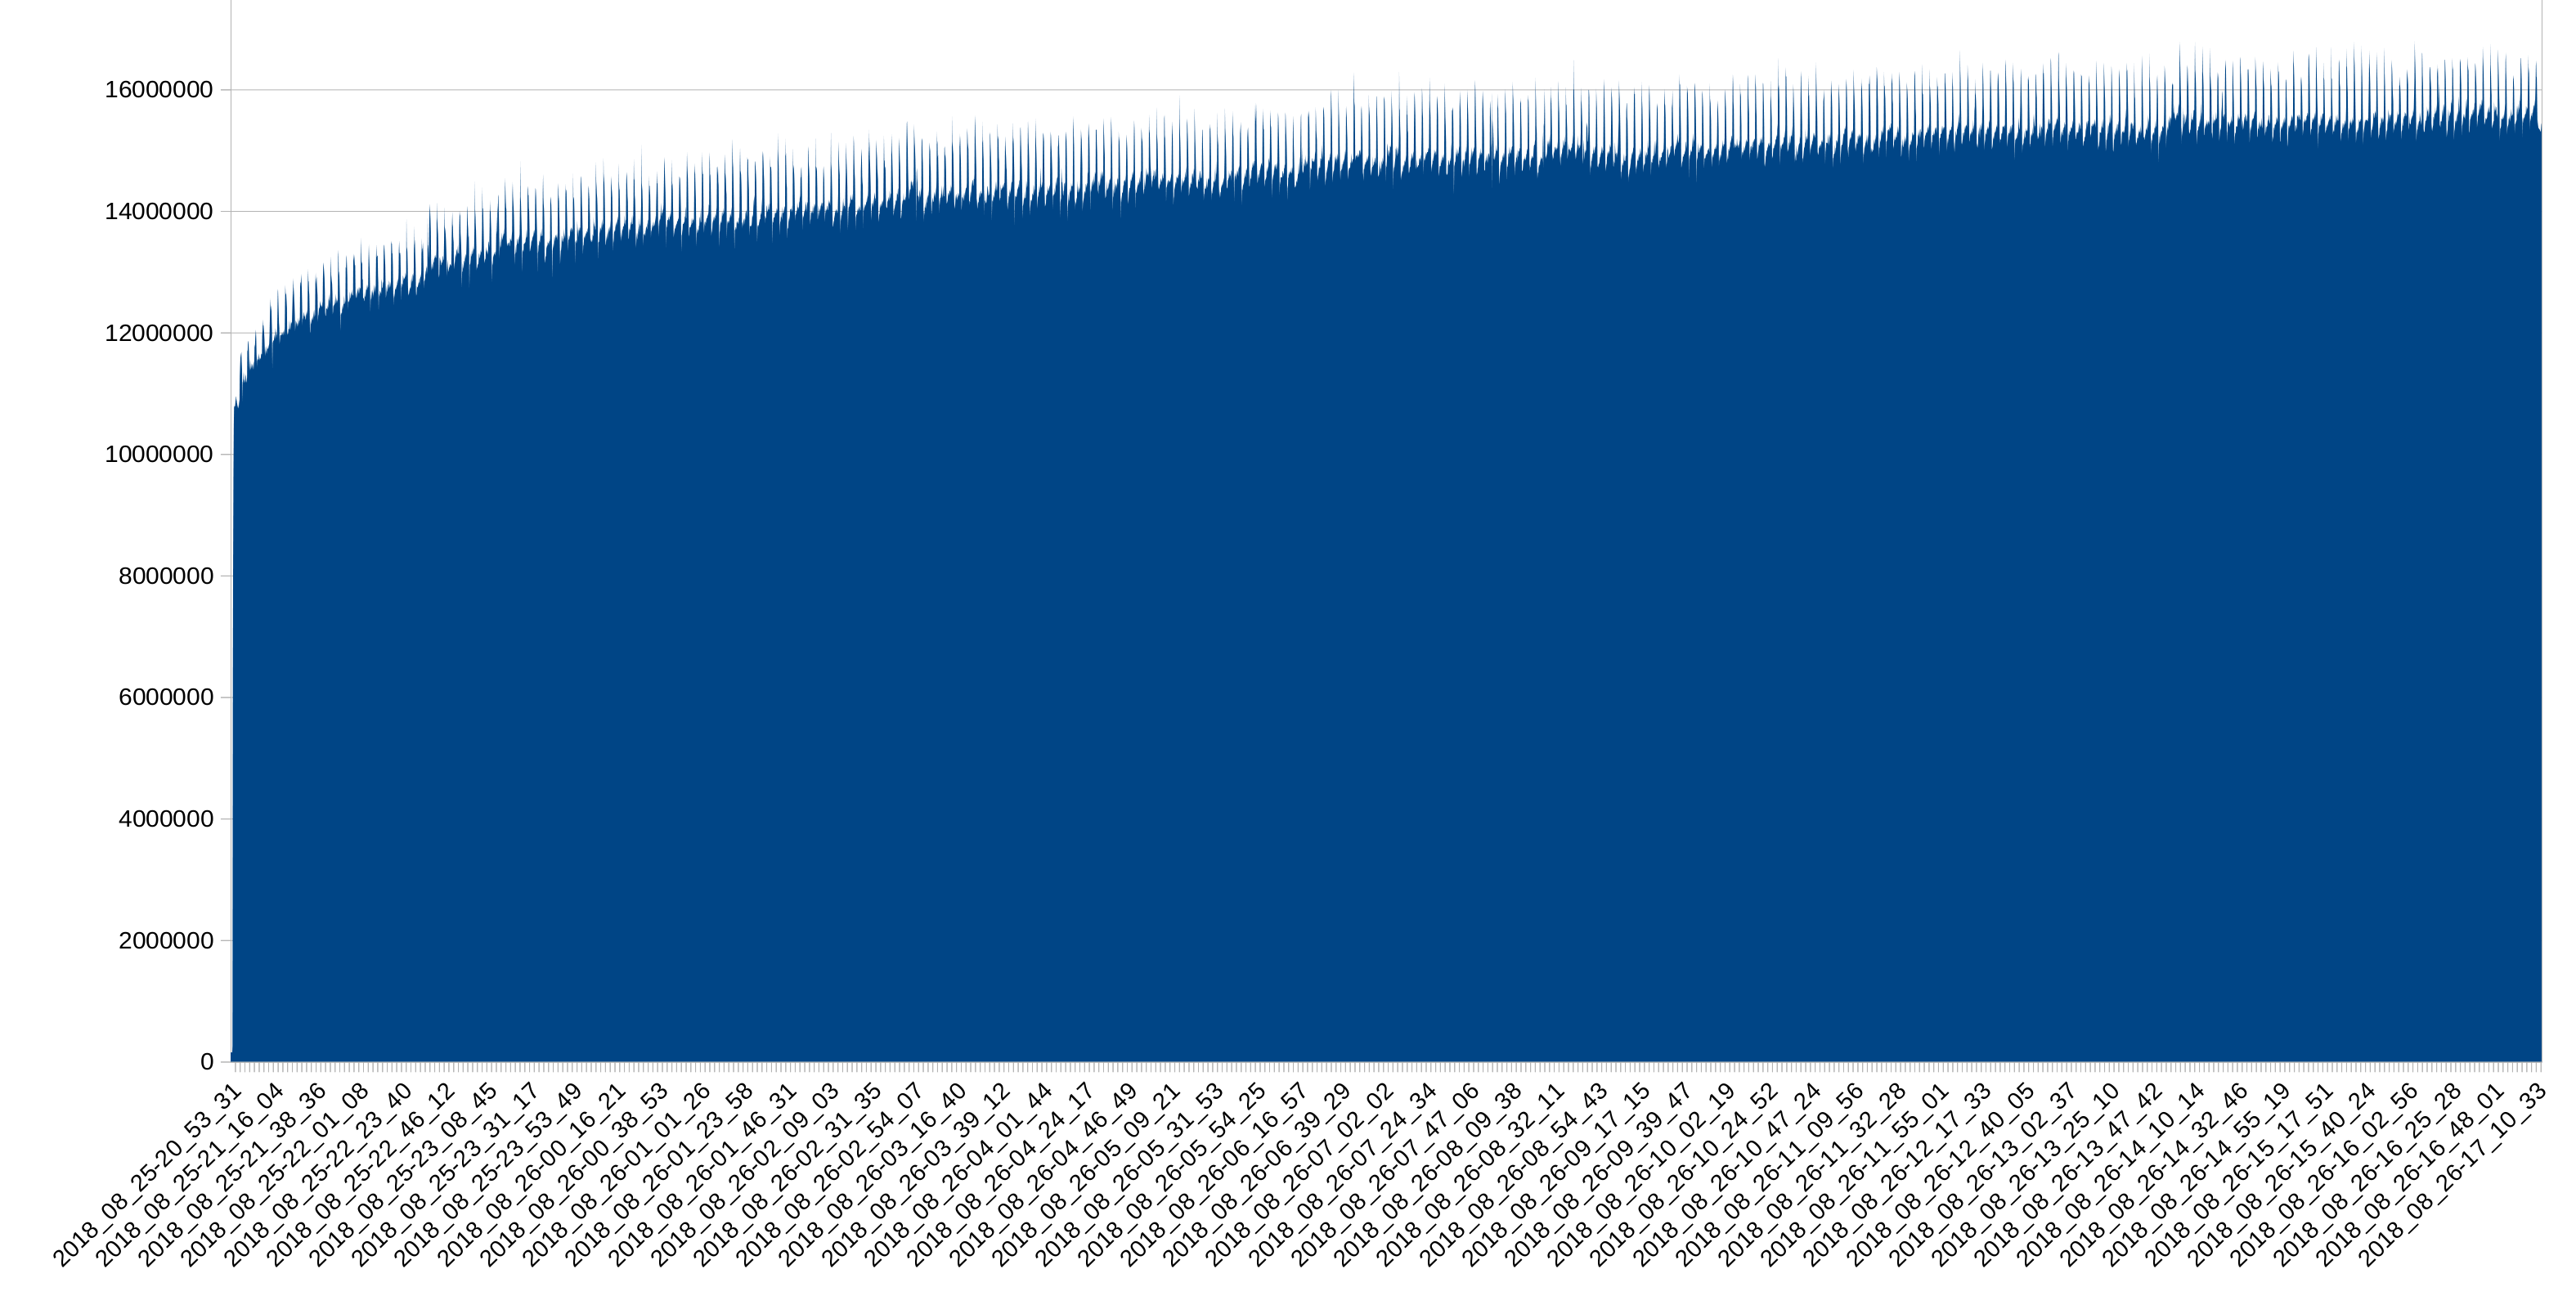
      We have been running MariaDB 10.1 with TokuDB on a Ubuntu 14.04 VPS with 4GB ram. This always worked fine. We recently updated to 10.2 and suddenly MariaDB started eating all the memory there is and also uses a lot of swap. We did upgrade our VPS to a Ubuntu 16.04 8 GB instance (not because of the problems, but just because that would improve performance). Here the issues continued.

      Settings did not change between te VPS instances, we only allocated 4GB ram to TokuDB instead of 2GB.

      Under the same workload 10.2 eats up all RAM (using 7/8GB ram + 2/8GB Swap) after 2 days, while under 10.1 the ram usage stayed in line with what you would expect.

      Unfortunately we can't go back to 10.1, since importing our dataset takes a week.

      Our database consists mainly of TokuDB tables, with one table having 9 billion rows. Other tables are in the lower million rows. Total size inclusing indexes is 900GB (uncompressed) and 300GB without indexes.
      Workload is lots of reads and inserts, but no deletes.
      Strangely the memory balloons most when running the daily stats gathering, which is almost a pure read query, except for some stats entries that get inserted.

      We do have a staging server that we can use to run valgrind massive on, and if necessary also on production, since the project is not very critical. However, we are still looking to reproduce the issue on the staging server. Also valgrind massive output does show a lot of '??' entries, even though we installed mariadb-server-core-dgbsym, mariadb-server-dbgsym and mariadb-plugins-tokudb-dbgsym.

      I will try to replicate the issue on the staging environment or otherwise use valgrind on production. However, I am not sure if massive option doesn't use much extra ram, making it hard to actually get to the ballooned ram issue.

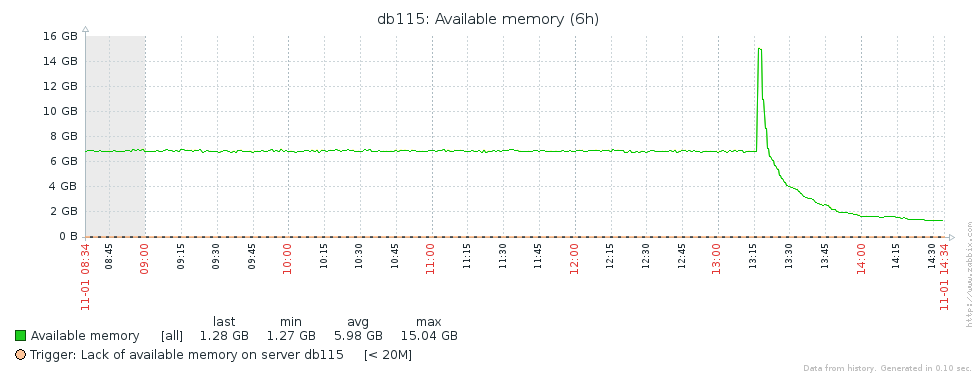
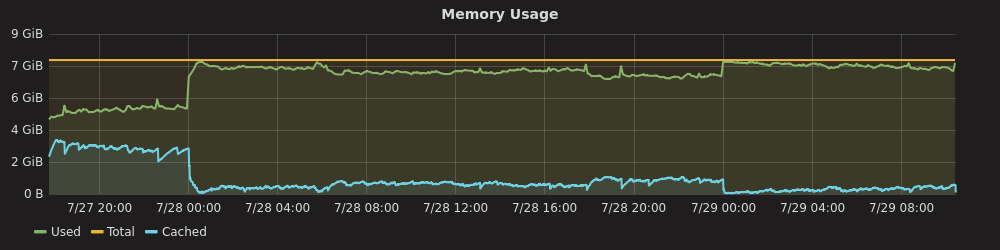
      I attached the most relevant output from mysql and some graphs from grafana.
      Let me know if you need more.

      Attachments

        1. 10.2.10_leak.png
          10.2.10_leak.png
          25 kB
        2. connections-memory-usage.txt
          1 kB
        3. dbserver-memory-usage.png
          dbserver-memory-usage.png
          36 kB
        4. dbserver-swap-usage.png
          dbserver-swap-usage.png
          20 kB
        5. dbserver-swap-usage.txt
          0.7 kB
        6. innodb-status.txt
          5 kB
        7. leak.png
          leak.png
          34 kB
        8. memory usage 1-day.png
          memory usage 1-day.png
          682 kB
        9. my.cnf
          2 kB
        10. my.cnf
          4 kB
        11. mysql-psaux.txt
          0.2 kB
        12. mysqltuner.txt
          3 kB
        13. old-version-older-server.png
          old-version-older-server.png
          62 kB
        14. status.txt
          88 kB
        15. stefano-1-ps-mysqld-rss.png
          stefano-1-ps-mysqld-rss.png
          19 kB
        16. stefano-1-ps-mysqld-rss.txt
          185 kB
        17. stefano-mariadb-10_02_16-ram-20180825.png
          stefano-mariadb-10_02_16-ram-20180825.png
          204 kB
        18. tokudb.cnf
          0.1 kB
        19. tokudb-status.txt
          46 kB

        Issue Links

          Activity

            mariodb Stefano added a comment -

            Thanks Sergei
            Sorry for the complaining post - I was very tired and frustrated after 48hrs of debugging and up&downgrading & testing multiple config settings => realizing that I had no way out and deciding to export and then later import all data (to downgrade) was the final heavy hit.

            I'm currently downgrading back to 10.1(.33) mainly because I noticed that I had non-optimal insert-performance as well with the old 10.2.15 (when I wrote the above post I did not realize that I did not have to export+import again everything to do a minor downgrade) and as well with 10.3.8 (the major upgrade was my final hope...) => I therefore suppose that some change done in 10.2/3 is causing this.
            I'll then upgrade to 10.1.35 whenever it becomes available (I need a bugfix which is included there) and then I think that I'll try to stay on 10.1.35 hoping that I don't need anything new.

            Yes, I will try to simplify and reproduce the "good vs bad" performance (in VMs) and then post a bug report.

            I will shut up about the memory leak for the time being as long as nobody else complains and I don't have to upgrade to 10.2/3

            Cheers and thanks a lot for your help.

            mariodb Stefano added a comment - Thanks Sergei Sorry for the complaining post - I was very tired and frustrated after 48hrs of debugging and up&downgrading & testing multiple config settings => realizing that I had no way out and deciding to export and then later import all data (to downgrade) was the final heavy hit. I'm currently downgrading back to 10.1(.33) mainly because I noticed that I had non-optimal insert-performance as well with the old 10.2.15 (when I wrote the above post I did not realize that I did not have to export+import again everything to do a minor downgrade) and as well with 10.3.8 (the major upgrade was my final hope...) => I therefore suppose that some change done in 10.2/3 is causing this. I'll then upgrade to 10.1.35 whenever it becomes available (I need a bugfix which is included there) and then I think that I'll try to stay on 10.1.35 hoping that I don't need anything new. Yes, I will try to simplify and reproduce the "good vs bad" performance (in VMs) and then post a bug report. I will shut up about the memory leak for the time being as long as nobody else complains and I don't have to upgrade to 10.2/3 Cheers and thanks a lot for your help.

            Can confirm that with 10.2.16 the leak/excessive memory usage is gone.
            (tested on several databases/datasets which hit OOM few minutes later with versions 10.2.5+, now 10.2.16 running for several days within constant memory amount/limits without a problem).

            Thank you for the fix.

            Roze Reinis Rozitis added a comment - Can confirm that with 10.2.16 the leak/excessive memory usage is gone. (tested on several databases/datasets which hit OOM few minutes later with versions 10.2.5+, now 10.2.16 running for several days within constant memory amount/limits without a problem). Thank you for the fix.

            We are running MariaDB 10.3.7 with tokudb 5.6.39-83.1 on Debian 9 and we are experiencing exactly the same problem. It seems that all queries drive memory up, which is never released, but some big selects on very large tables (400 million rows) like this:
            select * from x where y in (4000 strings here)
            can increase memory usage by several GB instantaneously that are never released. A few consecutive invocations of this query will crash mysqld.

            mhadji@gmail.com Marios Hadjieleftheriou added a comment - We are running MariaDB 10.3.7 with tokudb 5.6.39-83.1 on Debian 9 and we are experiencing exactly the same problem. It seems that all queries drive memory up, which is never released, but some big selects on very large tables (400 million rows) like this: select * from x where y in (4000 strings here) can increase memory usage by several GB instantaneously that are never released. A few consecutive invocations of this query will crash mysqld.
            mariodb Stefano added a comment - - edited

            Hi all
            Sorry, I still have to complain, ggghhh
            I'm still seeing high RAM usage.
            And sorry, I did not do any "clean" tests yet - I just felt I had to post what I knew so far (so many stability problems with MariaDB so far => starting to turn my attention towards Apache Kudu & Yandex Clickhouse...).

            It's definitely not as obviously visible as with versions equal/lower than 10.2.15, but in my opinion the problem is still there.

            Attaching the file "stefano-mariadb-10_02_16-ram-20180825.png":

            The graph shows the RSS allocation from a clean start up to ~2.5 billion inserts (2'537'827'547) (some very few selects & updates were executed as well, but at most 0.001% of all DMLs).

            My current setting is"tokudb_cache_size = 12G", so I wouldn't expect it to go a lot beyond that - 15GB is definitely beyond my expectations. Sometimes it went up to 26 GBs, but I've always been able to shut it down before it started doing some serious swapping.

            I admit that the graph isn't very exciting, but I've seen numbers grow a lot faster under certain conditions (e.g. concurrent queries like "insert into [my_isam_table] select a_single_column from [my_tokudb_tbl]>" + "insert into [my_VEC_table] select some, other, cols from [my_tokudb_tbl]" made my 32GB server start swapping within minutes - sorry, I did not repeat the experiment.

            MariaDB 10.1 (used mostly 10.1.34) did not have this problem but totally hanged after ~1 days of continuous "insert"s with no kind of hint of "why" anywhere => I usually had to "kill -9 xxx" the mariadb-process & start it & wait for a recovery", so from this point of view the 10.2-series is better (no hard hangs even after having processed the same amount of data as the 10.1-series) but for me it's still ultimately unstable.

            (btw. when using TokuDB the insert-rate with the 10.1-series is still 10-20% faster than with 10.2/3-series; looks like 10.2/3 uses max 25-50-75% of the available vCPUs for the checkpoints, but this is another issue...)

            Question:
            is anybody doing at least ~1 million "inserts" upwards per minute for an extended amount of time (hours, days, weeks) and if yes, do you see any suspicious RAM allocation/behaviour?
            (asking this because the factor of "time elapsed vs. amount of inserts" might have something to do with the problem)
            Thanks a lot
            Stefano

            mariodb Stefano added a comment - - edited Hi all Sorry, I still have to complain, ggghhh I'm still seeing high RAM usage. And sorry, I did not do any "clean" tests yet - I just felt I had to post what I knew so far (so many stability problems with MariaDB so far => starting to turn my attention towards Apache Kudu & Yandex Clickhouse...). It's definitely not as obviously visible as with versions equal/lower than 10.2.15, but in my opinion the problem is still there. Attaching the file "stefano-mariadb-10_02_16-ram-20180825.png": The graph shows the RSS allocation from a clean start up to ~2.5 billion inserts (2'537'827'547) (some very few selects & updates were executed as well, but at most 0.001% of all DMLs). My current setting is"tokudb_cache_size = 12G", so I wouldn't expect it to go a lot beyond that - 15GB is definitely beyond my expectations. Sometimes it went up to 26 GBs, but I've always been able to shut it down before it started doing some serious swapping. I admit that the graph isn't very exciting, but I've seen numbers grow a lot faster under certain conditions (e.g. concurrent queries like "insert into [my_isam_table] select a_single_column from [my_tokudb_tbl] >" + "insert into [my_VEC_table] select some, other, cols from [my_tokudb_tbl] " made my 32GB server start swapping within minutes - sorry, I did not repeat the experiment. MariaDB 10.1 (used mostly 10.1.34) did not have this problem but totally hanged after ~1 days of continuous "insert"s with no kind of hint of "why" anywhere => I usually had to "kill -9 xxx" the mariadb-process & start it & wait for a recovery", so from this point of view the 10.2-series is better (no hard hangs even after having processed the same amount of data as the 10.1-series) but for me it's still ultimately unstable. (btw. when using TokuDB the insert-rate with the 10.1-series is still 10-20% faster than with 10.2/3-series; looks like 10.2/3 uses max 25-50-75% of the available vCPUs for the checkpoints, but this is another issue...) Question: is anybody doing at least ~1 million "inserts" upwards per minute for an extended amount of time (hours, days, weeks) and if yes, do you see any suspicious RAM allocation/behaviour? (asking this because the factor of "time elapsed vs. amount of inserts" might have something to do with the problem) Thanks a lot Stefano

            > My current setting is"tokudb_cache_size = 12G", so I wouldn't expect it to go a lot beyond that - 15GB is definitely beyond my expectations.

            For 12G only tokudb cache 15Gb memory usage for the whole mysqld process seems fairly normal - there are bunch of other things mysqls uses/wastes memory on (like connection / sort buffers / other engines etc) and the 10.2.x/10.3.x series use a bit more ram anyways (might be just the changes in upstream).

            For testing purposes I would suggest setting the cache size to something smaller like 1G and then checking if the server starts to swap or at what point the used memory stabilises (before this patch (the way Mariadb was compiled/packed) the cache size didn't even matter and you hit OOM sooner or later anyways).

            p.s. It's also worth checking what Jemalloc version you are running - for example I found out that 5.0 (coming with OpenSuse Leap 15) makes the mysqld crash on shutdown which then makes the sytemd to restart the process into loop. With 5.1 ( https://github.com/jemalloc/jemalloc/releases/tag/5.1.0 ) haven't noticed any problems so far.

            Roze Reinis Rozitis added a comment - > My current setting is"tokudb_cache_size = 12G", so I wouldn't expect it to go a lot beyond that - 15GB is definitely beyond my expectations. For 12G only tokudb cache 15Gb memory usage for the whole mysqld process seems fairly normal - there are bunch of other things mysqls uses/wastes memory on (like connection / sort buffers / other engines etc) and the 10.2.x/10.3.x series use a bit more ram anyways (might be just the changes in upstream). For testing purposes I would suggest setting the cache size to something smaller like 1G and then checking if the server starts to swap or at what point the used memory stabilises (before this patch (the way Mariadb was compiled/packed) the cache size didn't even matter and you hit OOM sooner or later anyways). p.s. It's also worth checking what Jemalloc version you are running - for example I found out that 5.0 (coming with OpenSuse Leap 15) makes the mysqld crash on shutdown which then makes the sytemd to restart the process into loop. With 5.1 ( https://github.com/jemalloc/jemalloc/releases/tag/5.1.0 ) haven't noticed any problems so far.

            People

              serg Sergei Golubchik
              Peterdk Peter de Kraker
              Votes:
              17 Vote for this issue
              Watchers:
              27 Start watching this issue

              Dates

                Created:
                Updated:
                Resolved:

                Git Integration

                  Error rendering 'com.xiplink.jira.git.jira_git_plugin:git-issue-webpanel'. Please contact your Jira administrators.