Uploaded image for project: 'MariaDB ColumnStore'
  1. MariaDB ColumnStore
  2. MCOL-4849

Optimize ExeMgr to reduce a number of context switches

Details

    • New Feature
    • Status: Closed (View Workflow)
    • Major
    • Resolution: Fixed
    • 6.1.1
    • 6.2.2
    • ExeMgr
    • None

    Description

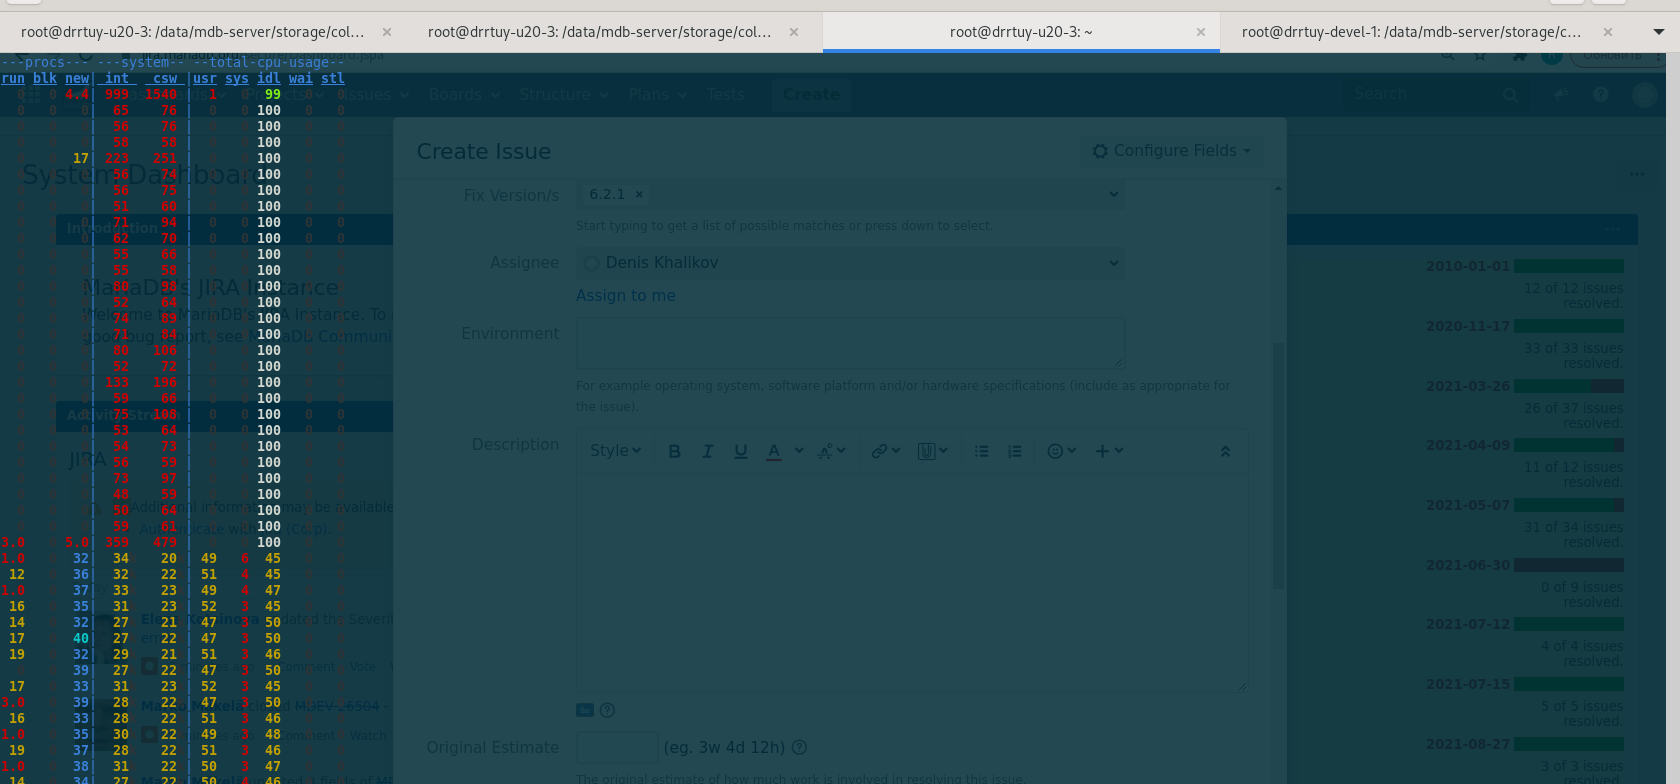
      MCS generates enourmous amount of context switches that degrades performance a lot. The screenshoot cs.png demonstates this, namely cs number raises from ~80 to 21k once I run a single query(select l_orderkey, count(l_orderkey) from lineitem group by l_orderkey limit 10) in an infinite loop.
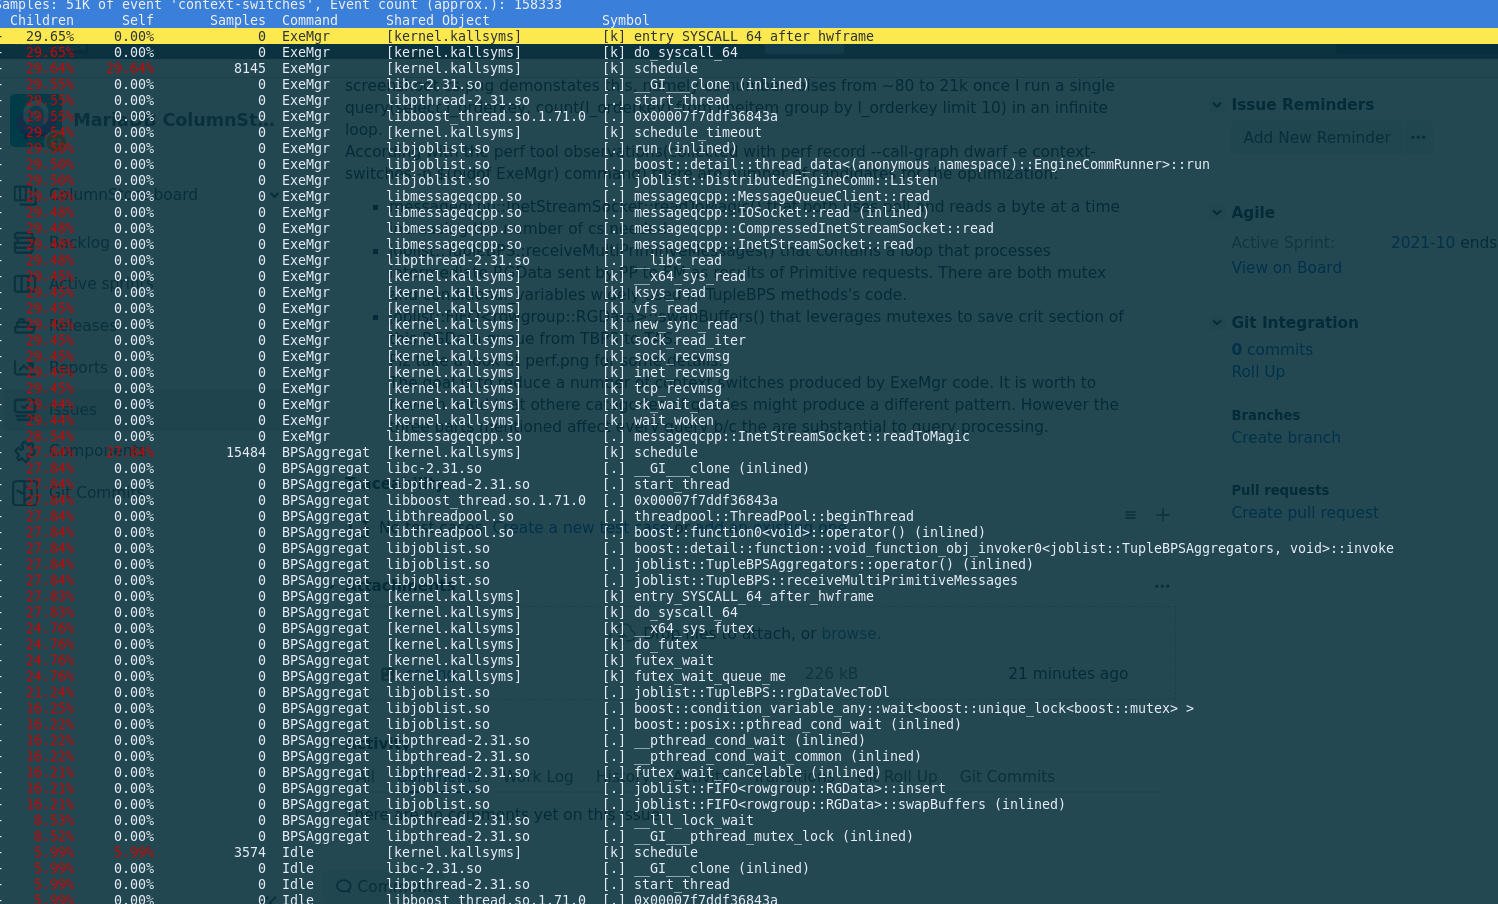
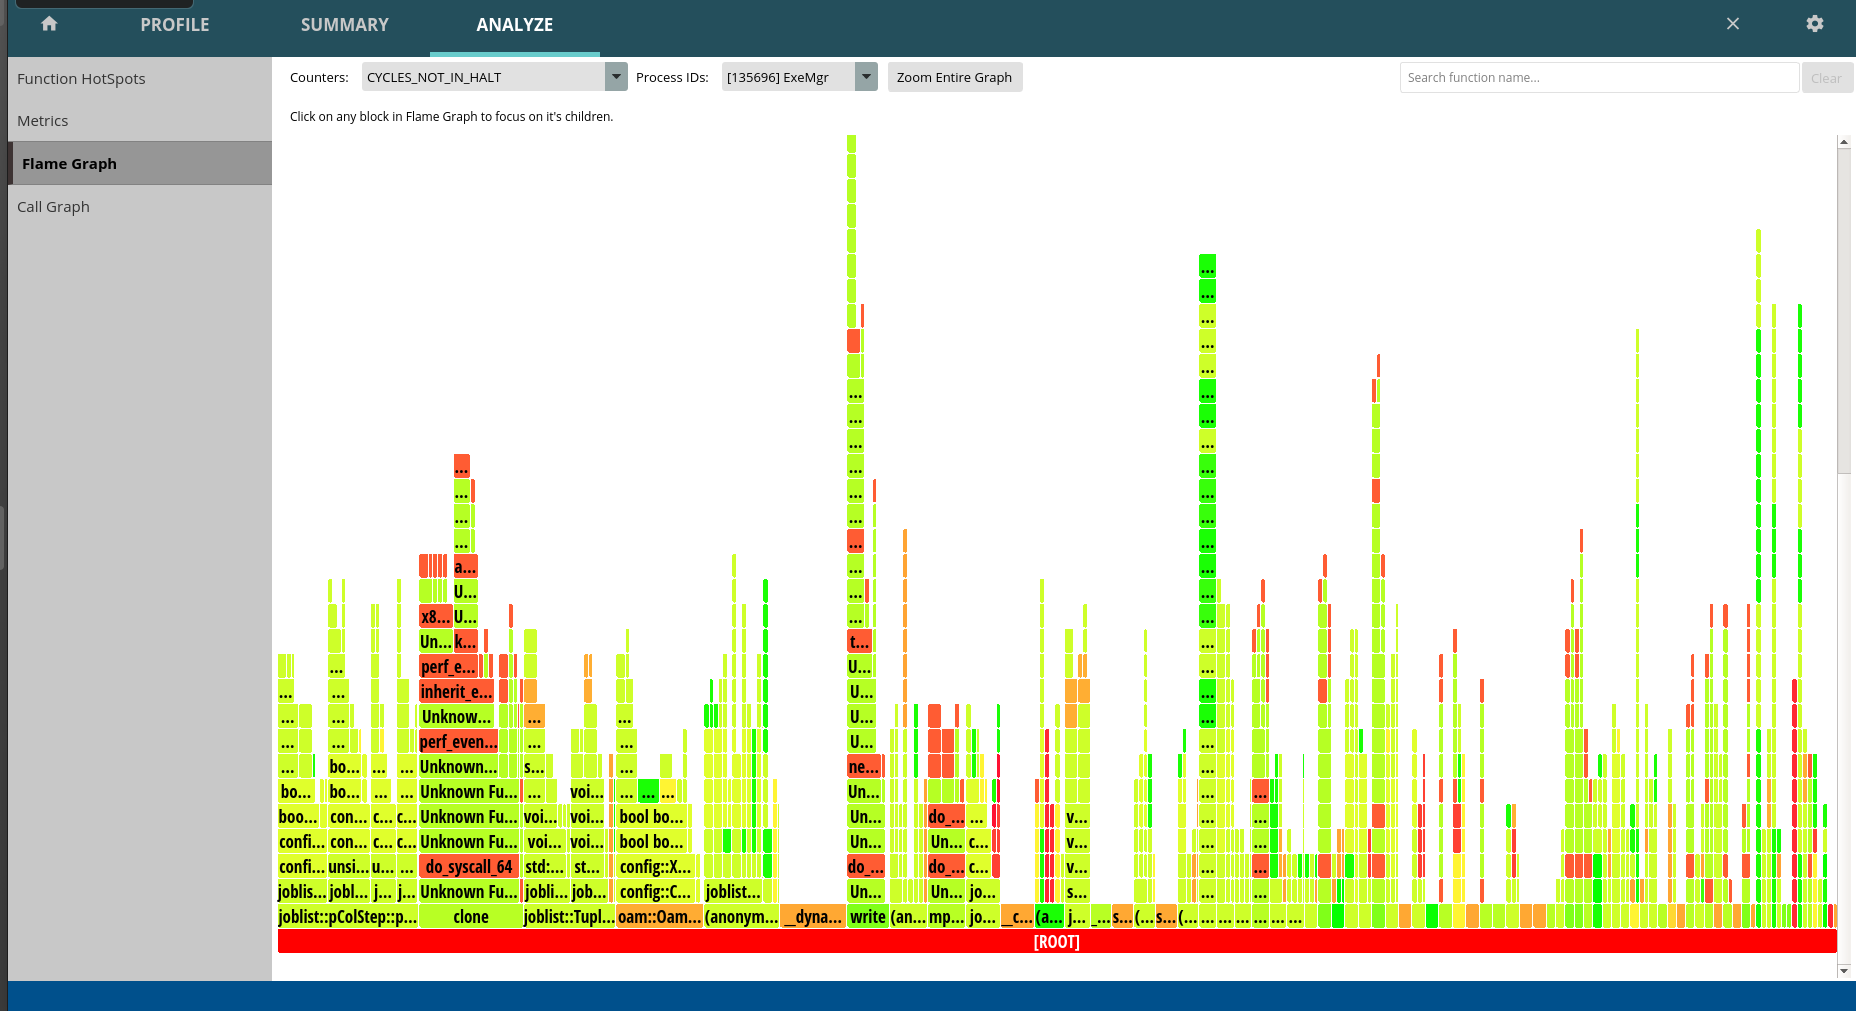
      According with the perf tool observations(collected with perf record --call-graph dwarf -e context-switches -p $(pidof ExeMgr) command) there are number of candidates for the optimization:

      • messageqcpp::InetStreamSocket::readToMagic() that both uses poll and reads a byte at a time increasing the number of cs needed.
      • joblist::TupleBPS::receiveMultiPrimitiveMessages() that contains a loop that processes intermediate RGData sent by PP to EM as results of Primitive requests. There are both mutex and conditional_variables widely used in TupleBPS methods's code.
      • joblist::FIFO<rowgroup::RGData>::swapBuffers() that leverages mutexes to save crit section of this RGData queue from TBPS to TAS.
        Plz take a look at perf.png for some details.
        The goal is to reduce a number of context switches produced by ExeMgr code. It is worth to have in mind that othere categories of queries might produce a different pattern. However the three parts mentioned affect every query b/c the are substantial to query processing.

      Attachments

        1. cs.png
          cs.png
          226 kB
        2. graph.svg
          23 kB
        3. perf.png
          perf.png
          485 kB
        4. profile.txt
          109 kB
        5. Screenshot from 2021-09-01 20-22-08.png
          Screenshot from 2021-09-01 20-22-08.png
          119 kB

        Issue Links

          Activity

            Build tested: 6.2.2 (#3334, #3335)

            Build performance compared to release 6.1.1

            Build #3334
               DBT3 performance
                  Disk-run   is 10.05% faster
                  Cached-run is 10.84% faster
             
               CPImport is       5.71% faster
               LDI is            1.03% faster
               insertSelect is   2.42% faster
             
            Build #3335
               DBT3 performance
                  Disk-run   is 10.69% faster
                  Cached-run is 12.07% faster
             
               CPImport is       1.43% faster
               LDI is            1.20% faster
               insertSelect is   2.76% faster


            Detailed performance test result can be found here:

            https://docs.google.com/spreadsheets/d/1tznQqmpKfkbnn4HjfjYIIeowJlQpNlHj8PVI6QM-3mc/edit?usp=sharing

            dleeyh Daniel Lee (Inactive) added a comment - Build tested: 6.2.2 (#3334, #3335) Build performance compared to release 6.1.1 Build #3334 DBT3 performance Disk-run is 10.05% faster Cached-run is 10.84% faster   CPImport is 5.71% faster LDI is 1.03% faster insertSelect is 2.42% faster   Build #3335 DBT3 performance Disk-run is 10.69% faster Cached-run is 12.07% faster   CPImport is 1.43% faster LDI is 1.20% faster insertSelect is 2.76% faster Detailed performance test result can be found here: https://docs.google.com/spreadsheets/d/1tznQqmpKfkbnn4HjfjYIIeowJlQpNlHj8PVI6QM-3mc/edit?usp=sharing

            People

              dleeyh Daniel Lee (Inactive)
              drrtuy Roman
              Votes:
              0 Vote for this issue
              Watchers:
              3 Start watching this issue

              Dates

                Created:
                Updated:
                Resolved:

                Git Integration

                  Error rendering 'com.xiplink.jira.git.jira_git_plugin:git-issue-webpanel'. Please contact your Jira administrators.