Details
-
Bug
-
Status: Closed (View Workflow)
-
Critical
-
Resolution: Fixed
-
5.5(EOL), 10.0(EOL), 10.1(EOL), 10.2(EOL)
-
10.2.1-1, 10.2.1-2, 5.5.50, 10.1.15, 10.2.4-1, 10.1.21
Description
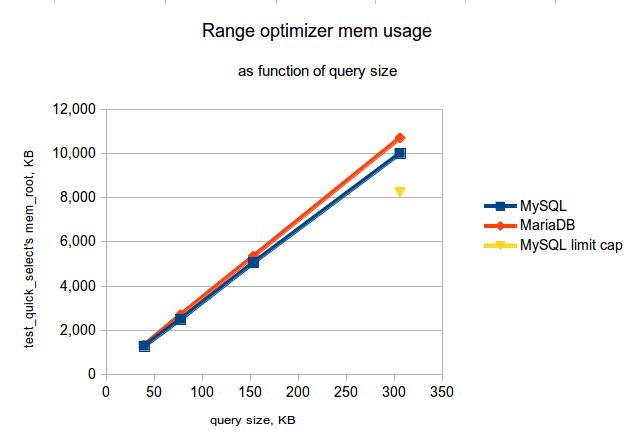
`Unlike MySQL 5.6 (that provides eq_range_index_dive_limit server variable) and MySQL 5.7 (that additionally provides range_optimizer_max_mem_size server variable) MariaDB 10.x does NOT limit memory used for range optimization in any way (neither directly nor indirectly).
As a result, for some queries with huge list of value in the IN () list in the WHERE clause (having number of items comparable to the number of rows in the table) MariaDB 10.x does not only execute the query longer than MySQL 5.6 and 5.7 with default settings (as it spends more time on query optimization), but also uses a lot of memory in the process (see https://bugs.mysql.com/bug.php?id=78973 for some estimations and links). With many concurrent connections running this kind of queries we may easily end up with OOM condition for the mysqld process.
Consider a table like this:
create table t (id bigint not null auto_increment, ts datetime, primary key(id,ts)) engine=InnoDB; |
insert into t(ts) values(now()); |
replace into t(ts) select now() from t t1, t t2, t t3, t t4, t t5, t t6, t t7, t t8, t t9, t t10, t t11, t t12, t t13, t t14, t t15,t t16, t t17, t t18; |
analyze table t; |
and a query like this:
SELECT * FROM t WHERE id IN (10000,10001,10002, ... 54106,54107); |
Run the query on different versions of MySQL and MariaDB, compare execution times and memory used in the process. It may be easier to see the memory impact on versions that do not allow to monitor memory used per session or "state" by running many copies of the same query concurrently using mysqlslap, for example.
Attachments
Issue Links
- relates to
-
MDEV-11574 Queries with IN clauses that are pushing the optimizer to its limit
-
- Closed
-
-
MDEV-9750 Quick memory exhaustion with 'extended_keys=on' on queries having multiple 'IN'/'NOT IN' using InnoDB
-
- Closed
-
-
MDEV-10046 InnoDB Range Optimizer Regression
-
- Open
-
-
MDEV-10175 range optimizer calls records_in_range() for full extended keys
-
- Closed
-
-
MDEV-11309 MariaDB server restarts every night (at least, sometimes more) for no apparent reason
-
- Closed
-
-
MDEV-23634 Select query hanged the server and leads to OOM in MariaDB 10.4.14
-
- Closed
-
- mentioned in
-
Page Loading...
I've checked today with recent MariaDB 10.1.13 built from current sources on my QuadCore box. I've got the following results:
Execution of the query:
...
| 54107 | 2016-03-21 11:43:03 |
+-------+---------------------+
43238 rows in set (0.45 sec)
Then I've executed mysqlslap like this:
mysqlslap -uroot --concurrency=100 --iterations=100 --create-schema=test --query=/tmp/query.sql --delimiter=";" --socket=/tmp/mysql.sock
and in another session got the following on memory usage:
MariaDB [test]> select sum(memory_used)/1024/1024, state, count(*), max(Time), avg(Time) FROM information_schema.processlist group by state with rollup;
+----------------------------+----------------------+----------+-----------+-----------+
| sum(memory_used)/1024/1024 | state | count(*) | max(Time) | avg(Time) |
+----------------------------+----------------------+----------+-----------+-----------+
| 0.06581116 | | 1 | 5 | 5.0000 |
| 0.08060455 | Filling schema table | 1 | 0 | 0.0000 |
| 2235.60366058 | statistics | 100 | 5 | 5.0000 |
| 2235.75007629 | NULL | 102 | 5 | 4.9510 |
+----------------------------+----------------------+----------+-----------+-----------+
4 rows in set (2.09 sec)
MariaDB [test]> select sum(memory_used)/1024/1024, state, count(*), max(Time), avg(Time) FROM information_schema.processlist group by state with rollup;
+----------------------------+----------------------+----------+-----------+-----------+
| sum(memory_used)/1024/1024 | state | count(*) | max(Time) | avg(Time) |
+----------------------------+----------------------+----------+-----------+-----------+
| 0.06581116 | | 1 | 25 | 25.0000 |
| 0.08060455 | Filling schema table | 1 | 0 | 0.0000 |
| 24.48434448 | preparing | 2 | 25 | 24.5000 |
| 673.31947327 | Sending data | 55 | 25 | 24.6909 |
| 1968.40044403 | statistics | 31 | 25 | 24.2258 |
| 2666.35067749 | NULL | 90 | 25 | 24.2556 |
+----------------------------+----------------------+----------+-----------+-----------+
6 rows in set (0.08 sec)
Then mysqld process was killed by OOM killer:
2016-03-21 11:42:12 140198044989504 [Note] /home/openxs/dbs/maria10.1/bin/mysqld: ready for connections.
Version: '10.1.13-MariaDB' socket: '/tmp/mysql.sock' port: 3306 Source distribution
160321 11:48:51 mysqld_safe Number of processes running now: 0
160321 11:48:51 mysqld_safe mysqld restarted
2016-03-21 11:48:51 140211571005504 [Note] /home/openxs/dbs/maria10.1/bin/mysqld (mysqld 10.1.13-MariaDB) starting as process 11422 ...
[openxs@fc23 maria10.1]$ journalctl -b | grep mysqld
Mar 21 11:48:46 fc23 kernel: mysqld invoked oom-killer: gfp_mask=0x24280ca, order=0, oom_score_adj=0
Mar 21 11:48:47 fc23 kernel: mysqld cpuset=/ mems_allowed=0
Mar 21 11:48:47 fc23 kernel: CPU: 3 PID: 11330 Comm: mysqld Not tainted 4.4.4-301.fc23.x86_64 #1
Mar 21 11:48:49 fc23 kernel: [10505] 1000 10505 29781 111 11 3 0 0 mysqld_safe
Mar 21 11:48:49 fc23 kernel: [10567] 1000 10567 2122745 1704741 3440 12 0 0 mysqld
Mar 21 11:48:49 fc23 kernel: Out of memory: Kill process 10567 (mysqld) score 839 or sacrifice child
Mar 21 11:48:49 fc23 kernel: Killed process 10567 (mysqld) total-vm:8490980kB, anon-rss:6818988kB, file-rss:0kB
With Percona Server 5.6.28-76.1 built from source on the same hardware I've got the following execution time:
...
| 54107 | 2016-03-21 11:55:08 |
+-------+---------------------+
43238 rows in set (0.24 sec)
and memory usage while the same mysqlsap was running the query in 100 connections based on top was like this:
11793 openxs 20 0 5409252 4.062g 15772 S 378.4 52.3 0:40.17 mysqld
...
11793 openxs 20 0 5634456 4.509g 15772 S 384.1 58.1 2:12.86 mysqld
...
11793 openxs 20 0 5739204 4.518g 15772 S 379.4 58.2 22:50.10 mysqld
...
11793 openxs 20 0 5853164 4.671g 15772 S 380.7 60.2 53:07.90 mysqld
The command completed successfully:
[openxs@fc23 p5.6]$ bin/mysqlslap -uroot --concurrency=100 --iterations=100 --create-schema=test --query=/tmp/query.sql --delimiter=";" --socket=/tmp/mysql.sock
Benchmark
Average number of seconds to run all queries: 8.560 seconds
Minimum number of seconds to run all queries: 8.344 seconds
Maximum number of seconds to run all queries: 16.744 seconds
Number of clients running queries: 100
Average number of queries per client: 1
The system used for testing was like this:
[openxs@fc23 percona-toolkit]$ bin/pt-summary
# Percona Toolkit System Summary Report ######################
Date | 2016-03-21 10:08:35 UTC (local TZ: EET +0200)
Hostname | fc23
Uptime | 1:38, 3 users, load average: 61.94, 58.26, 36.55
Platform | Linux
Release | Fedora release 23 (Twenty Three)
Kernel | 4.4.4-301.fc23.x86_64
Architecture | CPU = 64-bit, OS = 64-bit
Threading | NPTL 2.22
SELinux | Enforcing
Virtualized | No virtualization detected
# Processor ##################################################
Processors | physical = 1, cores = 4, virtual = 4, hyperthreading = no
Speeds | 4x2499.000
Models | 4xIntel(R) Core(TM)2 Quad CPU Q8300 @ 2.50GHz
Caches | 4x2048 KB
# Memory #####################################################
Total | 7.8G
Free | 1.7G
Used | physical = 5.3G, swap allocated = 0.0, swap used = 0.0, virtual = 5.3G
Buffers | 795.5M
Caches | 2.2G
Dirty | 49416 kB
UsedRSS | 5.3G
Swappiness | 60
DirtyPolicy | 20, 10
DirtyStatus | 0, 0
...