Uploaded image for project: 'MariaDB Server'
  1. MariaDB Server
  2. MDEV-34863

RAM Usage Changed Significantly Between 10.11 Releases

Details

    Description

      We run a pretty large database (about 5.5TB currently), and we were running into issues with the growing history list length that was well known under 10.11.6.

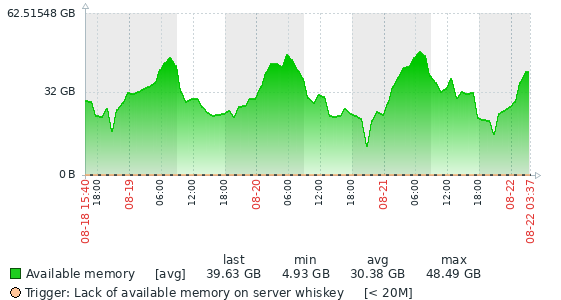
      We upgraded to 10.11.9 (10.11.8 first on some servers), and we immediately noticed that the memory usage was wildly different. 10.11.6 seemed very good at freeing memory, and it was great to see an accurate representation of how many resources the servers are actually using.

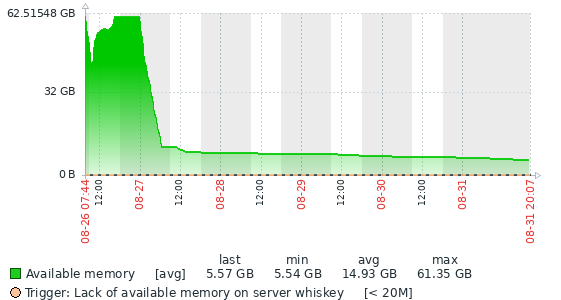
      With 10.11.9, you can see that the graph does a reverse hockey stick. It maximizes allocated memory based on innodb_buffer_pool_size, and then stays occupied, hardly fluctuating.

      We had seen this same kind of usage in MariaDB 10.3 and 10.6, so it was really nice when earlier 10.11 had what looked like much more robust memory handling. We wouldn't have a big problem with it except that one of our replicas unexpectedly OOMed over the weekend.

      So, what changed from 10.11.6 to 10.11.8? Is there a way to set more aggressive memory management?

      Attachments

        Issue Links

          Activity

            suwalski Pat Suwalski added a comment -

            Reviewing the changelogs for 10.11.7 and 10.11.8, all I can see is an entry for 10.11.7:

            suwalski Pat Suwalski added a comment - Reviewing the changelogs for 10.11.7 and 10.11.8, all I can see is an entry for 10.11.7: Memory pressure ( MDEV-24670 )

            I’m glad to know that the history list length is not that much of a problem for you anymore. MDEV-34515 in the upcoming releases should improve that further.

            What exactly are the graphs displaying? Is it the MemAvailable in Linux /proc/meminfo? That would seem to reflect the available memory, including any portion that might be used for file system cache.

            To diagnose memory usage, it would be helpful to have more detail on the mariadbd process. Can you provide a graph that contains things like the total virtual memory size of the process as well as some global status variables, such as innodb_buffer_pool_pages_data and innodb_buffer_pool_pages_free? That should look a bit like the oltp_ts_*.png attached to MDEV-23855, partly with different counters. If those graphs look stable, then we would have to search for a memory leak or fragmentation somewhere, most likely outside InnoDB.

            What MDEV-24670 aims to do is to free pages from the InnoDB buffer pool in case a memory pressure event is reported by the operating system, to make it more immune to out-of-memory kills.

            marko Marko Mäkelä added a comment - I’m glad to know that the history list length is not that much of a problem for you anymore. MDEV-34515 in the upcoming releases should improve that further. What exactly are the graphs displaying? Is it the MemAvailable in Linux /proc/meminfo ? That would seem to reflect the available memory, including any portion that might be used for file system cache. To diagnose memory usage, it would be helpful to have more detail on the mariadbd process. Can you provide a graph that contains things like the total virtual memory size of the process as well as some global status variables, such as innodb_buffer_pool_pages_data and innodb_buffer_pool_pages_free ? That should look a bit like the oltp_ts_*.png attached to MDEV-23855 , partly with different counters. If those graphs look stable, then we would have to search for a memory leak or fragmentation somewhere, most likely outside InnoDB. What MDEV-24670 aims to do is to free pages from the InnoDB buffer pool in case a memory pressure event is reported by the operating system, to make it more immune to out-of-memory kills.

            At some point, there was a pro-active giving back memory to the OS with madvise, when freeing Innodb pages
            I think this is what suwalski was referring to as "good behavior"

            But it was found to be too expensive, as it would be a syscall for every freed page under some global buffer pool mutex. So this changed to use memory pressure notification.

            wlad Vladislav Vaintroub added a comment - At some point, there was a pro-active giving back memory to the OS with madvise, when freeing Innodb pages I think this is what suwalski was referring to as "good behavior" But it was found to be too expensive, as it would be a syscall for every freed page under some global buffer pool mutex. So this changed to use memory pressure notification.
            suwalski Pat Suwalski added a comment -

            Hello Marko and Vlad,

            Yes, the history list is much better managed now. We graph it, and it generally peaks at a few hundred thousand before a the background thread can clean it up after a long operation has run. Some of our even longer operations get it into the millions, but they are promptly cleaned up now as well. In contrast, the old ibdata1 file on our master was growing at about a terabyte a month on 10.11.6, before the fix and externalized undo logs.

            Yes, your assumption about the graphs is correct. It's the Zabbix available memory item, vm.memory.size[available], which matches MemAvailable in /proc/meminfo. The system runs bare metal with basically nothing other than mariadb, so the number is highly reflective of the mariadb process.

            I can start graphing other variables, but I don't have historical data for them.

            I think the problem I had over the weekend might have actually been caused because of MDEV-24670. The process didn't crash, it just got much slower, and the kswap1 process was completely pegging one core, even though the system has no swap space whatsoever. In the past, it would have OOMed quickly, restarted, and caused much less headache overall. Here, it hobbled along slowly, with no resolution of freeing memory in sight, and I had to do a restart of the mariadb process to resolve it.

            I can make it release pages of memory sometimes. To avoid this problem in the future, I lowered innodb_buffer_pool_size by a few gigabytes at runtime, and saw an associated increase in available memory.

            I think Vladislav's instinct is correct. I considered it good behaviour that the process was returning memory; it made it easy to keep track of how much RAM was actually being used at any given time. We didn't note any decrease in performance with that strategy, but it would never run out of RAM. In fact, as you can see from the graphs, it would average about half of the RAM in the system and never get low.

            Back in the day, MySQL 5.5 could be configured with about 90% of the system as innodb_buffer_pool_size and run very stable for literal years with something like 20M of free memory. 5.6 made this a little less stable, and 5.7 took it away completely. The various versions of MariaDB behave a little like MySQL 5.6 to me in this regard. There seem to be small leaks or unreturned RAM that creeps up over time, so it's much harder to find optimal settings, until that version where the memory was clearly aggressively being returned.

            Perhaps you could confirm that this madvise change went away in either 10.11.7 or 10.11.8?

            Maybe this isn't a bug, but an intentional change, and I need to keep track of innodb memory variables more closely to tune the system.

            Thanks.

            suwalski Pat Suwalski added a comment - Hello Marko and Vlad, Yes, the history list is much better managed now. We graph it, and it generally peaks at a few hundred thousand before a the background thread can clean it up after a long operation has run. Some of our even longer operations get it into the millions, but they are promptly cleaned up now as well. In contrast, the old ibdata1 file on our master was growing at about a terabyte a month on 10.11.6, before the fix and externalized undo logs. Yes, your assumption about the graphs is correct. It's the Zabbix available memory item, vm.memory.size [available] , which matches MemAvailable in /proc/meminfo . The system runs bare metal with basically nothing other than mariadb, so the number is highly reflective of the mariadb process. I can start graphing other variables, but I don't have historical data for them. I think the problem I had over the weekend might have actually been caused because of MDEV-24670 . The process didn't crash, it just got much slower, and the kswap1 process was completely pegging one core, even though the system has no swap space whatsoever. In the past, it would have OOMed quickly, restarted, and caused much less headache overall. Here, it hobbled along slowly, with no resolution of freeing memory in sight, and I had to do a restart of the mariadb process to resolve it. I can make it release pages of memory sometimes. To avoid this problem in the future, I lowered innodb_buffer_pool_size by a few gigabytes at runtime, and saw an associated increase in available memory. I think Vladislav's instinct is correct. I considered it good behaviour that the process was returning memory; it made it easy to keep track of how much RAM was actually being used at any given time. We didn't note any decrease in performance with that strategy, but it would never run out of RAM. In fact, as you can see from the graphs, it would average about half of the RAM in the system and never get low. Back in the day, MySQL 5.5 could be configured with about 90% of the system as innodb_buffer_pool_size and run very stable for literal years with something like 20M of free memory. 5.6 made this a little less stable, and 5.7 took it away completely. The various versions of MariaDB behave a little like MySQL 5.6 to me in this regard. There seem to be small leaks or unreturned RAM that creeps up over time, so it's much harder to find optimal settings, until that version where the memory was clearly aggressively being returned. Perhaps you could confirm that this madvise change went away in either 10.11.7 or 10.11.8? Maybe this isn't a bug, but an intentional change, and I need to keep track of innodb memory variables more closely to tune the system. Thanks.
            wlad Vladislav Vaintroub added a comment - - edited

            That madvise I mentioned was the subject of MDEV-31953, and yes, it was removed in 10.11.7

            It was added in MDEV-25341 , 10.11.0, overall did not have a very long life.
            But overall, infrequent "batched" madvise is superior to eager, for-every-freed-page. If memory pressure notification does not work, we probably need to understand why, and how to make it work.

            I think recently there have been some talk about transparent huge pages on Linux, and how they seem to be causing memory leaks, and the need to disable it. I don't have the full picture, but perhaps marko or danblack can remember details.

            wlad Vladislav Vaintroub added a comment - - edited That madvise I mentioned was the subject of MDEV-31953 , and yes, it was removed in 10.11.7 It was added in MDEV-25341 , 10.11.0, overall did not have a very long life. But overall, infrequent "batched" madvise is superior to eager, for-every-freed-page. If memory pressure notification does not work, we probably need to understand why, and how to make it work. I think recently there have been some talk about transparent huge pages on Linux, and how they seem to be causing memory leaks, and the need to disable it. I don't have the full picture, but perhaps marko or danblack can remember details.

            There is a work-in-progress ticket MDEV-34753. I hope that danblack or knielsen can comment whether that could play a role here.

            An excerpt of the server error log since the latest startup could help to find out if the memory pressure notification interface was enable or triggered. suwalski, could you provide that?

            marko Marko Mäkelä added a comment - There is a work-in-progress ticket MDEV-34753 . I hope that danblack or knielsen can comment whether that could play a role here. An excerpt of the server error log since the latest startup could help to find out if the memory pressure notification interface was enable or triggered. suwalski , could you provide that?
            knielsen Kristian Nielsen added a comment - - edited

            marko: The MDEV-34753 relates to a feature where InnoDB listens for notification from the kernel that the system is under memory pressure (risking OOM). When this happens, InnoDB can try to release memory to help by calling buf_pool.garbage_collect().

            The MDEV-34753 bug has the consequence that this does not work. The thread listening for notifications will always exit before trying to react to memory pressure.

            So I think the MDEV-34753 is not relevant here. As a consequence of this bug, the memory pressure code is not active, is my understanding. It looks like this code was introduced in 10.11.7. So the bug will prevent the new feature from making things better in 10.11.7, but it should not cause different behaviour to 10.11.6.

            Unless there was some similar memory pressure handling in 10.11.6 that I am not aware of? And this was replaced by the new code in 10.11.7 (which is not working)? If the system was previously dependent on such mechanism to have good memory behavior, and this old code is not replaced with new code that is inoperational, then maybe it could have an effect.

            Hope this helps,

            - Kristian.

            EDIT: Ok, I see the comment about madvise being removed in 10.11.7, so this then somewhat relates to this, since the mew system listening to memory pressure events from the kernel is ineffective in current code, AFAIK. The patch for MDEV-34753 that danblack wrote is quite simple, and something the reporter could try to test if desired.

            knielsen Kristian Nielsen added a comment - - edited marko : The MDEV-34753 relates to a feature where InnoDB listens for notification from the kernel that the system is under memory pressure (risking OOM). When this happens, InnoDB can try to release memory to help by calling buf_pool.garbage_collect(). The MDEV-34753 bug has the consequence that this does not work. The thread listening for notifications will always exit before trying to react to memory pressure. So I think the MDEV-34753 is not relevant here. As a consequence of this bug, the memory pressure code is not active, is my understanding. It looks like this code was introduced in 10.11.7. So the bug will prevent the new feature from making things better in 10.11.7, but it should not cause different behaviour to 10.11.6. Unless there was some similar memory pressure handling in 10.11.6 that I am not aware of? And this was replaced by the new code in 10.11.7 (which is not working)? If the system was previously dependent on such mechanism to have good memory behavior, and this old code is not replaced with new code that is inoperational, then maybe it could have an effect. Hope this helps, - Kristian. EDIT: Ok, I see the comment about madvise being removed in 10.11.7, so this then somewhat relates to this, since the mew system listening to memory pressure events from the kernel is ineffective in current code, AFAIK. The patch for MDEV-34753 that danblack wrote is quite simple, and something the reporter could try to test if desired.
            suwalski Pat Suwalski added a comment - - edited

            wlad I really like this idea of a batched madvise, something that could execute at something approximating the timeframe of undo log truncation, every few minutes, etc.

            marko: I was looking through the logs for something indicating memory pressure. There are many entries for the undo log truncation (which also works very well now after HLL fixes!), but [Mm]emory doesn't show up anywhere in the logs. Nothing in dmesg in case it would be a kernel message. Perhaps there is something else I should search for? Or, perhaps, knielsen is correct that 10.11.9 wouldn't have this ever running.

            suwalski Pat Suwalski added a comment - - edited wlad I really like this idea of a batched madvise, something that could execute at something approximating the timeframe of undo log truncation, every few minutes, etc. marko : I was looking through the logs for something indicating memory pressure. There are many entries for the undo log truncation (which also works very well now after HLL fixes!), but [Mm] emory doesn't show up anywhere in the logs. Nothing in dmesg in case it would be a kernel message. Perhaps there is something else I should search for? Or, perhaps, knielsen is correct that 10.11.9 wouldn't have this ever running.

            I trust knielsen’s judgement here.

            A batched madvise() might be feasible to run in the buf_flush_page_cleaner() thread, about once per second, but I think that it would depend on implementing MDEV-29445, so that we could in a fairly straightforward way invoke madvise() on a few contiguous virtual address ranges, instead of invoking it separately for each innodb_page_size page frame, like we do in the current implementation. The current implementation is fine, provided that it is not being invoked too often. Should a busy server process a memory pressure event, we could in any case be in a bigger performance trouble, because buf_pool_t::garbage_collect() will try to free up as many pages as possible, no matter how recent the last access was. So, the memory pressure event could soon be followed by excessive amounts of page reads to warm up the buffer pool for the workload.

            marko Marko Mäkelä added a comment - I trust knielsen ’s judgement here. A batched madvise() might be feasible to run in the buf_flush_page_cleaner() thread, about once per second, but I think that it would depend on implementing MDEV-29445 , so that we could in a fairly straightforward way invoke madvise() on a few contiguous virtual address ranges, instead of invoking it separately for each innodb_page_size page frame, like we do in the current implementation. The current implementation is fine, provided that it is not being invoked too often. Should a busy server process a memory pressure event, we could in any case be in a bigger performance trouble, because buf_pool_t::garbage_collect() will try to free up as many pages as possible, no matter how recent the last access was. So, the memory pressure event could soon be followed by excessive amounts of page reads to warm up the buffer pool for the workload.

            The rewritten InnoDB buffer pool allocation in MDEV-29445 would allow batched madvise(MADV_FREE) of larger chunks of the buffer pool at a time.

            marko Marko Mäkelä added a comment - The rewritten InnoDB buffer pool allocation in MDEV-29445 would allow batched madvise(MADV_FREE) of larger chunks of the buffer pool at a time.

            This is implemented in the 10.11-MDEV-29445 branch, which you have already been reviewing.

            marko Marko Mäkelä added a comment - This is implemented in the 10.11- MDEV-29445 branch, which you have already been reviewing.
            debarun Debarun Banerjee added a comment - Review done with MDEV-29445 . https://github.com/MariaDB/server/pull/3826 .

            This has been implemented in the same branch as MDEV-29445.

            marko Marko Mäkelä added a comment - This has been implemented in the same branch as MDEV-29445 .

            Will be fixed together with MDEV-29445, so closing.

            serg Sergei Golubchik added a comment - Will be fixed together with MDEV-29445 , so closing.
            marko Marko Mäkelä added a comment -

            While this fix has been tested and reviewed in the same development branch with MDEV-29445, it is a separate change on its own.

            marko Marko Mäkelä added a comment - While this fix has been tested and reviewed in the same development branch with MDEV-29445 , it is a separate change on its own.
            marko Marko Mäkelä added a comment -

            The memory pressure stall interface is now disabled by default. To enable it:

            SET GLOBAL innodb_buffer_pool_size_auto_min=0;
            

            or set it to a minimum value that you allow the buffer pool to be shrunk to, in response to running out of memory. Each event will attempt to reduce innodb_buffer_pool_size to (innodb_buffer_pool_size+innodb_buffer_pool_size_auto_min)/2.

            marko Marko Mäkelä added a comment - The memory pressure stall interface is now disabled by default. To enable it: SET GLOBAL innodb_buffer_pool_size_auto_min=0; or set it to a minimum value that you allow the buffer pool to be shrunk to, in response to running out of memory. Each event will attempt to reduce innodb_buffer_pool_size to (innodb_buffer_pool_size+innodb_buffer_pool_size_auto_min)/2 .
            suwalski Pat Suwalski added a comment -

            Awesome, gentlemen. I am looking forward to trying it.

            suwalski Pat Suwalski added a comment - Awesome, gentlemen. I am looking forward to trying it.

            People

              marko Marko Mäkelä
              suwalski Pat Suwalski
              Votes:
              0 Vote for this issue
              Watchers:
              9 Start watching this issue

              Dates

                Created:
                Updated:
                Resolved:

                Git Integration

                  Error rendering 'com.xiplink.jira.git.jira_git_plugin:git-issue-webpanel'. Please contact your Jira administrators.