Uploaded image for project: 'MariaDB Server'
  1. MariaDB Server
  2. MDEV-34753

memory pressure - erroneous termination condition

Details

    Description

      Thanks knielsen:

      I happened upon this patch of yours:

      MDEV-24670 memory pressure - eventfd rather than pipe

      @@ -896,7 +894,7 @@ void mem_pressure::pressure_routine(mem_pressure *m)
         }
       
         ulonglong last= microsecond_interval_timer() - max_interval_us;
      -  while (1)
      +  while (!m->m_abort)
         {
           if (poll(&m->m_fds[0], m->m_num_fds, -1) < 0)
           {
      @@ -909,6 +907,9 @@ void mem_pressure::pressure_routine(mem_pressure *m)
               break;
             }
           }
      +    if (!m->m_abort)
      +      break;
      +
      

      Is it just me, or isn't that if (!m->m_abort) condition inverted? This seems to mean that the thread will never do anything, it will exit immediately the first time it gets any activity on the fd out of poll()?

      Attachments

        1. 2025-03-25 13_43_09-j1-jes.png
          276 kB
          Adelin
        2. buffer_pool.png
          31 kB
          Gary Barlow
        3. checkpoint_age.png
          34 kB
          Gary Barlow
        4. meminfo.txt
          1 kB
          Adelin
        5. pmap.txt
          17 kB
          Adelin

        Issue Links

          Activity

            danblack Daniel Black added a comment -

            The current triggers are:

            https://github.com/MariaDB/server/blob/mariadb-10.11.9/storage/innobase/buf/buf0buf.cc#L873-L880

            If there is some memory pressure for 5/10 seconds, or there is full memory pressure for 10ms out of 2 seconds.

            Details as what these mean are https://docs.kernel.org/accounting/psi.html.

            I didn't include which was actually triggering in the logs, would be a simple enough change.

            The response in https://github.com/MariaDB/server/blob/mariadb-10.11.9/storage/innobase/buf/buf0buf.cc#L2174 is a madvise(MADV_FREE) which allows the memory to be claimed by the kernel.

            So larger questions is there a MariaDB performance impact apart from generating log messages every few hours? Would the a kernel killing MariaDB due to an out of memory event otherwise? And if both are true, is there a fine tuning of the trigger, that can accommodate both.

            If you graph the memory resident use of MariaDB does it and by how much during these memory pressure events.

            danblack Daniel Black added a comment - The current triggers are: https://github.com/MariaDB/server/blob/mariadb-10.11.9/storage/innobase/buf/buf0buf.cc#L873-L880 If there is some memory pressure for 5/10 seconds, or there is full memory pressure for 10ms out of 2 seconds. Details as what these mean are https://docs.kernel.org/accounting/psi.html . I didn't include which was actually triggering in the logs, would be a simple enough change. The response in https://github.com/MariaDB/server/blob/mariadb-10.11.9/storage/innobase/buf/buf0buf.cc#L2174 is a madvise(MADV_FREE) which allows the memory to be claimed by the kernel. So larger questions is there a MariaDB performance impact apart from generating log messages every few hours? Would the a kernel killing MariaDB due to an out of memory event otherwise? And if both are true, is there a fine tuning of the trigger, that can accommodate both. If you graph the memory resident use of MariaDB does it and by how much during these memory pressure events.
            adelin Adelin added a comment -

            I'm going to monitor these days the MariaDB's memory usage and the server RAM usage overall.
            From what I can tell so far, in our configuration, currently the server seems to have about ~20-22GB RAM free all the time.

            Before the upgrade to MariaDB v10.11.10, it used to have about 12-14GB RAM free and in 3 years of production we haven't had a single OOM event. There were no big traffic or configuration changes in this time.

            Current RAM usage of MariaDB is about 20% (on a 32GB RAM server), which is about ~6GB of RAM, which is less overall than the set `innodb_buffer_pool_size = 8G`, not taking into account the core process memory usage. So it does discard a lot of pages, while still having lots of RAM available for it.

            (Now, to be fair, perhaps there are memory spikes there, which I'm currently not aware of, but as said, I'm going to monitor).

            But all these make me wonder if memory pressure trigger really calculates correctly the situations where the server could or will actually run out of memory, or if there isn't anything else that it should account for before triggering this and it does not. As said, not a single OOM event in all this time.

            And in regards to performance – since it frees InnoDB spaces that often (which basically means it discards the RAM cached pages), I suppose it has a significant performance impact. So the question above remains.

            As told, I'm going to do some profiling and come back with more info.
            Perhaps this particular functionality can be reviewed.
            Thanks.

            adelin Adelin added a comment - I'm going to monitor these days the MariaDB's memory usage and the server RAM usage overall. From what I can tell so far, in our configuration, currently the server seems to have about ~20-22GB RAM free all the time. Before the upgrade to MariaDB v10.11.10, it used to have about 12-14GB RAM free and in 3 years of production we haven't had a single OOM event. There were no big traffic or configuration changes in this time. Current RAM usage of MariaDB is about 20% (on a 32GB RAM server), which is about ~6GB of RAM, which is less overall than the set `innodb_buffer_pool_size = 8G`, not taking into account the core process memory usage. So it does discard a lot of pages, while still having lots of RAM available for it. (Now, to be fair, perhaps there are memory spikes there, which I'm currently not aware of, but as said, I'm going to monitor). But all these make me wonder if memory pressure trigger really calculates correctly the situations where the server could or will actually run out of memory, or if there isn't anything else that it should account for before triggering this and it does not. As said, not a single OOM event in all this time. And in regards to performance – since it frees InnoDB spaces that often (which basically means it discards the RAM cached pages), I suppose it has a significant performance impact. So the question above remains. As told, I'm going to do some profiling and come back with more info. Perhaps this particular functionality can be reviewed. Thanks.
            GaryMB Gary Barlow added a comment -

            I've not seen an OOM event in ~ 10 years but after upgrading to 10.11.10 occasional memory pressure events have a dramatic impact on the buffer pool and flushing.

            Buffer pool

            Checkpoint age

            GaryMB Gary Barlow added a comment - I've not seen an OOM event in ~ 10 years but after upgrading to 10.11.10 occasional memory pressure events have a dramatic impact on the buffer pool and flushing. Buffer pool Checkpoint age

            MDEV-29445 and MDEV-34863 are currently undergoing final stress testing. In MDEV-34863, the memory pressure handling would be disabled by default. It is also being revised in such a way that larger chunks should be freed at a time.

            marko Marko Mäkelä added a comment - MDEV-29445 and MDEV-34863 are currently undergoing final stress testing. In MDEV-34863 , the memory pressure handling would be disabled by default. It is also being revised in such a way that larger chunks should be freed at a time.
            adelin Adelin added a comment -

            As stated before, unless I misunderstand how this works, I also suspect there might be something wrong with this functionality.
            We're currently running v10.11.11 on a Galera Cluster made of three nodes.
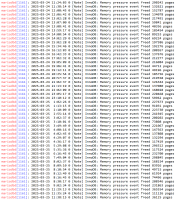
            On one of the nodes, the memory pressure events happen extremely often (from every 15m to every hour or so):

            `cat /proc/meminfo` says there's 18GB of 32GB available to the node.
            Var `innodb_buffer_pool_size=8G` .

            I attach a `pmap` of the `mariadb` process and the output of `meminfo` if useful.
            pmap.txt
            meminfo.txt

            This wasn't happening before 10.11.10 (or earlier, can't remember exactly which one).

            adelin Adelin added a comment - As stated before, unless I misunderstand how this works, I also suspect there might be something wrong with this functionality. We're currently running v10.11.11 on a Galera Cluster made of three nodes. On one of the nodes, the memory pressure events happen extremely often (from every 15m to every hour or so): `cat /proc/meminfo` says there's 18GB of 32GB available to the node. Var `innodb_buffer_pool_size=8G` . I attach a `pmap` of the `mariadb` process and the output of `meminfo` if useful. pmap.txt meminfo.txt This wasn't happening before 10.11.10 (or earlier, can't remember exactly which one).

            People

              danblack Daniel Black
              danblack Daniel Black
              Votes:
              0 Vote for this issue
              Watchers:
              6 Start watching this issue

              Dates

                Created:
                Updated:
                Resolved:

                Git Integration

                  Error rendering 'com.xiplink.jira.git.jira_git_plugin:git-issue-webpanel'. Please contact your Jira administrators.