Details
-
Bug
-
Status: In Testing (View Workflow)
-
 Critical
-
Resolution: Unresolved
-
10.6.16
-
None
-
redhat 8 on vmware
Description
we are getting memory leak in one DB server.
situation:
- our architecture is 3 nodes galera cluster - 2 DB nodes + 1 arbitrator in different locations. Plus running haproxy as the front end
- haproxy redirects traffic to one DB node in normal stage. Another DB node is configured as backup in haproxy
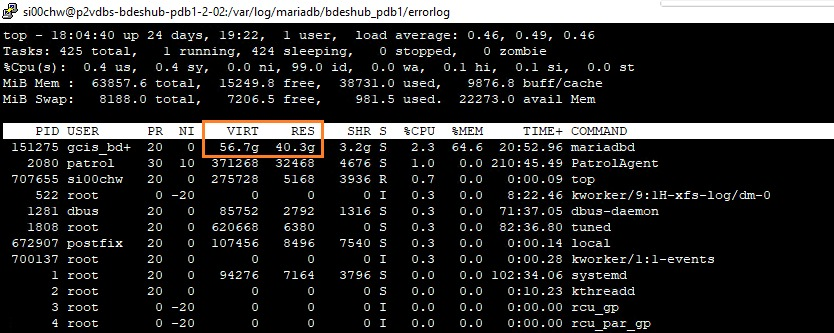
- the backup DB node used up its operating system available memory in 1 or 2 days. The DB node is running on 64GB memory VM and 8GB buffer pool
- after available memory used up in backup DB node, OS killed the DB process and available memory got released
- the backup DB node got 128 galera replication threads
Since haproxy does not route traffic to backup DB node in normal situation, only replication and Percona PMM are using backup DB node.
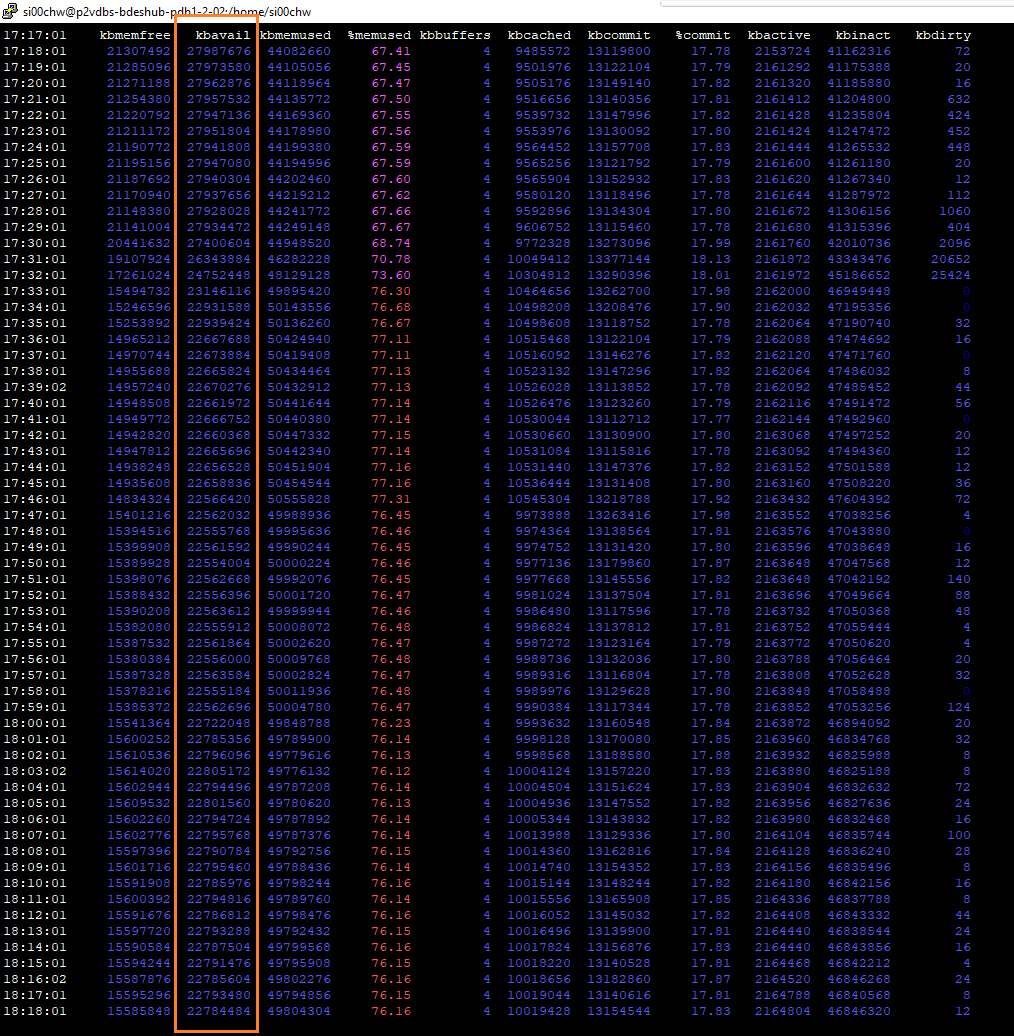
Screenshot:
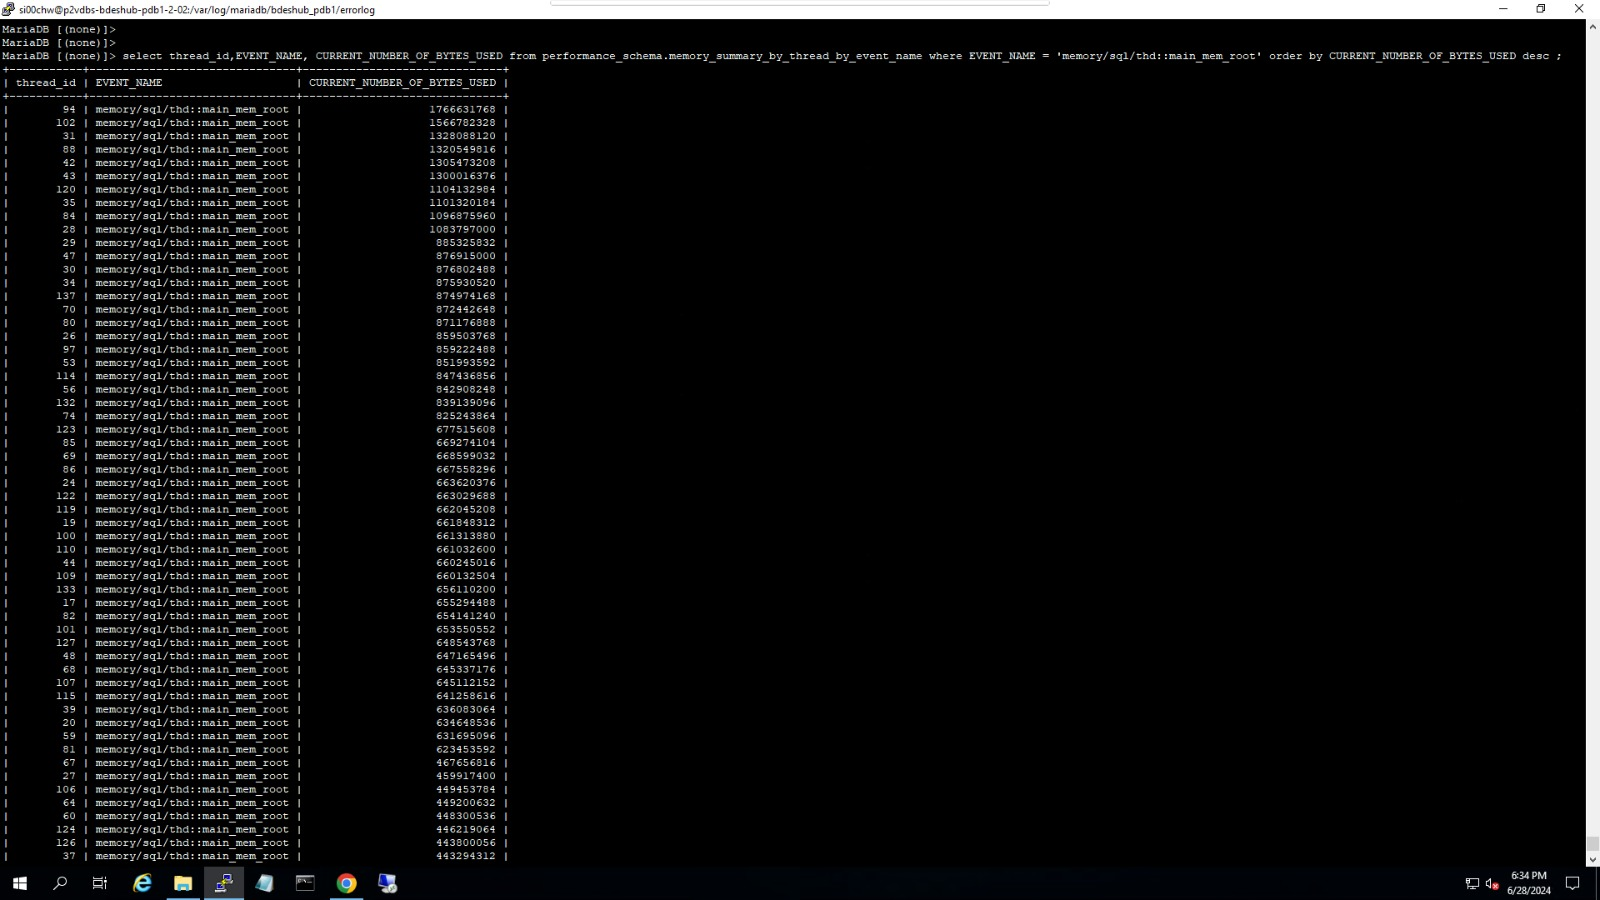
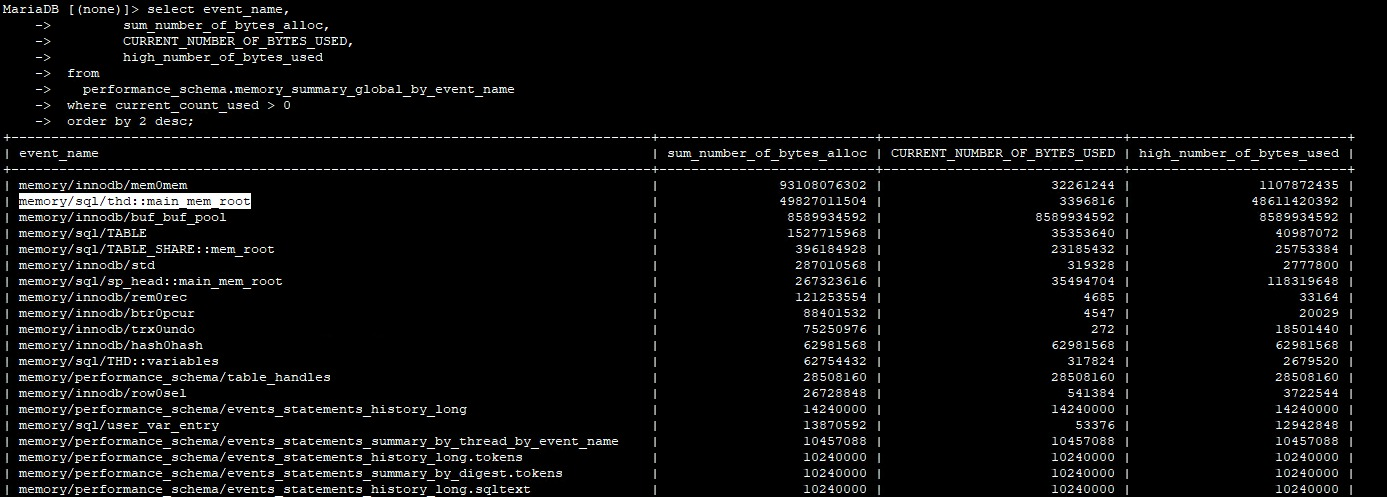
uploaded top command output, keeping decreasing available memory and output of memory_summary_global_by_event_name and memory_summary_by_thread_by_event_name
Question:
Any method to continue the troubleshooting? Kindly advise "memory/sql/thd::main_mem_root" is related to the memory leak or not.
Regards,
William Wong