Uploaded image for project: 'MariaDB Server'
  1. MariaDB Server
  2. MDEV-32033

all queries get stuck until a timeout occurs on all of them

Details

    • Bug
    • Status: Open (View Workflow)
    • Major
    • Resolution: Unresolved
    • 10.4.31, 10.5, 10.6, 10.7(EOL), 10.8(EOL), 10.9(EOL), 10.10(EOL), 10.11, 11.0(EOL), 11.1(EOL), 11.2(EOL)
    • 10.5, 10.11
    • Locking
    • None
    • Ubuntu 20.04

    Description

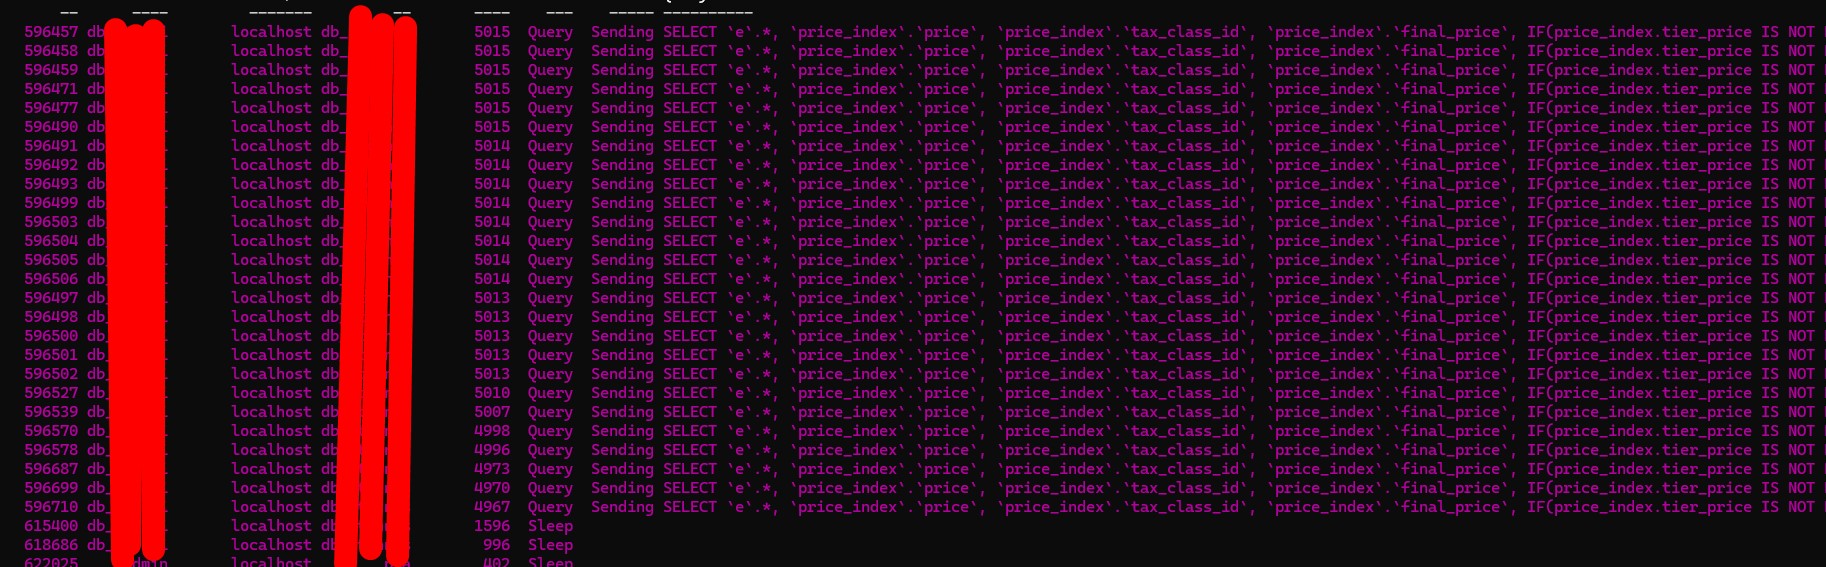
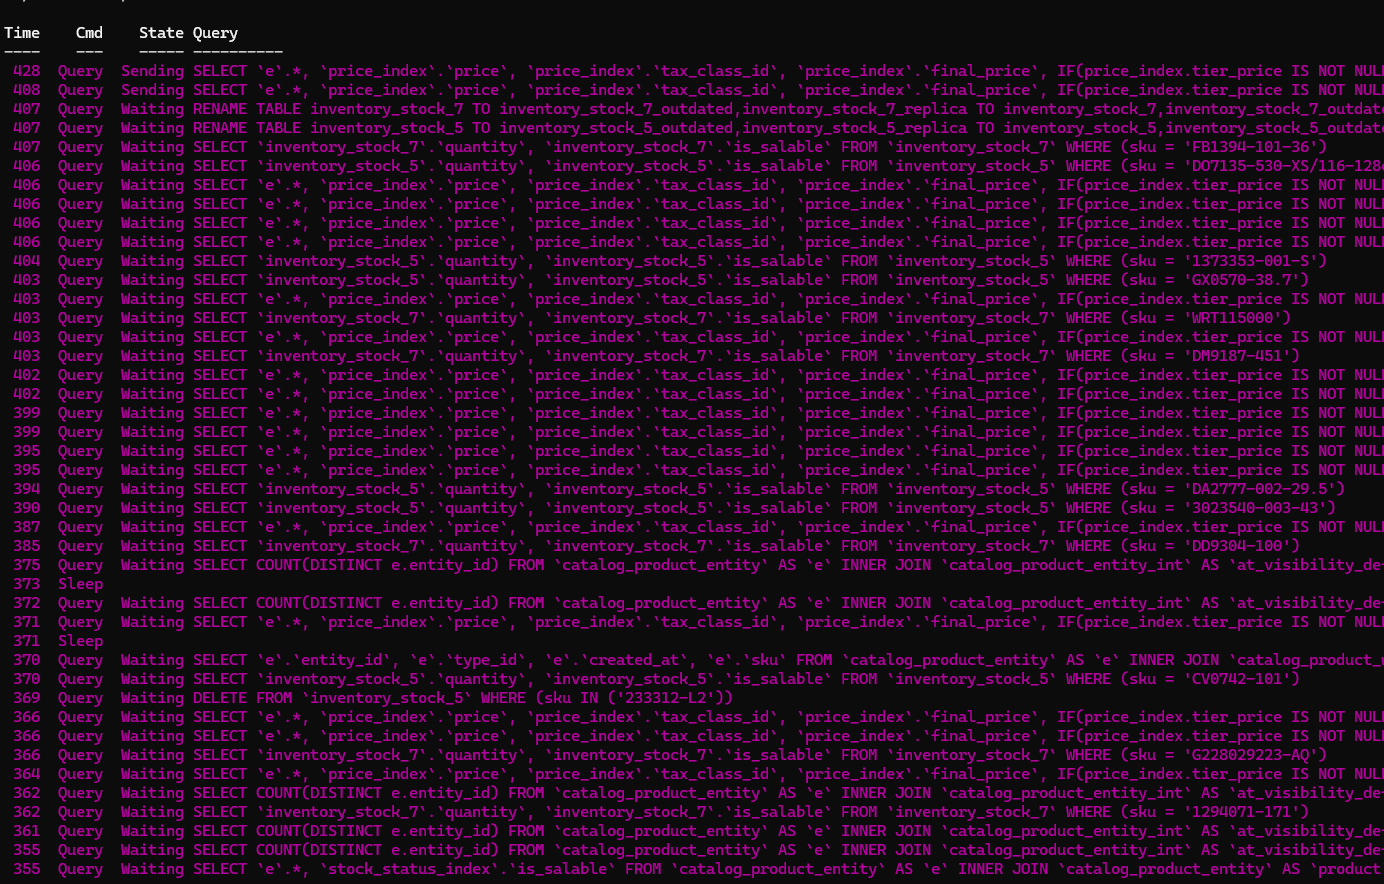
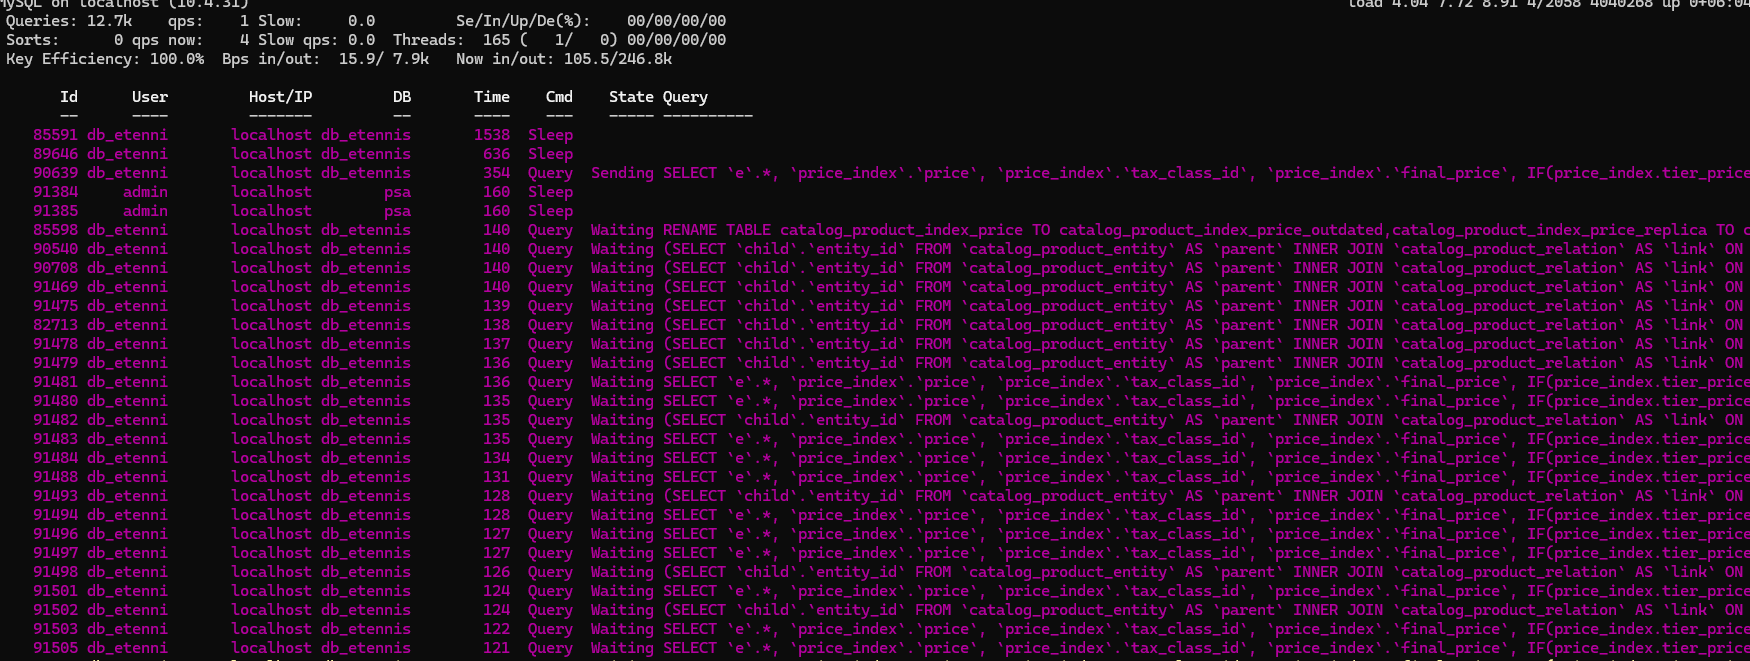
      I am trying to troubleshoot an issue in a magento 2 website. It seems that at random times there comes a situation where mariadb seems to go into a deadlock situation and slowly stops serving requests. I end up with a state where every query is stuck in a waiting state. In the end some queries time out, I receive notifications about lock wait timeout exceeded and the queries eventually finish executing.

      I'm trying to deduce what's happening and how to solve this but I'm stuck and need some help understanding the cause of this issue so I ended up in dba.stackexchange.com where it was suggested that I open a bug report. You can see the full thread here

      https://dba.stackexchange.com/questions/330629/how-can-i-find-out-whats-causing-the-deadlock-in-mariadb?noredirect=1#comment643999_330629

      And there's also some extra info here about the issue I'm encountering
      https://github.com/magento/magento2/issues/36667

      Here's the current config

      ~$ my_print_defaults  --mysqld
      --user=mysql
      --pid-file=/run/mysqld/mysqld.pid
      --socket=/run/mysqld/mysqld.sock
      --basedir=/usr
      --datadir=/var/lib/mysql
      --tmpdir=/tmp
      --lc-messages-dir=/usr/share/mysql
      --bind-address=0.0.0.0
      --key_buffer_size=64M
      --max_allowed_packet=1G
      --max_connections=300
      --query_cache_size=0
      --log_error=/var/log/mysql/error.log
      --expire_logs_days=10
      --character-set-server=utf8mb4
      --collation-server=utf8mb4_general_ci
      --query_cache_size=0
      --query_cache_type=0
      --query_cache_limit=0
      --join_buffer_size=512K
      --tmp_table_size=128M
      --max_heap_table_size=128M
      --innodb_buffer_pool_size=32G
      --innodb_buffer_pool_instances=16
      --innodb_log_file_size=4G
      --optimizer_use_condition_selectivity=1
      --optimizer_switch=optimize_join_buffer_size=on
      --in_predicate_conversion_threshold=4294967295
      --innodb_data_home_dir=/var/lib/mysql/
      --innodb_data_file_path=ibdata1:10M:autoextend
      --innodb_log_group_home_dir=/var/lib/mysql/
      --innodb_lock_wait_timeout=50
      --innodb_file_per_table=1
      --innodb_log_buffer_size=4M
      --performance_schema
      --optimizer_switch=rowid_filter=off
      --optimizer_use_condition_selectivity=1
      --optimizer_search_depth=0
      --slow_query_log
      --slow_query_log_file=/var/log/mysql/mariadb-slow.log
      --long_query_time=20.0
      --innodb_print_all_deadlocks=1
      --lock_wait_timeout=240
      --bind-address=0.0.0.0
      --sql_mode=
      --local-infile=0
      --innodb_open_files=4000
      --table_open_cache=3000
      --table_definition_cache=3000
      

      I'm attaching the image from what I see in mytop during the occurence and the results of
      1. the full process list,
      2. the mariadb full backtrace of all running threads and
      3. the result of `show engine innodb status`

      However I wasn't able to acquire them all together because I have to be connected during the issue and the duration is not the same everytime. Sometimes things resolve within a minute, sometimes within 10 minutes.

      So they might have some different queries inside but I'm hoping we can find out the reason for this issue

      Attachments

        1. debug_20230904135015.zip
          350 kB
        2. debug_20230904155641.zip
          206 kB
        3. debug_20230904155641-1.zip
          206 kB
        4. debug_20230904170300.zip
          165 kB
        5. debug_20230905091543.zip
          192 kB
        6. debug_20230905142728.zip
          788 kB
        7. debug_20230907075720.zip
          201 kB
        8. debug_20230910214351.zip
          159 kB
        9. debug_20230910214351-1.zip
          159 kB
        10. dump.sql.gz
          33 kB
        11. dump.sql-1.gz
          33 kB
        12. dump2023-09-01-143646.zip
          179 kB
        13. dump2023-09-01-163052.zip
          203 kB
        14. dump20230902-071200.zip
          108 kB
        15. processlist-202309011403.txt
          65 kB
        16. queries stuck in sending state.jpg
          queries stuck in sending state.jpg
          375 kB
        17. queries stuck in sending state.txt
          1.32 MB
        18. screenshot-1.png
          screenshot-1.png
          234 kB
        19. screenshot-2.png
          screenshot-2.png
          190 kB

        Issue Links

          Activity

            It seems it's the optimizer's fault in the particular query. For some reason sometimes it will plan the query perfectly fine by limiting the rows properly, and sometimes it will do something weird taking ages to finish.

            By removing the double join on is_salable, it seems the optimizer plans the query perfectly without issues. However sometimes we may need to have the same table joined twice due to a different condition so I'm not sure why this should be a problem.

            Any ideas why it picks different plans for the same query randomly?

            ioweb.gr Gabriel Tziotzis added a comment - It seems it's the optimizer's fault in the particular query. For some reason sometimes it will plan the query perfectly fine by limiting the rows properly, and sometimes it will do something weird taking ages to finish. By removing the double join on is_salable, it seems the optimizer plans the query perfectly without issues. However sometimes we may need to have the same table joined twice due to a different condition so I'm not sure why this should be a problem. Any ideas why it picks different plans for the same query randomly?

            Since you now are on 10.6, can you please give MDEV-31577 a try, by prepending your problematic SELECT statements with ANALYZE FORMAT=JSON? Save the outputs for both fast and slow runs, and compare them. Another useful diagnosis tool could be the optimizer trace.

            marko Marko Mäkelä added a comment - Since you now are on 10.6, can you please give MDEV-31577 a try, by prepending your problematic SELECT statements with ANALYZE FORMAT=JSON ? Save the outputs for both fast and slow runs, and compare them. Another useful diagnosis tool could be the optimizer trace .

            CUrrently it's not possible to provide this because I've already updated the query to a format that would not confuse the optimizer to stop the production site from dropping.

            However the underlying issue is with the optimizer as it chose different execution plans in specific times leading to downtimes instead of the optimal execution plan

            ioweb.gr Gabriel Tziotzis added a comment - CUrrently it's not possible to provide this because I've already updated the query to a format that would not confuse the optimizer to stop the production site from dropping. However the underlying issue is with the optimizer as it chose different execution plans in specific times leading to downtimes instead of the optimal execution plan
            ioweb.gr Gabriel Tziotzis added a comment - - edited

            Hi,

            I found a similar case on a Magento 1.9 website and I think this is a very good example of something that is easy to replicate

            SELECT `screen_size_idx`.`value`, COUNT(screen_size_idx.entity_id) AS `count`
            FROM `catalog_product_entity` AS `e`
                     INNER JOIN `catalog_category_product_index` AS `cat_index`
                                ON cat_index.product_id = e.entity_id AND cat_index.store_id = 1 AND
                                   cat_index.visibility IN (2, 4) AND cat_index.category_id = '15'
                     INNER JOIN `catalog_product_index_price` AS `price_index`
                                ON price_index.entity_id = e.entity_id AND price_index.website_id = '1' AND
                                   price_index.customer_group_id = 0
                     INNER JOIN `catalog_product_index_eav` AS `manufacturer2_idx`
                                ON manufacturer2_idx.entity_id = e.entity_id AND manufacturer2_idx.attribute_id = '186' AND
                                   manufacturer2_idx.store_id = 1 AND manufacturer2_idx.value = '6'
                     INNER JOIN `catalog_product_index_eav` AS `screen_resolution_idx`
                                ON screen_resolution_idx.entity_id = e.entity_id AND screen_resolution_idx.attribute_id = '188' AND
                                   screen_resolution_idx.store_id = 1 AND screen_resolution_idx.value = '249'
                     INNER JOIN `catalog_product_index_eav` AS `screen_type_idx`
                                ON screen_type_idx.entity_id = e.entity_id AND screen_type_idx.attribute_id = '189' AND
                                   screen_type_idx.store_id = 1 AND screen_type_idx.value = '37'
                     INNER JOIN `catalog_product_index_eav` AS `core_count_idx`
                                ON core_count_idx.entity_id = e.entity_id AND core_count_idx.attribute_id = '193' AND
                                   core_count_idx.store_id = 1 AND core_count_idx.value = '41'
                     INNER JOIN `catalog_product_index_eav` AS `ram_idx`
                                ON ram_idx.entity_id = e.entity_id AND ram_idx.attribute_id = '196' AND ram_idx.store_id = 1 AND
                                   ram_idx.value = '52'
                     INNER JOIN `catalog_product_index_eav` AS `memory_idx`
                                ON memory_idx.entity_id = e.entity_id AND memory_idx.attribute_id = '197' AND
                                   memory_idx.store_id = 1 AND memory_idx.value = '62'
                     INNER JOIN `catalog_product_index_eav` AS `second_camera_idx`
                                ON second_camera_idx.entity_id = e.entity_id AND second_camera_idx.attribute_id = '200' AND
                                   second_camera_idx.store_id = 1 AND second_camera_idx.value = '87'
                     INNER JOIN `catalog_product_index_eav` AS `gdiktia_idx`
                                ON gdiktia_idx.entity_id = e.entity_id AND gdiktia_idx.attribute_id = '232' AND
                                   gdiktia_idx.store_id = 1 AND gdiktia_idx.value = '167'
                     INNER JOIN `catalog_product_index_eav` AS `nfcsosto_idx`
                                ON nfcsosto_idx.entity_id = e.entity_id AND nfcsosto_idx.attribute_id = '258' AND
                                   nfcsosto_idx.store_id = 1 AND nfcsosto_idx.value = '377'
                     INNER JOIN `catalog_product_index_eav` AS `screen_size_idx`
                                ON screen_size_idx.entity_id = e.entity_id AND screen_size_idx.attribute_id = '187' AND
                                   screen_size_idx.store_id = '1'
            GROUP BY `screen_size_idx`.`value`;
            

            The query above will take ages to complete even though the tables are not that large. They contain from 200 to 2000 rows each

            +------------------------------+---------+
            |table_name                    |row_count|
            +------------------------------+---------+
            |catalog_product_entity        |1817     |
            |catalog_category_product_index|284      |
            |catalog_product_index_price   |120      |
            |catalog_product_index_eav     |585      |
            +------------------------------+---------+
            

            I've seen it hang for like 28000seconds. That's an extremely high amount.

            The similarity is in the amount of joins on the same table.

            The original query itself was doing this randomly due to the double join on the stock tables.

            Could it be a pattern here of how this bug is occurring?

            I'm pretty certain the above query shouldn't take days to finish. Heres' the dump of the tables https://jira.mariadb.org/secure/attachment/73287/dump.sql.gz

            ioweb.gr Gabriel Tziotzis added a comment - - edited Hi, I found a similar case on a Magento 1.9 website and I think this is a very good example of something that is easy to replicate SELECT `screen_size_idx`.`value`, COUNT(screen_size_idx.entity_id) AS `count` FROM `catalog_product_entity` AS `e` INNER JOIN `catalog_category_product_index` AS `cat_index` ON cat_index.product_id = e.entity_id AND cat_index.store_id = 1 AND cat_index.visibility IN ( 2 , 4 ) AND cat_index.category_id = '15' INNER JOIN `catalog_product_index_price` AS `price_index` ON price_index.entity_id = e.entity_id AND price_index.website_id = '1' AND price_index.customer_group_id = 0 INNER JOIN `catalog_product_index_eav` AS `manufacturer2_idx` ON manufacturer2_idx.entity_id = e.entity_id AND manufacturer2_idx.attribute_id = '186' AND manufacturer2_idx.store_id = 1 AND manufacturer2_idx.value = '6' INNER JOIN `catalog_product_index_eav` AS `screen_resolution_idx` ON screen_resolution_idx.entity_id = e.entity_id AND screen_resolution_idx.attribute_id = '188' AND screen_resolution_idx.store_id = 1 AND screen_resolution_idx.value = '249' INNER JOIN `catalog_product_index_eav` AS `screen_type_idx` ON screen_type_idx.entity_id = e.entity_id AND screen_type_idx.attribute_id = '189' AND screen_type_idx.store_id = 1 AND screen_type_idx.value = '37' INNER JOIN `catalog_product_index_eav` AS `core_count_idx` ON core_count_idx.entity_id = e.entity_id AND core_count_idx.attribute_id = '193' AND core_count_idx.store_id = 1 AND core_count_idx.value = '41' INNER JOIN `catalog_product_index_eav` AS `ram_idx` ON ram_idx.entity_id = e.entity_id AND ram_idx.attribute_id = '196' AND ram_idx.store_id = 1 AND ram_idx.value = '52' INNER JOIN `catalog_product_index_eav` AS `memory_idx` ON memory_idx.entity_id = e.entity_id AND memory_idx.attribute_id = '197' AND memory_idx.store_id = 1 AND memory_idx.value = '62' INNER JOIN `catalog_product_index_eav` AS `second_camera_idx` ON second_camera_idx.entity_id = e.entity_id AND second_camera_idx.attribute_id = '200' AND second_camera_idx.store_id = 1 AND second_camera_idx.value = '87' INNER JOIN `catalog_product_index_eav` AS `gdiktia_idx` ON gdiktia_idx.entity_id = e.entity_id AND gdiktia_idx.attribute_id = '232' AND gdiktia_idx.store_id = 1 AND gdiktia_idx.value = '167' INNER JOIN `catalog_product_index_eav` AS `nfcsosto_idx` ON nfcsosto_idx.entity_id = e.entity_id AND nfcsosto_idx.attribute_id = '258' AND nfcsosto_idx.store_id = 1 AND nfcsosto_idx.value = '377' INNER JOIN `catalog_product_index_eav` AS `screen_size_idx` ON screen_size_idx.entity_id = e.entity_id AND screen_size_idx.attribute_id = '187' AND screen_size_idx.store_id = '1' GROUP BY `screen_size_idx`.`value`; The query above will take ages to complete even though the tables are not that large. They contain from 200 to 2000 rows each +------------------------------+---------+ |table_name |row_count| +------------------------------+---------+ |catalog_product_entity | 1817 | |catalog_category_product_index| 284 | |catalog_product_index_price | 120 | |catalog_product_index_eav | 585 | +------------------------------+---------+ I've seen it hang for like 28000seconds. That's an extremely high amount. The similarity is in the amount of joins on the same table. The original query itself was doing this randomly due to the double join on the stock tables. Could it be a pattern here of how this bug is occurring? I'm pretty certain the above query shouldn't take days to finish. Heres' the dump of the tables https://jira.mariadb.org/secure/attachment/73287/dump.sql.gz

            I don't know if this helps, but it was happening randomly due to the double join on inventory_stock_X table.
            Sometimes the optimizer chose different path which led to extremely high execution times.

            Eliminating the second join, eliminated the issue as well.

            I'm not sure why the optimizer would fail to handle the second join on the same table consistently.

            Incidentally on mysql (not mariadb) this issue is non-existent.

            ioweb.gr Gabriel Tziotzis added a comment - I don't know if this helps, but it was happening randomly due to the double join on inventory_stock_X table. Sometimes the optimizer chose different path which led to extremely high execution times. Eliminating the second join, eliminated the issue as well. I'm not sure why the optimizer would fail to handle the second join on the same table consistently. Incidentally on mysql (not mariadb) this issue is non-existent.

            People

              serg Sergei Golubchik
              ioweb.gr Gabriel Tziotzis
              Votes:
              1 Vote for this issue
              Watchers:
              5 Start watching this issue

              Dates

                Created:
                Updated:

                Git Integration

                  Error rendering 'com.xiplink.jira.git.jira_git_plugin:git-issue-webpanel'. Please contact your Jira administrators.