Details
-
Bug
-
Status: Closed (View Workflow)
-
 Critical
-
Resolution: Fixed
-
N/A
-
None
Description
By "forever" in the summary I mean that I have never seen it finish, the longest I waited before interrupting was ~1 hour.
The test uses all default server startup options, loads original data set from MDEV-28073 (xpo_full_testcase.sql), runs ANALYZE PERSISTENT FOR ALL on all tables, and executes EXPLAIN for a query structured identically to MDEV-28073 (minus a couple of last JOINs), but the tables and fields in the query are mixed up - that is, different tables and fields from the dataset appear in different JOIN positions and conditions. The exact query will be provided.
A slight abnormality of this particular query is that one of ON conditions compares a datetime field to a string literal (not convertible into a proper date time), and thus produces Truncated incorrect datetime value warning (ER_TRUNCATED_WRONG_VALUE). I'm not sure whether it's a decisive factor for the problem, but it's possible. Except for this condition, the query is identical to MDEV-28928.
The query was executed with EXPLAIN FORMAT=JSON on several different versions/builds for comparison. All builds are non-debug.
|
preview-10.10-optimizer f332260c98 |
| 4 | root | localhost:36260 | test | Query | 590 | Statistics | EXPLAIN FORMAT=JSON SELECT * FROM ((((((((((((((((
|
...
|
It looks the same with optimizer_prune_level=2 (default) and 1.
|
preview-10.10-optimizer, MDEV-28852 baseline (07a31de109) |
MariaDB [test]> EXPLAIN FORMAT=JSON SELECT * FROM ((((((((((((((((
|
...
|
1 row in set, 1 warning (36.832 sec)
|
|
10.6 main 0e4cf497 |
MariaDB [test]> EXPLAIN FORMAT=JSON SELECT * FROM ((((((((((((((((
|
...
|
1 row in set, 1 warning (9.314 sec)
|
Attachments


Issue Links
- is caused by
-
-
- Closed
-
- relates to
-
MDEV-28852 Improve optimization of joins with many tables, including eq_ref tables
-

- Closed
-
Activity
Note: the used 10.6 main 0e4cf497 does include commits for MDEV-28073.
What you experience with MDEV-28929 is some what expected:
- The solution i created for for
MDEV-28073will make it much more likely to find a good plan fast.
Finding a good plan fast, will allow the greedy_optimizer to shortcut most of the other plans and thus
produce a plan in a reasonable time - If there is no good reasonable easy to find query plan for multiple tables, then it will take "forever" for
the optimizer to find a good plan as all plans are bad! Executing any of the plans (if there are a lot of rows) is also likely to take forever. For such bad plans, the only solution with current code is to reduce 'optimizer_search_depth' and try again. For example your query runs in 0.5 seconds with search depth 10. - The original problematic query had reasonable keys that could be used and the new code will be able to find a good plan reasonable fast (< 1 second and 238978 Optimizer_join_prefixes_check_calls)
Table statistics according to 10.6:
table rows after_selectivity
|
tbl0 1328 (TODO check)
|
tbl1 1328 -
|
tbl2 1314 1
|
tbl3 86 0 << !!!
|
tbl4 123 -
|
tbl5 1314 -
|
tbl6 1314 1
|
tbl7 1314 1.92
|
tbl8 86 -
|
tbl9 619 -
|
tbl10 123 1
|
tbl11 1328 0.001 // NOTE: very low
|
tbl12 344460 // !!! no indexes?
|
tbl13 1314 -
|
tbl14 344460 1
|
tbl15 1314
|
tbl16 86
|
tbl17 123
|
tbl18 619
|
tbl19 344460 // !! no indexes?
|
tbl20 1328
|
tbl21 344460 // !! no indexes ?
|
Note the tbl3 with rows=0. This does cause rows_for_plan=0 during join optimization. And this causes very low join->best_read=8155.6 for the query.
In 10.10, tbl3 has
86 0.69
|
And the join cost (with optimizer_search_depth=0, which means "auto") is: join->best_read=9.92807e+40
There are two other cases examples of Bad Tables in the query: tbl13 and tbl15 have plenty of rows and no usable keys. They are "not as bad" as tbl19, tbl21, but probably may cause the same effect:
*************************** 13. row ***************************
|
id: 1
|
select_type: SIMPLE
|
table: tbl13
|
type: ALL
|
possible_keys: NULL
|
key: NULL
|
key_len: NULL
|
ref: NULL
|
rows: 1314
|
Extra: Using where; Using join buffer (flat, BNL join)
|
*************************** 14. row ***************************
|
id: 1
|
select_type: SIMPLE
|
table: tbl15
|
type: ALL
|
possible_keys: NULL
|
key: NULL
|
key_len: NULL
|
ref: NULL
|
rows: 1314
|
Extra: Using where; Using join buffer (incremental, BNL join)
|
Note that they are in the middle of the join order:
+------+-------------+-------+------+-----------------------------------+-----------------+---------+----------------------------------------------------------------+------+--------------------------------------------------------+
|
| id | select_type | table | type | possible_keys | key | key_len | ref | rows | Extra |
|
+------+-------------+-------+------+-----------------------------------+-----------------+---------+----------------------------------------------------------------+------+--------------------------------------------------------+
|
| 1 | SIMPLE | tbl4 | ALL | NULL | NULL | NULL | NULL | 123 | Using where |
|
| 1 | SIMPLE | tbl2 | ref | assignment_group,number,a_str_4 | number | 123 | const | 1 | Using index condition; Using where |
|
| 1 | SIMPLE | tbl6 | ref | number,a_ref_9 | number | 123 | const | 1 | Using index condition; Using where |
|
| 1 | SIMPLE | tbl10 | ref | category | category | 99 | const | 1 | Using index condition; Using where |
|
| 1 | SIMPLE | tbl14 | ref | PRIMARY,sys_scope,sys_update_name | sys_scope | 99 | const | 1 | Using index condition; Using where |
|
| 1 | SIMPLE | tbl3 | ref | related_id_2 | related_id_2 | 97 | test.tbl2.assignment_group | 43 | Using index condition |
|
| 1 | SIMPLE | tbl17 | ALL | NULL | NULL | NULL | NULL | 123 | Using where; Using join buffer (flat, BNL join) |
|
| 1 | SIMPLE | tbl9 | ALL | cost_center | NULL | NULL | NULL | 619 | Using where; Using join buffer (incremental, BNL join) |
|
| 1 | SIMPLE | tbl8 | ref | metric_type | metric_type | 99 | test.tbl9.cost_center | 21 | Using where |
|
| 1 | SIMPLE | tbl18 | ref | cost_center,sys_domain_path | sys_domain_path | 768 | test.tbl2.a_str_4 | 610 | Using index condition |
|
| 1 | SIMPLE | tbl5 | ref | sys_domain_path | sys_domain_path | 768 | test.tbl4.description | 1314 | Using index condition |
|
| 1 | SIMPLE | tbl7 | ref | a_ref_8 | a_ref_8 | 99 | test.tbl6.a_ref_9 | 641 | |
|
| 1 | SIMPLE | tbl13 | ALL | NULL | NULL | NULL | NULL | 1314 | Using where; Using join buffer (flat, BNL join) |
|
| 1 | SIMPLE | tbl15 | ALL | NULL | NULL | NULL | NULL | 1314 | Using where; Using join buffer (incremental, BNL join) |
|
| 1 | SIMPLE | tbl11 | ref | reference_value | reference_value | 97 | test.tbl10.string_option | 649 | Using index condition |
|
| 1 | SIMPLE | tbl20 | ref | source_table,instance | source_table | 243 | test.tbl14.sys_update_name | 442 | Using index condition |
|
| 1 | SIMPLE | tbl1 | ref | reference_value,source_id | source_id | 97 | test.tbl20.instance | 57 | Using index condition; Using where |
|
| 1 | SIMPLE | tbl16 | ref | related_id_4 | related_id_4 | 97 | test.tbl1.reference_value | 43 | Using where |
|
| 1 | SIMPLE | tbl0 | ref | source_id | source_id | 97 | test.tbl1.reference_table | 57 | Using index condition |
|
| 1 | SIMPLE | tbl12 | ref | sys_update_name,sys_class_name | sys_update_name | 996 | test.tbl16.related_table_1,test.tbl13.additional_assignee_list | 1 | Using index condition; Using where |
|
+------+-------------+-------+------+-----------------------------------+-----------------+---------+----------------------------------------------------------------+------+--------------------------------------------------------+
|
20 rows in set (4.754 sec)
|
Indeed, removing them makes the query fast on 10.6:
EXPLAIN time on 10.6:
| original query | 40 sec |
| remove tbl19, tbl21 | 4 sec |
| also remove tbl13, tbl15 | 0.14 sec |
On 10.10, it still never finishes.
... Modified 10.6 to NOT return rows=0 from histogram estimates (return 1 instead).
For query without
tbl19, tbl21, tbl13, tbl15, EXPLAIN now runs in 1.2 sec (slower). join->best_read=7.05545e+18 (a lot closer to 10.10)
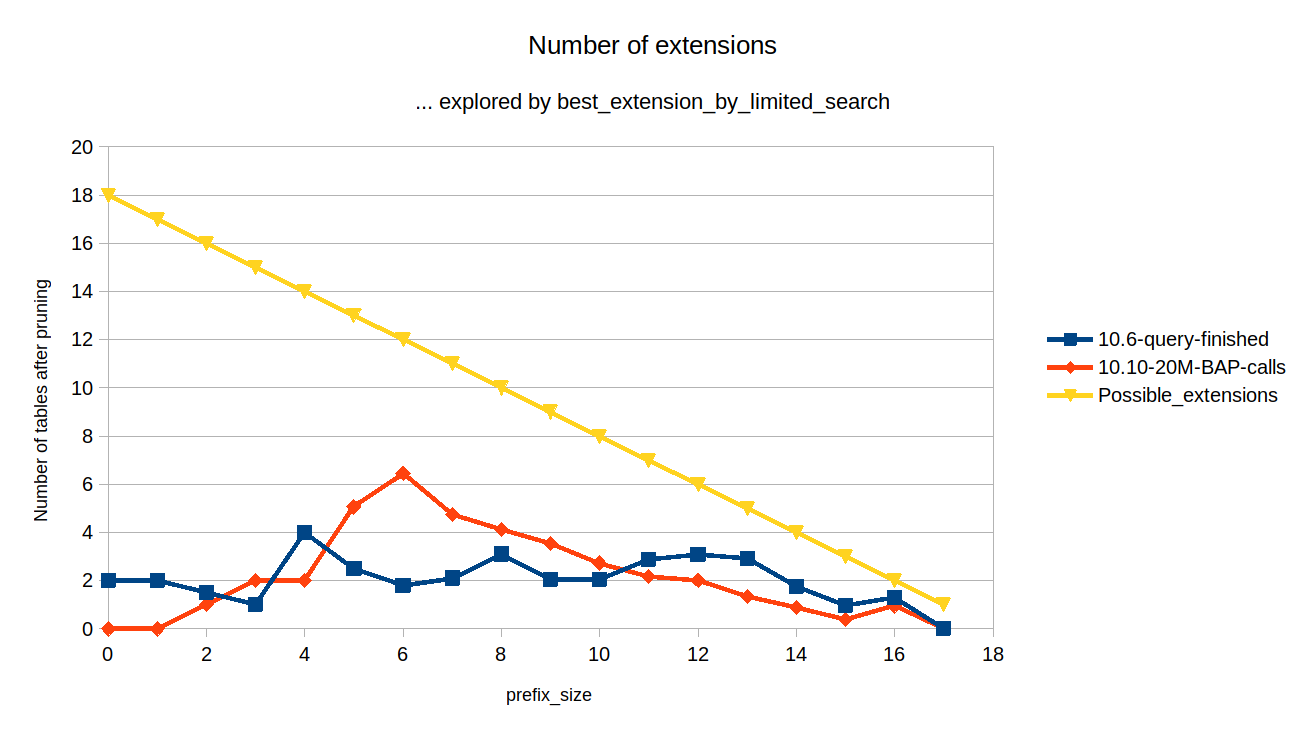
bap_calls=1,403,449.
Number of best_access_path calls for the query without tbl19, tbl21, tbl13, tbl15 :
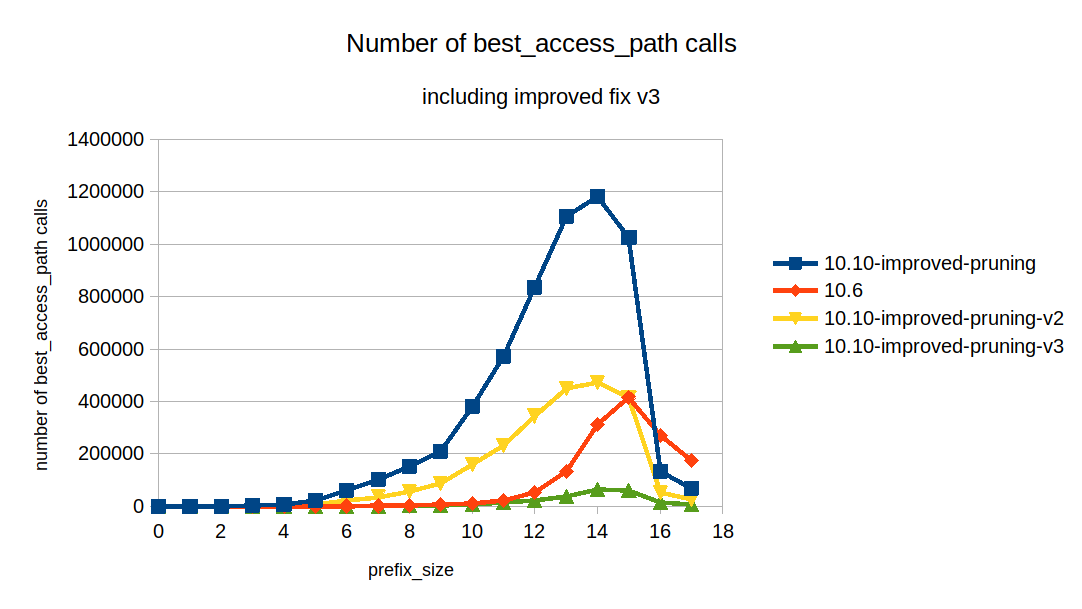
MariaDB 10.6 has finished after doing 1.4M calls. MariaDB 10.10 was interrupted after it has made 20M best_access_path calls:
| idx= | MariaDB-10.6 | MariaDB-10.10 |
| 0 | 18 | 18 |
| 1 | 34 | 17 |
| 2 | 64 | 32 |
| 3 | 90 | 60 |
| 4 | 84 | 140 |
| 5 | 312 | 429 |
| 6 | 720 | 2148 |
| 7 | 1188 | 12771 |
| 8 | 2280 | 55310 |
| 9 | 6372 | 205749 |
| 10 | 11616 | 649456 |
| 11 | 21000 | 1554553 |
| 12 | 51696 | 2899647 |
| 13 | 133740 | 4827560 |
| 14 | 312784 | 5133676 |
| 15 | 416364 | 3393786 |
| 16 | 269238 | 856000 |
| 17 | 175849 | 408648 |
| TOTAL | 1403449 | 20000000 |
10.10 starts to make more calls at idx=4...
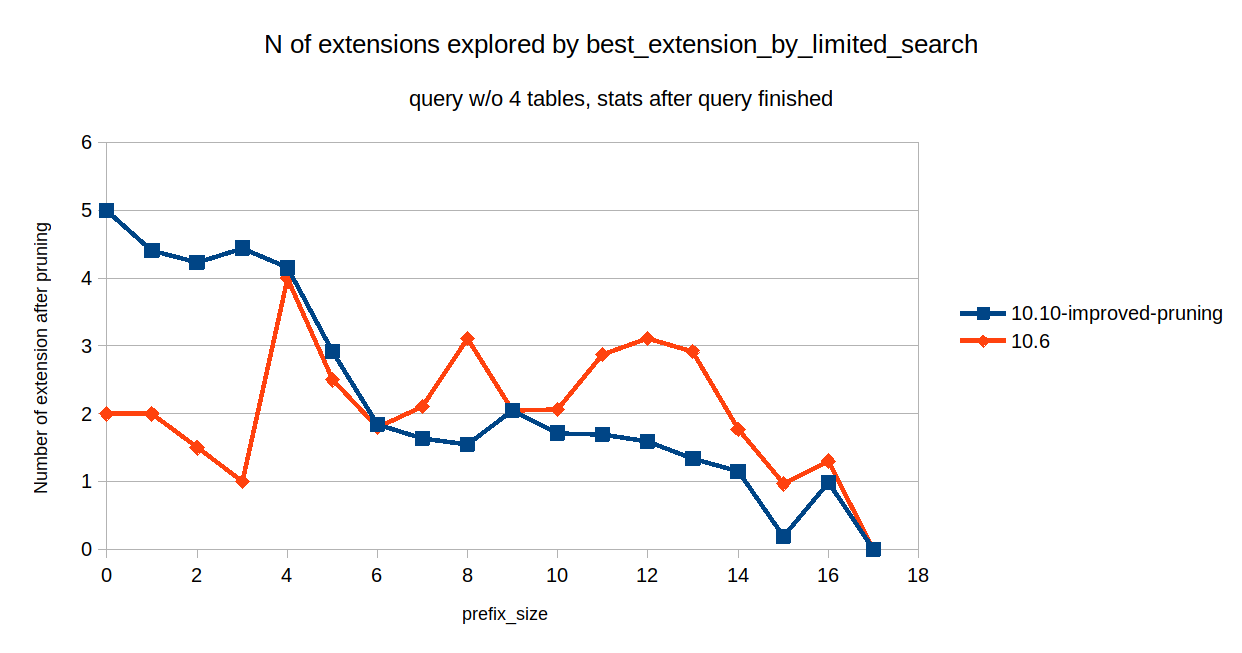
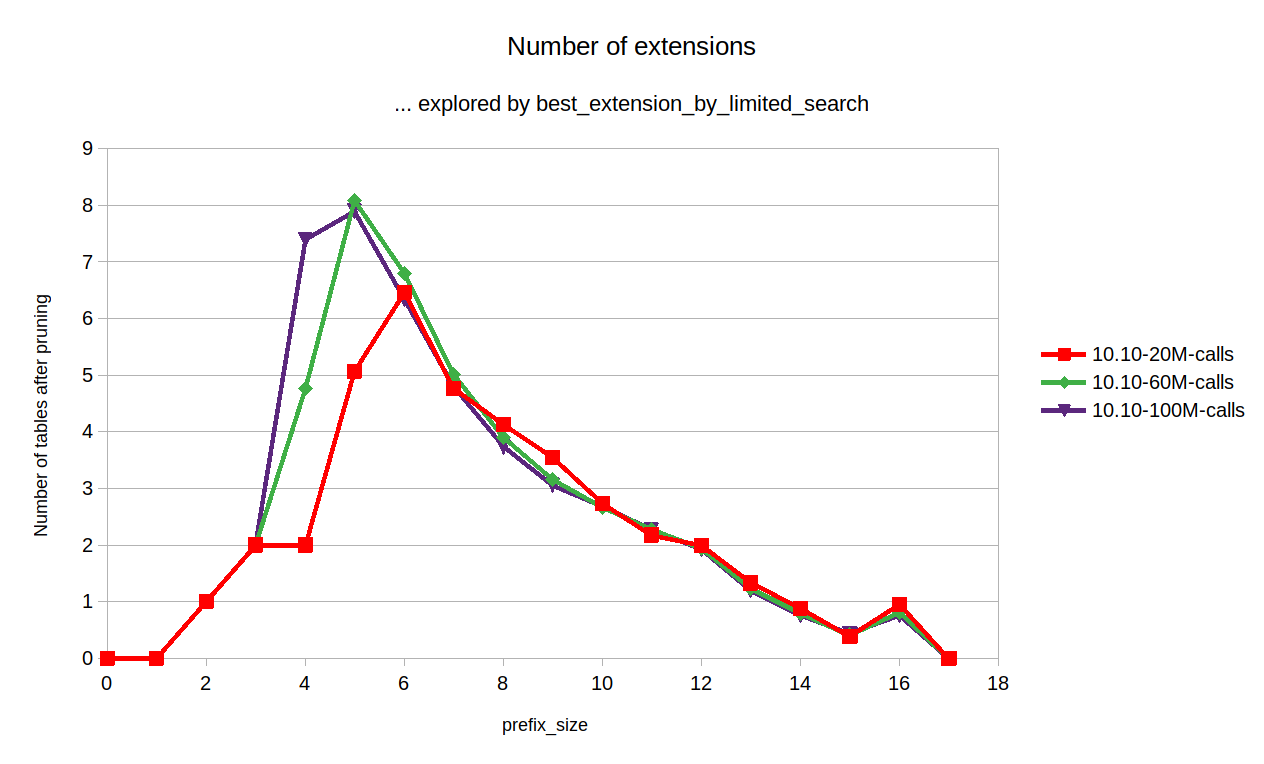
Looking at the number of extensions that best_extension_by_limited_search is exploring for different prefix size.

Note that 10.10 is exploring more for prefix_size=6.
I continued to run 10.10 and note the extension counts:

pruning doesn't seem to be working at prefix_size=4.
On the question of cost: 10.10 Does seem to find query plans with better cost eventually:
MariaDB 10.6:
| BAP_calls | join_best_read |
| 1.4M | 7.05545e+18 |
MariaDB-10.10
| BAP_calls | join_best_read |
| 1M | 1.98955e+17 |
| 2M | 5.78458e+11 |
| 40M | 2.34823e+09 |
So, pruning works poorly in 10.10.
Trying to find the reason for it.
/* |
Prune some less promising partial plans. This heuristic may miss
|
the optimal QEPs, thus it results in a non-exhaustive search.
|
*/
|
if (prune_level >= 1) |
{
|
if (best_record_count > current_record_count || |
best_read_time > current_read_time ||
|
(idx == join->const_tables && // 's' is the first table in the QEP |
s->table == join->sort_by_table))
|
{
|
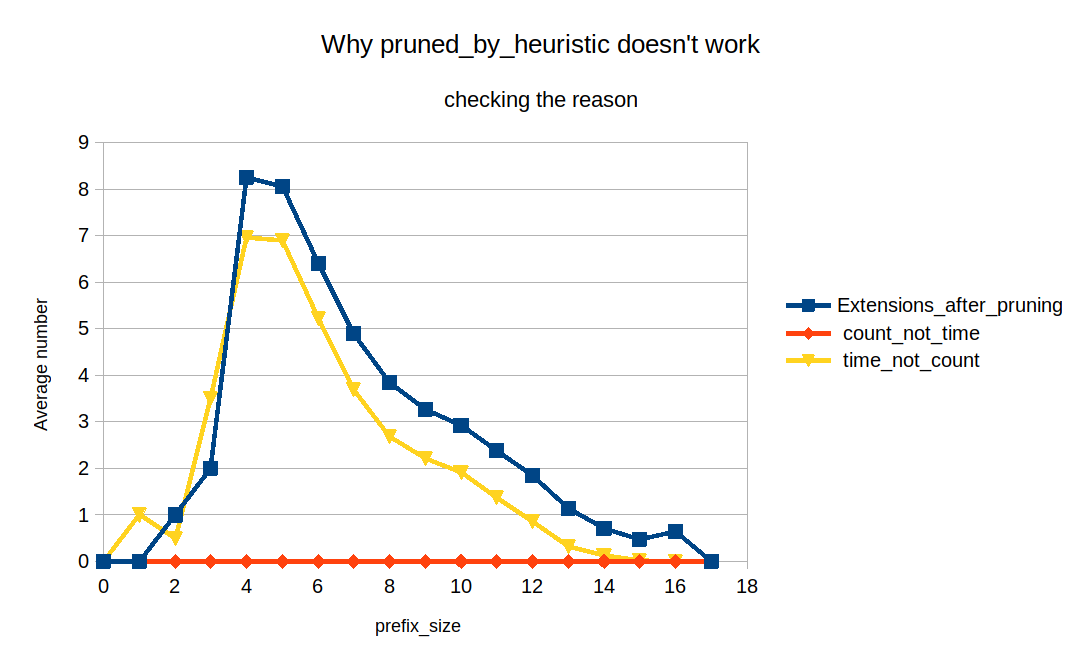
Added:
if (best_record_count >= current_record_count && |
!(best_read_time >= current_read_time))
|
join->n_count_not_time[idx]++;
|
|
if (!(best_record_count >= current_record_count) && |
(best_read_time >= current_read_time))
|
join->n_time_not_count[idx]++;
|
So, n_time_not_count is large, that is, typically we have
- (best_record_count < current_record_count)
- (best_read_time >= current_read_time)
that is
1. current_record_count > best_record_count, but
2. current_read_time <= best_read_time
The first makes sense, because sort_position() orders SORT_POSITION entries by records_read:
sort_positions(SORT_POSITION *a, SORT_POSITION *b)
|
{
|
int cmp;
|
if ((cmp= compare_embedding_subqueries(*a->join_tab, *b->join_tab)) != 0)
|
return cmp;
|
|
if (a->position->records_read > b->position->records_read)
|
return 1;
|
if (a->position->records_read < b->position->records_read)
|
return -1;
|
and then we try different extensions ordered by their records_read.
However we get the plans that have current_read_time <= best_read_time, that is, their read_time higher than read_time of the first option we've looked at.
This is a bit surprising as read_time includes #records/TIME_FOR_COMPARE so generally entries with higher read_time would have higher records_read as well?
An example from the debugger (query with no t13,t15,t19,t21):
join prefix: tbl8 tbl2 tbl4 tbl20 tbl9
|
record_count=15419.253
|
pos[-1]->position:
|
tbl12
|
type= JT_ALL
|
records_read= 0.281752
|
read_time= 1158815.9(1.15M)
|
position:
|
tbl6
|
type=JT_REF
|
records_read = 1
|
read_time = 17387.8
|
pos[1]->position:
|
tbl10
|
JT_REF
|
records_read= 1
|
read_time= 17383.3
|
pos[2]->position:
|
tbl14
|
JT_REF
|
records_read=1
|
read_time= 15624.9
|
pos[3]->position:
|
tbl1
|
JT_REF
|
records_read=57.73
|
read_time=896387.20
|
tbl12 is sorted first as it has low records_read. However, it has a high read_time!
Do the numbers for tbl12 make sense?
They look plausible:
"selectivity_for_indexes": [],
|
"selectivity_for_columns": [
|
{
|
"column_name": "sys_created_on",
|
"ranges": [
|
"0000-00-00 00:00:00 <= sys_created_on <= 0000-00-00 00:00:00"
|
],
|
"selectivity_from_histogram": 8.179528e-7
|
}
|
],
|
"cond_selectivity": 8.179528e-7
|
},
|
{
|
"table": "tbl12",
|
"table_scan": {
|
"rows": 344460,
|
"cost": 3949
|
}
|
},
|
The table has a lot of rows but the condition is very selective:
344460 * 8.179528e-7 = 0.28175 rows.
Playing with a patch which fixes the heuristic pruning (Description to follow).
Now the query without the 4 tables finishes in reasonable time.
| 10.6 | 10.10-fixed-pruning | |
| explain time | 1.197 sec | 4.506 sec |
| BAP_calls | 1.4M | 5.8M |
| join->best_read | 7.05545e+18 | 2.0189e+17 |
(explain time is inexact as this is debug build talking to stderr, etc)
Pruning:

Improved heuristic pruning certainly helps, but is still does a lot less pruning than 10.6.
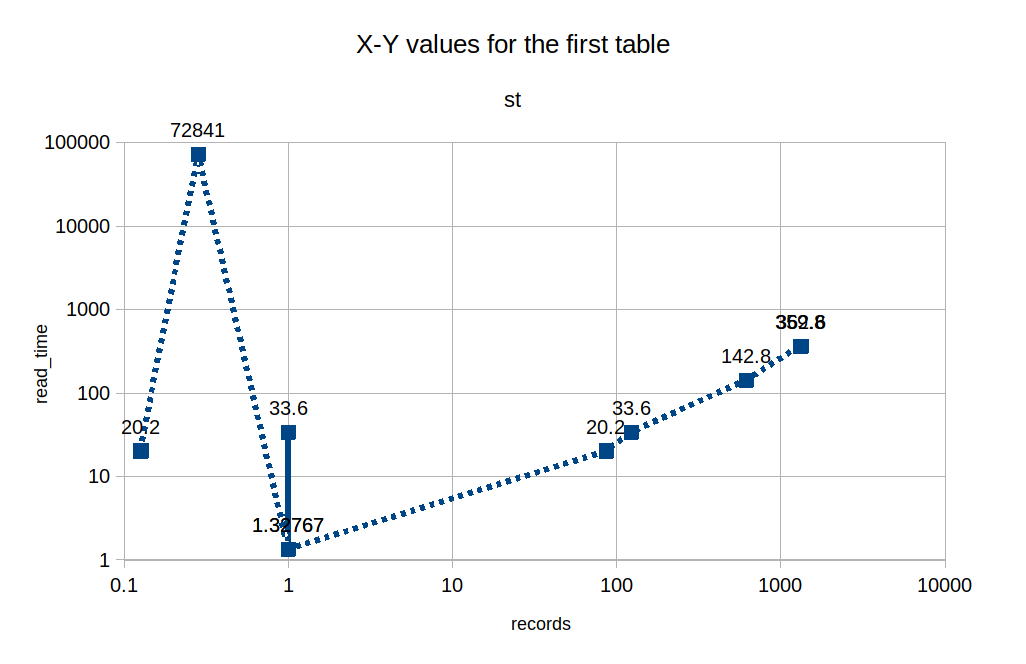
Investigating what happens for 10.0:
| Table | # | read_time | records | outcome |
| tbl8 | 1 | 0.125977 | 20.2 | new_best-1 |
| tbl12 | 2 | 0.281752 | 72841 | pruned_by_heuristic |
| tbl2 | 3 | 1 | 1.32767 | new_best-2 |
| tbl4 | 4 | 1 | 33.6 | pruned_by_heuristic |
| tbl6 | 5 | 1 | 1.32767 | no_pruning |
| tbl10 | 6 | 1 | 1.32738 | no_pruning |
| tbl14 | 7 | 1 | 1.32738 | no_pruning |
| tbl3 | 8 | 86 | 20.2 | pruned_by_heuristic |
| tbl16 | 9 | 86 | 20.2 | pruned_by_heuristic |
| tbl17 | 10 | 123 | 33.6 | pruned_by_heuristic |
| tbl9 | 11 | 619 | 142.8 | pruned_by_heuristic |
| tbl18 | 12 | 619 | 142.8 | pruned_by_heuristic |
| tbl5 | 13 | 1314 | 359.8 | pruned_by_heuristic |
| tbl7 | 14 | 1314 | 359.8 | pruned_by_heuristic |
| tbl0 | 15 | 1328 | 362.6 | pruned_by_heuristic |
| tbl1 | 16 | 1328 | 362.6 | pruned_by_heuristic |
| tbl11 | 17 | 1328 | 362.6 | pruned_by_heuristic |
| tbl20 | 18 | 1328 | 362.6 | pruned_by_heuristic |


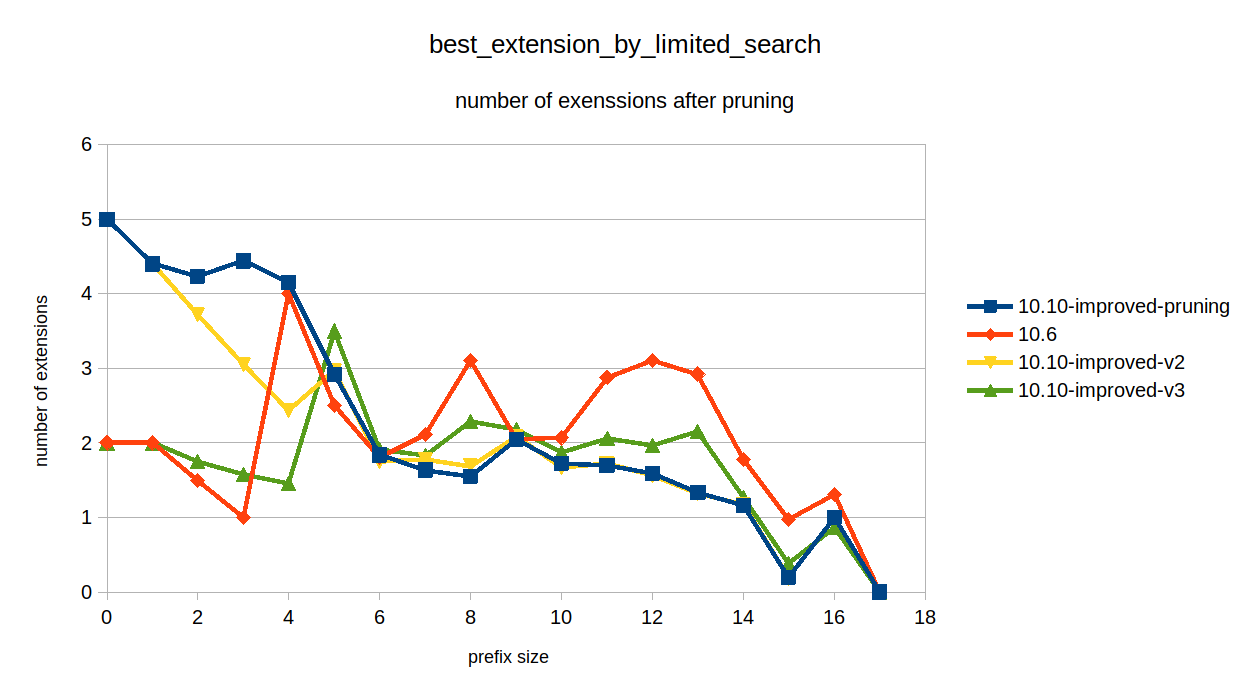
The V3 patch helps with all EXPLAINs:
- the query without tbl19, tbl21, tbl13, tbl15 - finishes faster than in 10.6
- the query without tbl19, tbl21 - finishes in 0.68 sec
- the original query finishes in 3.341 sec.
(This is on a debug build)
The idea behind pruned_by_heuristic
Let's think of possible query plans considered in best_extension_by_limited_search. The query plans have common join prefix. After adding a table, we get:
1. read_time. This includes the time spent reading the added table.
2. record_count. The number of row combination we will pass to further parts of the query plan.
3. The cost of the rest of the query plan. We dont know this but it's a function of the choice we've made right now.
Doing the pruning.
Let's not think about #3, and just focus on #1 and #2. This is "the heuristic".
We don't know the "exchange ratio" between read_time and record_count. But we can tell that if both are bigger, then the query plan is less promising.
This is how pruning works. We discard the plans that have both higher read_time and higher record_count as they are less promising.
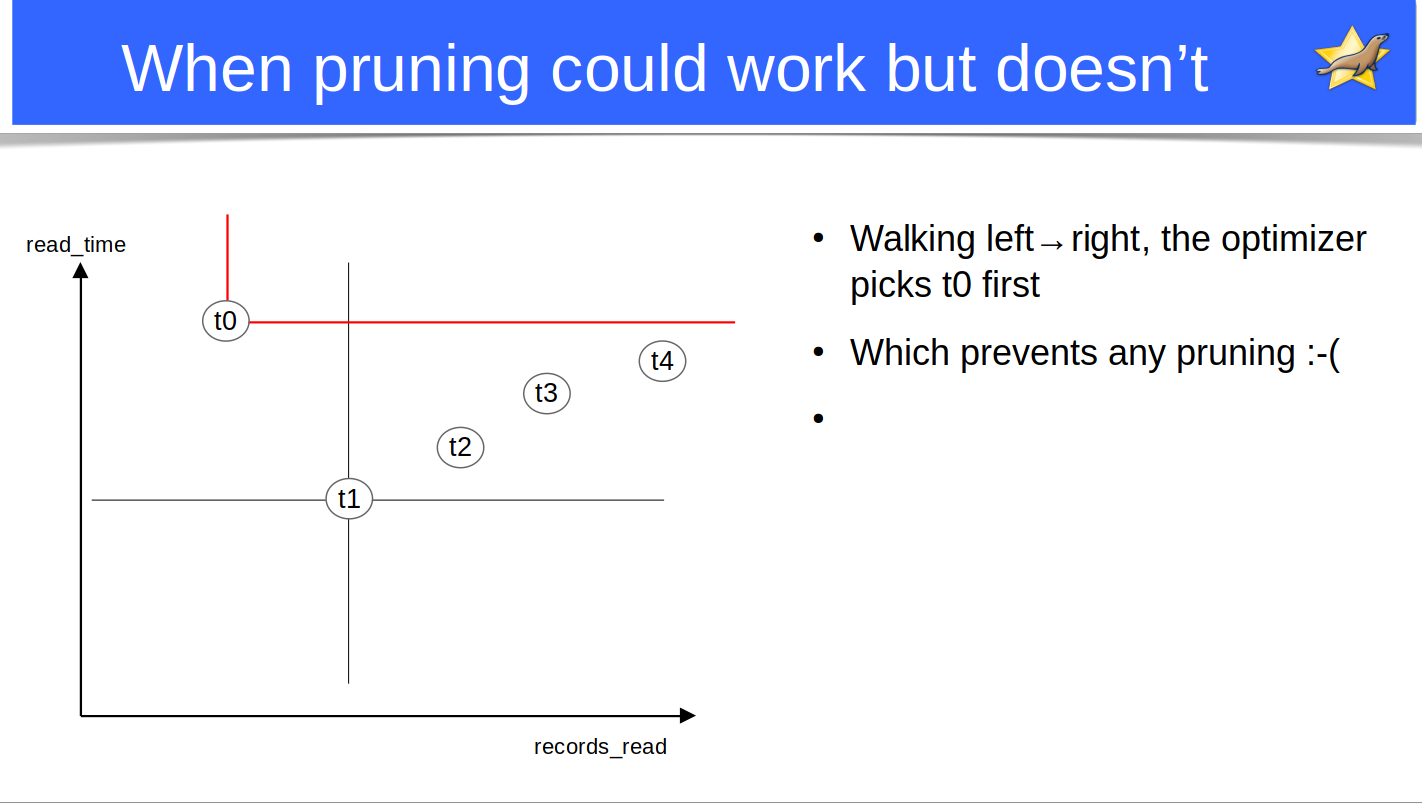
Limitations of pruning
The optimizer considers tables ordered by their record_count.
But it uses A DIFFERENT pruning criteria:
PLAN_X.record_count >= PLAN_Y.record_count AND PLAN_X.read_time >= PLAN_Y.read_time
|
Which means the "best" tables to do pruning are not necessarily the first. We can get cases like this:

where the the table with least record_count is picked as "best" and is unable to do any pruning.
Ideally, we should have ordered the tables by their capacity to prune away other tables. This seems hard to do (I can only think of N^2 algorithms).
A workaround algorithm:
- walk the tables from smaller to bigger record_count.
- also keep another kind of "best" table, the one with the smallest read_time.
- use both to do pruning.
This is what V3 patch in the psergey-mdev28929-improved-pruning-v3.diff does.
does.
The final version of the patch:
https://github.com/MariaDB/server/commit/ac3b3807cc9b21e23e65b1a70c7dcda1f45a3c57
in bb-10.10-mdev28929-v4
Trying to analyze... on 10.6, it takes 43 seconds on debug build, but with optimizer_trace=1, optimizer_trace_max_mem_size=1G it hasn't finished in 30 min.
Looking at the trace:
...#24 0x00005588b0b7650f in best_extension_by_limited_search (join=0x7f0ca02f9fc0, remaining_tables=4044963, idx=9, record_count=0, read_time=88.86961349375116, search_depth=53,prune_level=1, use_cond_selectivity=4) at /home/psergey/dev-git2/10.6-optimizer-look/sql/sql_select.cc:10130#25 0x00005588b0b7650f in best_extension_by_limited_search (join=0x7f0ca02f9fc0, remaining_tables=4045475, idx=8, record_count=0, read_time=88.86961349375116, search_depth=54,prune_level=1, use_cond_selectivity=4) at /home/psergey/dev-git2/10.6-optimizer-look/sql/sql_select.cc:10130#26 0x00005588b0b7650f in best_extension_by_limited_search (join=0x7f0ca02f9fc0, remaining_tables=4176547, idx=7, record_count=0, read_time=78.86961349375116, search_depth=55,prune_level=1, use_cond_selectivity=4) at /home/psergey/dev-git2/10.6-optimizer-look/sql/sql_select.cc:10130#27 0x00005588b0b7650f in best_extension_by_limited_search (join=0x7f0ca02f9fc0, remaining_tables=4176563, idx=6, record_count=5.4170105866999343,read_time=44.269613493751166, search_depth=56, prune_level=1, use_cond_selectivity=4) at /home/psergey/dev-git2/10.6-optimizer-look/sql/sql_select.cc:10130#28 0x00005588b0b7650f in best_extension_by_limited_search (join=0x7f0ca02f9fc0, remaining_tables=4176819, idx=5, record_count=43, read_time=23.011406774488858,search_depth=57, prune_level=1, use_cond_selectivity=4) at /home/psergey/dev-git2/10.6-optimizer-look/sql/sql_select.cc:10130#29 0x00005588b0b7650f in best_extension_by_limited_search (join=0x7f0ca02f9fc0, remaining_tables=4176827, idx=4, record_count=1, read_time=5.310106805004577, search_depth=58,prune_level=1, use_cond_selectivity=4) at /home/psergey/dev-git2/10.6-optimizer-look/sql/sql_select.cc:10130#30 0x00005588b0b7650f in best_extension_by_limited_search (join=0x7f0ca02f9fc0, remaining_tables=4193211, idx=3, record_count=1, read_time=3.9827265791882818,search_depth=59, prune_level=1, use_cond_selectivity=4) at /home/psergey/dev-git2/10.6-optimizer-look/sql/sql_select.cc:10130#31 0x00005588b0b7650f in best_extension_by_limited_search (join=0x7f0ca02f9fc0, remaining_tables=4194235, idx=2, record_count=1, read_time=2.6553463533719865,search_depth=60, prune_level=1, use_cond_selectivity=4) at /home/psergey/dev-git2/10.6-optimizer-look/sql/sql_select.cc:10130#32 0x00005588b0b7650f in best_extension_by_limited_search (join=0x7f0ca02f9fc0, remaining_tables=4194299, idx=1, record_count=1, read_time=1.3276731766859933,search_depth=61, prune_level=1, use_cond_selectivity=4) at /home/psergey/dev-git2/10.6-optimizer-look/sql/sql_select.cc:10130#33 0x00005588b0b7650f in best_extension_by_limited_search (join=0x7f0ca02f9fc0, remaining_tables=4194303, idx=0, record_count=1, read_time=0, search_depth=62, prune_level=1,use_cond_selectivity=4) at /home/psergey/dev-git2/10.6-optimizer-look/sql/sql_select.cc:10130#34 0x00005588b0b73ca7 in greedy_search (join=0x7f0ca02f9fc0, remaining_tables=4194303, search_depth=62, prune_level=1, use_cond_selectivity=4)at /home/psergey/dev-git2/10.6-optimizer-look/sql/sql_select.cc:9165#35 0x00005588b0b72f0d in choose_plan (join=0x7f0ca02f9fc0, join_tables=4194303) at /home/psergey/dev-git2/10.6-optimizer-look/sql/sql_select.cc:8728...I can see that record_count becomes 0 at some point. I suppose this would prevent pruning...