Uploaded image for project: 'MariaDB Server'
  1. MariaDB Server
  2. MDEV-27031

InnoDB: Assertion failure in file D:\winx64-packages\build\src\storage\innobase\trx\trx0trx.cc line 1288

Details

    Description

      Several times a day the MariaDB windows services crashes. Every time the same error in the log is shown. Please advise which steps to take to fix it. I am using version:

      Server version: 10.6.1-MariaDB - mariadb.org binary distribution

      Error log:

      2021-11-12 08:27:15 0x37d8 InnoDB: Assertion failure in file D:\winx64-packages\build\src\storage\innobase\trx\trx0trx.cc line 1288
      InnoDB: Failing assertion: UT_LIST_GET_LEN(lock.trx_locks) == 0
      InnoDB: We intentionally generate a memory trap.
      InnoDB: Submit a detailed bug report to https://jira.mariadb.org/
      InnoDB: If you get repeated assertion failures or crashes, even
      InnoDB: immediately after the mysqld startup, there may be
      InnoDB: corruption in the InnoDB tablespace. Please refer to
      InnoDB: https://mariadb.com/kb/en/library/innodb-recovery-modes/
      InnoDB: about forcing recovery.
      211112 8:27:15 [ERROR] mysqld got exception 0x80000003 ;
      This could be because you hit a bug. It is also possible that this binary
      or one of the libraries it was linked against is corrupt, improperly built,
      or misconfigured. This error can also be caused by malfunctioning hardware.

      To report this bug, see https://mariadb.com/kb/en/reporting-bugs

      We will try our best to scrape up some info that will hopefully help
      diagnose the problem, but since we have already crashed,
      something is definitely wrong and this may fail.

      Server version: 10.6.1-MariaDB
      key_buffer_size=134217728
      read_buffer_size=131072
      max_used_connections=141
      max_threads=65537
      thread_count=120
      It is possible that mysqld could use up to
      key_buffer_size + (read_buffer_size + sort_buffer_size)*max_threads = 139782 K bytes of memory
      Hope that's ok; if not, decrease some variables in the equation.

      Thread pointer: 0x27a7abc4038
      Attempting backtrace. You can use the following information to find out
      where mysqld died. If you see no messages after this, something went
      terribly wrong...
      server.dll!my_parameter_handler()[my_init.c:278]
      ucrtbase.dll!raise()
      ucrtbase.dll!abort()
      server.dll!ut_dbg_assertion_failed()[ut0dbg.cc:60]
      server.dll!trx_t::commit_in_memory()[trx0trx.cc:1288]
      server.dll!trx_t::commit()[trx0trx.cc:1511]
      server.dll!trx_commit_for_mysql()[trx0trx.cc:1625]
      server.dll!innobase_commit()[ha_innodb.cc:4417]
      server.dll!commit_one_phase_2()[handler.cc:1999]
      server.dll!ha_commit_one_phase()[handler.cc:1980]
      server.dll!ha_commit_trans()[handler.cc:1772]
      server.dll!trans_commit_stmt()[transaction.cc:473]
      server.dll!mysql_execute_command()[sql_parse.cc:6047]
      server.dll!mysql_parse()[sql_parse.cc:8023]
      server.dll!dispatch_command()[sql_parse.cc:1899]
      server.dll!do_command()[sql_parse.cc:1406]
      server.dll!threadpool_process_request()[threadpool_common.cc:395]
      server.dll!tp_callback()[threadpool_common.cc:203]
      KERNEL32.DLL!LCMapStringEx()
      ntdll.dll!RtlAddRefActivationContext()
      ntdll.dll!RtlAcquireSRWLockExclusive()
      KERNEL32.DLL!BaseThreadInitThunk()
      ntdll.dll!RtlUserThreadStart()

      Trying to get some variables.
      Some pointers may be invalid and cause the dump to abort.
      Query (0x27a7a987720): SELECT

      i.ips_id,

      i.event_type_id,

      i.event_type,

      i.category,

      i.ts,

      i.log_comment,

      i.log_decision,

      i.log_topwind_user,

      i.log_observations,

      i.log_actions,

      i.log_pictures,

      md.meteo_datetime > DATE_SUB(i.ts, INTERVAL 5 MINUTE) as ShowSensor,

      md_one_hour_ago.meteo_datetime > DATE_SUB(md.meteo_datetime, INTERVAL 2 HOUR) as ShowSensorDiff,

      round(md.temperature,1) as Temp,

      sign(round(1/0.2*

      (md.temperature-md_one_hour_ago.temperature)

      /(TIMESTAMPDIFF(minute,md_one_hour_ago.meteo_datetime,md.meteo_datetime)/60)

      )) as Temp_Change_Sign,

      round(

      (md.temperature-md_one_hour_ago.temperature)

      /(TIMESTAMPDIFF(minute,md_one_hour_ago.meteo_datetime,md.meteo_datetime)/60),

      1

      ) as Temp_Change,

      round(md.relative_humidity) as Humidity,

      sign(round(1/3*

      (md.relative_humidity-md_one_hour_ago.relative_humidity)

      /(TIMESTAMPDIFF(minute,md_one_hour_ago.meteo_datetime,md.meteo_datetime)/60)

      )) as Humidity_Change_Sign,

      round(

      (md.relative_humidity-md_one_hour_ago.relative_humidity)

      /(TIMESTAMPDIFF(minute,md_one_hour_ago.meteo_datetime,md.meteo_datetime)/60),

      0

      ) as Humidity_Change,

      md.precipitation as Precip,

      sign(

      (md.precipitation-md_one_hour_ago.precipitation)

      ) as Precip_Change_Sign,

      round(md.risk_number,0) as Risk,

      sign(round(1/5*

      (md.risk_number-md_one_hour_ago.risk_number)

      /(TIMESTAMPDIFF(minute,md_one_hour_ago.meteo_datetime,md.meteo_datetime)/60)

      )) as Risk_Change_Sign,

      round(

      (md.risk_number-md_one_hour_ago.risk_number)

      /(TIMESTAMPDIFF(minute,md_one_hour_ago.meteo_datetime,md.meteo_datetime)/60)

      ) as Risk_Change

      FROM

      (

      SELECT

      e.ips_id,

      event_type.event_type_id,

      event_type.event_type,

      'EventStart' as category,

      e.start_datetime as ts,

      NULL as log_comment,

      NULL as log_decision,

      NULL as log_topwind_user,

      NULL as log_observations,

      NULL as log_actions,

      NULL as log_pictures

      FROM

      event_recent e

      LEFT OUTER JOIN event_type ON e.event_type_id=event_type.event_type_id

      LEFT OUTER JOIN ips ON e.ips_id = ips.ips_id

      WHERE

      ips.ips_cluster_id=26 AND

      e.start_datetime > DATE_SUB(UTC_TIMESTAMP(), INTERVAL 1 DAY)

      UNION ALL

      SELECT

      e2.ips_id,

      event_type.event_type_id,

      event_type.event_type,

      'EventEnd',

      e2.end_datetime,

      NULL,NULL,NULL,NULL,NULL,NULL

      FROM

      event_recent e2

      LEFT OUTER JOIN event_type ON e2.event_type_id=event_type.event_type_id

      LEFT OUTER JOIN ips ON e2.ips_id = ips.ips_id

      WHERE

      e2.end_datetime is NOT NULL AND

      ips.ips_cluster_id=26 AND

      e2.end_datetime > DATE_SUB(UTC_TIMESTAMP(), INTERVAL 1 DAY)

      UNION ALL

      SELECT

      -1 as ips_id,

      NULL,

      NULL,

      'Log',

      log.datetime,

      comment as log_comment,

      decision.decision_nl as log_decision,

      topwind_user.username as log_topwind_user,

      IFNULL(GROUP_CONCAT(DISTINCT observation.observation_nl),'') as log_observations,

      IFNULL(GROUP_CONCAT(DISTINCT action.action_nl),'') as log_actions,

      IFNULL(GROUP_CONCAT(DISTINCT CONCAT(

      picture.turbine_id,';',

      picture.picture_datetime,';',

      picture.filename

      )),'') as log_pictures

      FROM

      log

      LEFT OUTER JOIN decision ON log.decision_id = decision.decision_id

      LEFT OUTER JOIN topwind_user ON log.topwind_user_id = topwind_user.topwind_user_id

      LEFT OUTER JOIN log_observation ON log.log_id = log_observation.log_id

      LEFT OUTER JOIN observation ON log_observation.observation_id = observation.observation_id

      LEFT OUTER JOIN log_action ON log.log_id = log_action.log_id

      LEFT OUTER JOIN action ON log_action.action_id = action.action_id

      LEFT OUTER JOIN picture ON log.log_id = picture.log_id

      WHERE log.ips_cluster_id=26 AND log.datetime>DATE_SUB(UTC_TIMESTAMP(), INTERVAL 1 DAY)

      GROUP BY log.log_id

      ) i

      LEFT OUTER JOIN `meteo_data_last_day` md ON md.ips_id = i.ips_id

      LEFT OUTER JOIN `meteo_data_last_day` md_one_hour_ago ON md_one_hour_ago.ips_id = i.ips_id

      WHERE

      (

      md.meteo_datetime = (

      SELECT MAX(`meteo_data_last_day`.`meteo_datetime`)

      FROM `meteo_data_last_day`

      WHERE ips_id = i.ips_id AND `meteo_data_last_day`.`meteo_datetime`<i.ts

      ) OR

      md.ips_id IS NULL

      ) AND

      (

      md_one_hour_ago.meteo_datetime = (

      SELECT MAX(`meteo_data_last_day`.`meteo_datetime`)

      FROM `meteo_data_last_day`

      WHERE ips_id = i.ips_id AND

      `meteo_data_last_day`.`meteo_datetime` < DATE_SUB(md.meteo_datetime, INTERVAL 1 HOUR)

      ) OR

      md_one_hour_ago.ips_id IS NULL

      )

      ORDER BY i.ts
      Connection ID (thread ID): 19138
      Status: NOT_KILLED

      Optimizer switch: index_merge=on,index_merge_union=on,index_merge_sort_union=on,index_merge_intersection=on,index_merge_sort_intersection=off,engine_condition_pushdown=off,index_condition_pushdown=on,derived_merge=on,derived_with_keys=on,firstmatch=on,loosescan=on,materialization=on,in_to_exists=on,semijoin=on,partial_match_rowid_merge=on,partial_match_table_scan=on,subquery_cache=on,mrr=off,mrr_cost_based=off,mrr_sort_keys=off,outer_join_with_cache=on,semijoin_with_cache=on,join_cache_incremental=on,join_cache_hashed=on,join_cache_bka=on,optimize_join_buffer_size=on,table_elimination=on,extended_keys=on,exists_to_in=on,orderby_uses_equalities=on,condition_pushdown_for_derived=on,split_materialized=on,condition_pushdown_for_subquery=on,rowid_filter=on,condition_pushdown_from_having=on,not_null_range_scan=off

      The manual page at https://mariadb.com/kb/en/how-to-produce-a-full-stack-trace-for-mysqld/ contains
      information that should help you find out what is causing the crash.
      Writing a core file at D:\MariaDB\data\

      Attachments

        1. 2021.11.22-tail-error-log.txt
          18 kB
        2. 2021-11-15 13_05_52-.png
          2021-11-15 13_05_52-.png
          60 kB
        3. all_threads_stack.txt
          161 kB
        4. my.ini
          1 kB
        5. mysqld.dmp
          1.04 MB
        6. TW-EDE-SRV01.tail.err
          9 kB
        7. windbg_unique_stacks.txt
          65 kB

        Issue Links

          Activity

            ruut Ruut added a comment -

            I ran mysqlcheck -A from the command line and all the tables are OK.

            ruut Ruut added a comment - I ran mysqlcheck -A from the command line and all the tables are OK.

            10.6.1 is an alpha release. The first generally available release was 10.6.3. The latest release in the series is 10.6.5.

            That said, this looks similar to MDEV-25163, which is claimed to affect 10.5.11. Because we have not repeated it internally, we cannot fix it yet.

            wlad, can you please provide assistance for obtaining stack traces for the crash?

            marko Marko Mäkelä added a comment - 10.6.1 is an alpha release. The first generally available release was 10.6.3. The latest release in the series is 10.6.5. That said, this looks similar to MDEV-25163 , which is claimed to affect 10.5.11. Because we have not repeated it internally, we cannot fix it yet. wlad , can you please provide assistance for obtaining stack traces for the crash?

            marko, the stack of the crashing thread is in the bug description, after "attempting backtrace", and looks ok. The actual mariadbd.dmp, or mysqld.dmp, is missing, so stacktraces of all threads are not currently available.

            ruut, maybe you can find a file with .dmp extension in your D:\MariaDB\data\ , and attach it to the bug?

            wlad Vladislav Vaintroub added a comment - marko , the stack of the crashing thread is in the bug description, after "attempting backtrace", and looks ok. The actual mariadbd.dmp, or mysqld.dmp, is missing, so stacktraces of all threads are not currently available. ruut , maybe you can find a file with .dmp extension in your D:\MariaDB\data\ , and attach it to the bug?
            ruut Ruut added a comment - - edited

            There is no mariadbd.dmp on my C: or D: drive (in fact I search for *.dmp without success). Can you give assistance on to make sure this file is created on future crashes.

            I upgraded to 10.6.5-MariaDB - mariadb.org binary distribution, but same problems still occur.

            ruut Ruut added a comment - - edited There is no mariadbd.dmp on my C: or D: drive (in fact I search for *.dmp without success). Can you give assistance on to make sure this file is created on future crashes. I upgraded to 10.6.5-MariaDB - mariadb.org binary distribution, but same problems still occur.

            Hmm, the core should be enabled on Windows by default (MDEV-18439), but something broke this.
            Thanks for noticing.

            Anyway, you can add core-file into mysqld section of the my.ini file, so it looks like below.
            This option does not accept arguments (on some reason)

            [mysqld]
            core-file
            

            wlad Vladislav Vaintroub added a comment - Hmm, the core should be enabled on Windows by default ( MDEV-18439 ), but something broke this. Thanks for noticing. Anyway, you can add core-file into mysqld section of the my.ini file, so it looks like below. This option does not accept arguments (on some reason) [mysqld] core-file

            wlad, thank you. Because this may be a race condition, I would need the stack traces of all threads. And even then, another thread that might have broken things in the crashing thread’s point of view might already be executing something completely different. Hopefully the .dmp file will contain the values of some variables and function parameters.

            marko Marko Mäkelä added a comment - wlad , thank you. Because this may be a race condition, I would need the stack traces of all threads. And even then, another thread that might have broken things in the crashing thread’s point of view might already be executing something completely different. Hopefully the .dmp file will contain the values of some variables and function parameters.
            ruut Ruut added a comment -

            I attached the dump and also the relevant part from the .err file where the duped crashed happend. The service is now crashing several times per hour instead of several times a day. So the problem is getting worse.

            ruut Ruut added a comment - I attached the dump and also the relevant part from the .err file where the duped crashed happend. The service is now crashing several times per hour instead of several times a day. So the problem is getting worse.

            marko, I attached 2 text files , the VS and Windbg style. windbg has a little more info, exception context and some stack variables, on the crashing thread. Since it is a minidump, apart from what's on stack, there is not much, so windbg output probably contains maximum information you can get (note however, the stacks are unique, tell me, if you need to have all of them listed)

            wlad Vladislav Vaintroub added a comment - marko , I attached 2 text files , the VS and Windbg style. windbg has a little more info, exception context and some stack variables, on the crashing thread. Since it is a minidump, apart from what's on stack, there is not much, so windbg output probably contains maximum information you can get (note however, the stacks are unique, tell me, if you need to have all of them listed)

            As far as I can tell, at the moment of crash, only one thread is active, and others are waiting on condition variable in lock_wait().

            wlad Vladislav Vaintroub added a comment - As far as I can tell, at the moment of crash, only one thread is active, and others are waiting on condition variable in lock_wait().

            wlad, thank you, the file all_threads_stack.txt is a good start. But, is it possible to see the contents of lock.trx_locks for the transaction? I have understood that unlike in core dumps of Unix-like systems, .dmp files might not contain such information. Is there some way for ruut to attach a debugger to the server, and to extract more information at the moment of a crash? If the service is crashing several times per hour, such an approach should be feasible.

            marko Marko Mäkelä added a comment - wlad , thank you, the file all_threads_stack.txt is a good start. But, is it possible to see the contents of lock.trx_locks for the transaction? I have understood that unlike in core dumps of Unix-like systems, .dmp files might not contain such information. Is there some way for ruut to attach a debugger to the server, and to extract more information at the moment of a crash? If the service is crashing several times per hour, such an approach should be feasible.
            wlad Vladislav Vaintroub added a comment - - edited

            marko, You do not see memory on heap, because this kinds of minidump we create exclude heap.
            Only stacks, and exception information is available.
            In theory, everything is possible, there are multiple formats of minidumps, and the MinidumpWriteDump has all kinds of flags, and inclusion/exclusion callbacks, which we do not use, yet. Our minidump is uncustomizable "mini", not midi or maxi.

            And of course, one can attach a debugger to a running process and debugger will break when process is about to crash, and then one can take a minidump, or full dump, or perhaps with some filtered memory, in case of windbg (https://docs.microsoft.com/en-us/windows-hardware/drivers/debugger/-dump--create-dump-file- , I think the ".dump /mi" command could be particularly useful, in this case , because it "adds secondary memory to the minidump. Secondary memory is any memory referenced by a pointer on the stack or backing store, plus a small region surrounding this address."

            However, I believe the most convenient thing, for the user could be, if you print those locks with fprintfs in Innodb, prior to crash, and provide affected user with a better instrumented executable.

            wlad Vladislav Vaintroub added a comment - - edited marko , You do not see memory on heap, because this kinds of minidump we create exclude heap. Only stacks, and exception information is available. In theory, everything is possible, there are multiple formats of minidumps, and the MinidumpWriteDump has all kinds of flags, and inclusion/exclusion callbacks, which we do not use, yet. Our minidump is uncustomizable "mini", not midi or maxi. And of course, one can attach a debugger to a running process and debugger will break when process is about to crash, and then one can take a minidump, or full dump, or perhaps with some filtered memory, in case of windbg ( https://docs.microsoft.com/en-us/windows-hardware/drivers/debugger/-dump--create-dump-file- , I think the ".dump /mi" command could be particularly useful, in this case , because it "adds secondary memory to the minidump. Secondary memory is any memory referenced by a pointer on the stack or backing store, plus a small region surrounding this address." However, I believe the most convenient thing, for the user could be, if you print those locks with fprintfs in Innodb, prior to crash, and provide affected user with a better instrumented executable.
            ruut Ruut added a comment -

            sorry guys, I really appreciate your help, I need this database to be operational again Monday morning 8.00 central European time, when the office opens up. So my plan is to reinstall mariadb 10.6.5, restore the database backups, which I expect to be all fine. Maybe the problems were caused by 10.6.1 beta which was installed on a production server for almost half a year (my fault, I did not notice it was a beta version) and I only upgraded to 10.6.5 yesterday. Could it be that 10.6.1 contains some bugs which resulted in database corruptions which are not detected by mysqlcheck, but still caused the database to crash even after upgrading to 10.6.5?

            ruut Ruut added a comment - sorry guys, I really appreciate your help, I need this database to be operational again Monday morning 8.00 central European time, when the office opens up. So my plan is to reinstall mariadb 10.6.5, restore the database backups, which I expect to be all fine. Maybe the problems were caused by 10.6.1 beta which was installed on a production server for almost half a year (my fault, I did not notice it was a beta version) and I only upgraded to 10.6.5 yesterday. Could it be that 10.6.1 contains some bugs which resulted in database corruptions which are not detected by mysqlcheck , but still caused the database to crash even after upgrading to 10.6.5?

            There is no data corruption in the database, the crash is presumably is some concurrency bug, which results in this assertion. Or the assertion itself is a bug, but marko would know better.

            wlad Vladislav Vaintroub added a comment - There is no data corruption in the database, the crash is presumably is some concurrency bug, which results in this assertion. Or the assertion itself is a bug, but marko would know better.
            ruut Ruut added a comment -

            So when I would install Mariadb 10.5.13 and restore the databases somehow avoid this concurrency bug form happening again?

            ruut Ruut added a comment - So when I would install Mariadb 10.5.13 and restore the databases somehow avoid this concurrency bug form happening again?

            quite possibly, yes.

            wlad Vladislav Vaintroub added a comment - quite possibly, yes.
            ruut Ruut added a comment -

            concerning concurrency:

            We use a single mariadb user for access to 4 databases which will be used by:

            • python script with SQLAlchemy library called from Windows scheduled tasks
            • FastCGI to Host PHP Applications on IIS for 8 different websites with 8 application pools with mysqli driver.

            The sever has 16 CPU cores and 40 GB Physical memory.

            Would you advise to define a separate mariadb user per application pool and per python script. Or does this not matter?

            ruut Ruut added a comment - concerning concurrency: We use a single mariadb user for access to 4 databases which will be used by: python script with SQLAlchemy library called from Windows scheduled tasks FastCGI to Host PHP Applications on IIS for 8 different websites with 8 application pools with mysqli driver. The sever has 16 CPU cores and 40 GB Physical memory. Would you advise to define a separate mariadb user per application pool and per python script. Or does this not matter?

            ruut, one or many mariadb users, this does not matter for concurrency. Different users are used only for access control, and privileges, and that's it.

            wlad Vladislav Vaintroub added a comment - ruut , one or many mariadb users, this does not matter for concurrency. Different users are used only for access control, and privileges, and that's it.

            The lock.trx_locks would be allocated from the heap, via trx_pools, and therefore it would be excluded from those dumps.
            It would be very interesting to know which thread created the offending lock(s). Is it the crashing thread itself, or were the lock(s) created by an implicit-to-explicit record lock conversion by another thread?

            ruut, are those 16 CPU cores in a single CPU package?

            We conduct most of our internal stress tests on GNU/Linux using debug-instrumented executables. The repeatability of race condition bugs sometimes become reproducible with subtle changes of timing. Compared to the Linux kernel, the scheduler in Microsoft Windows may have different timing patterns.

            marko Marko Mäkelä added a comment - The lock.trx_locks would be allocated from the heap, via trx_pools , and therefore it would be excluded from those dumps. It would be very interesting to know which thread created the offending lock(s). Is it the crashing thread itself, or were the lock(s) created by an implicit-to-explicit record lock conversion by another thread? ruut , are those 16 CPU cores in a single CPU package? We conduct most of our internal stress tests on GNU/Linux using debug-instrumented executables. The repeatability of race condition bugs sometimes become reproducible with subtle changes of timing. Compared to the Linux kernel, the scheduler in Microsoft Windows may have different timing patterns.
            ruut Ruut added a comment - - edited

            I downgraded to 10.5.13. Same assertion error occurs as before, so unfortunately this did not solve the problem. I attached the my.ini file, which might help you find the root cause of the problem. my.ini

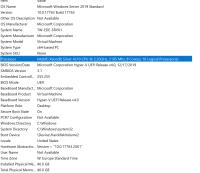
            @marko, this server has 8 cores and 16 logical processiors, see attached screenshot.

            ruut Ruut added a comment - - edited I downgraded to 10.5.13. Same assertion error occurs as before, so unfortunately this did not solve the problem. I attached the my.ini file, which might help you find the root cause of the problem. my.ini @marko, this server has 8 cores and 16 logical processiors, see attached screenshot.

            wlad noticed the non-default setting innodb_rollback_on_timeout=ON in your configuration. It is possible be that our test coverage of that setting is insufficient. ruut, would the crashes go away if you removed that?

            marko Marko Mäkelä added a comment - wlad noticed the non-default setting innodb_rollback_on_timeout=ON in your configuration. It is possible be that our test coverage of that setting is insufficient. ruut , would the crashes go away if you removed that?

            We can repeat various assertion failures when enabling innodb_rollback_on_timeout=ON in a debug build.

            marko Marko Mäkelä added a comment - We can repeat various assertion failures when enabling innodb_rollback_on_timeout=ON in a debug build.
            ruut Ruut added a comment - - edited

            @Marko Mäkelä, I removed the innodb_rollback_on_timeout settings and crashes now only happens once per week. Attached the error which now occurs once per week. To me it looks the same as the error which we received before, but maybe you see subtle differences 2021.11.22-tail-error-log.txt

            ruut Ruut added a comment - - edited @Marko Mäkelä, I removed the innodb_rollback_on_timeout settings and crashes now only happens once per week. Attached the error which now occurs once per week. To me it looks the same as the error which we received before, but maybe you see subtle differences 2021.11.22-tail-error-log.txt

            I think that for analyzing this bug, I will need an https://rr-project.org trace from mleich. Stack traces from a crash are not going to tell us how we got to that situation.

            marko Marko Mäkelä added a comment - I think that for analyzing this bug, I will need an https://rr-project.org trace from mleich . Stack traces from a crash are not going to tell us how we got to that situation.
            ruut Ruut added a comment -

            I enabled deadlock logging and found out that around 1000 deadlocks per day occurred. Fixing the deadlock issues also solved this problem. Mariadb service has not crashed in the last 30 days. Maybe next time assertion error occurres, ask reporter to enable deadlock logging

            ruut Ruut added a comment - I enabled deadlock logging and found out that around 1000 deadlocks per day occurred. Fixing the deadlock issues also solved this problem. Mariadb service has not crashed in the last 30 days. Maybe next time assertion error occurres, ask reporter to enable deadlock logging

            mleich, on 2022-06-23 you had set the label rr-profile but forgot to specify the location of the trace. I searched for it, but didn’t find a mention of it in any chat logs either.

            marko Marko Mäkelä added a comment - mleich , on 2022-06-23 you had set the label rr-profile but forgot to specify the location of the trace. I searched for it, but didn’t find a mention of it in any chat logs either.

            Sorry, setting "rr-profile" and forgetting the location was a mistake.
            The cases which I found were crashes during shutdown like

            1. 2022-07-26T09:15:22 [256926] | [rr 260977 1461454]2022-07-26 9:14:32 0 [Note] InnoDB: Starting shutdown...
            2. 2022-07-26T09:15:22 [256926] | [rr 260977 1461529]2022-07-26 9:14:32 0 [Note] InnoDB: Dumping buffer pool(s) to /dev/shm/rqg/1658847117/108/1/data/ib_buffer_pool
            3. 2022-07-26T09:15:22 [256926] | [rr 260977 1461564]2022-07-26 9:14:32 0 [Note] InnoDB: Instance 0, restricted to 94 pages due to innodb_buf_pool_dump_pct=25
            4. 2022-07-26T09:15:22 [256926] | [rr 260977 1461572]2022-07-26 9:14:32 0 [Note] InnoDB: Buffer pool(s) dump completed at 220726 9:14:32
            5. 2022-07-26T09:15:22 [256926] | [rr 260977 1461683]2022-07-26 09:14:33 0x7f21f6013700[rr 260977 1461686] InnoDB: Assertion failure in file /data/Server/10.4/storage/innobase/buf/buf0flu.cc line 3321
            6. 2022-07-26T09:15:22 [256926] | [rr 260977 1461688]InnoDB: Failing assertion: UT_LIST_GET_LEN(buf_pool->flush_list) == 0

            origin/10.4 9a897335eb4387980aed7698b832a893dbaa3d81 2022-07-26T16:45:10+03:00
            sdp:/data/results/1658847117/TBR-1163-MDEV-27031_1/dev/shm/rqg/1658847117/108/1/rr
            But some "rr replay" does not replay the assert observed from whatever reason.

            mleich Matthias Leich added a comment - Sorry, setting "rr-profile" and forgetting the location was a mistake. The cases which I found were crashes during shutdown like 2022-07-26T09:15:22 [256926] | [rr 260977 1461454] 2022-07-26 9:14:32 0 [Note] InnoDB: Starting shutdown... 2022-07-26T09:15:22 [256926] | [rr 260977 1461529] 2022-07-26 9:14:32 0 [Note] InnoDB: Dumping buffer pool(s) to /dev/shm/rqg/1658847117/108/1/data/ib_buffer_pool 2022-07-26T09:15:22 [256926] | [rr 260977 1461564] 2022-07-26 9:14:32 0 [Note] InnoDB: Instance 0, restricted to 94 pages due to innodb_buf_pool_dump_pct=25 2022-07-26T09:15:22 [256926] | [rr 260977 1461572] 2022-07-26 9:14:32 0 [Note] InnoDB: Buffer pool(s) dump completed at 220726 9:14:32 2022-07-26T09:15:22 [256926] | [rr 260977 1461683] 2022-07-26 09:14:33 0x7f21f6013700 [rr 260977 1461686] InnoDB: Assertion failure in file /data/Server/10.4/storage/innobase/buf/buf0flu.cc line 3321 2022-07-26T09:15:22 [256926] | [rr 260977 1461688] InnoDB: Failing assertion: UT_LIST_GET_LEN(buf_pool->flush_list) == 0 origin/10.4 9a897335eb4387980aed7698b832a893dbaa3d81 2022-07-26T16:45:10+03:00 sdp:/data/results/1658847117/TBR-1163- MDEV-27031 _1/dev/shm/rqg/1658847117/108/1/rr But some "rr replay" does not replay the assert observed from whatever reason.

            mleich, that assertion expression is different from the bug description. There are many data structures that use the InnoDB home-brew doubly linked list.

            That said, in MDEV-29440 you posted an rr replay trace that might explain this bug.

            marko Marko Mäkelä added a comment - mleich , that assertion expression is different from the bug description. There are many data structures that use the InnoDB home-brew doubly linked list. That said, in MDEV-29440 you posted an rr replay trace that might explain this bug.

            Copying and adapting from MDEV-29440:

            ssh pluto
            rr replay /data/results/1662464247/TBR-1442-TBR-1443/1/rr/latest-trace
            

            That trace involves innodb_rollback_on_timeout=ON.

            marko Marko Mäkelä added a comment - Copying and adapting from MDEV-29440 : ssh pluto rr replay /data/results/1662464247/TBR-1442-TBR-1443/1/rr/latest-trace That trace involves innodb_rollback_on_timeout=ON .

            In MDEV-29576 there is an rr replay trace where a being-rolled-back transaction will be flagged as a deadlock victim. Like the original report of this, it involves innodb_rollback_on_timeout=ON.

            marko Marko Mäkelä added a comment - In MDEV-29576 there is an rr replay trace where a being-rolled-back transaction will be flagged as a deadlock victim. Like the original report of this, it involves innodb_rollback_on_timeout=ON .
            vlad.lesin Vladislav Lesin added a comment - - edited

            The scenario is the following:
            1. trx1 is resumed in lock_wait() by timeout, enters in lock_sys_t::cancel(lock=L1), but it has not yet acquired lock_sys.latch,
            2. trx2 executes lock_move_reorganize_page() during purging. It acquires lock_sys.latch, moves L1 to L2, resetting waiting flag for L1, sets trx1->lock.wait_lock=L2 and releases lock_sys.latch.
            3. trx1 acquires lock_sys.latch, and checks lock->is_waiting(). "lock" is equal to L1, as this is argument of lock_sys_t::cancel(lock=L1) . As L1's waiting flag was reset by trx2, trx1 does not invoke lock_cancel_waiting_and_release(), and trx->lock.wait_thr stays unreset, what causes assertion failure on trx1 rollback.

            This is one more variant of MDEV-27701, which is already fixed.

            vlad.lesin Vladislav Lesin added a comment - - edited The scenario is the following: 1. trx1 is resumed in lock_wait() by timeout, enters in lock_sys_t::cancel(lock=L1), but it has not yet acquired lock_sys.latch, 2. trx2 executes lock_move_reorganize_page() during purging. It acquires lock_sys.latch, moves L1 to L2, resetting waiting flag for L1, sets trx1->lock.wait_lock=L2 and releases lock_sys.latch. 3. trx1 acquires lock_sys.latch, and checks lock->is_waiting(). "lock" is equal to L1, as this is argument of lock_sys_t::cancel(lock=L1) . As L1's waiting flag was reset by trx2, trx1 does not invoke lock_cancel_waiting_and_release(), and trx->lock.wait_thr stays unreset, what causes assertion failure on trx1 rollback. This is one more variant of MDEV-27701 , which is already fixed.

            People

              vlad.lesin Vladislav Lesin
              ruut Ruut
              Votes:
              0 Vote for this issue
              Watchers:
              6 Start watching this issue

              Dates

                Created:
                Updated:
                Resolved:

                Git Integration

                  Error rendering 'com.xiplink.jira.git.jira_git_plugin:git-issue-webpanel'. Please contact your Jira administrators.