Details
-
Bug
-
Status: Closed (View Workflow)
-
 Major
Major
-
Resolution: Fixed
-
10.5.7, 10.5.8, 10.5.9, 10.6
-
None
Description
- Existing logic doesn't have idle flushing enabled. It got removed as part of the
MDEV-23855revamp.
- Given the new/update flow of the page-cleaner idle flushing logic will be enabled if
- page cleaner is idle
- there are dirty pages (<srv_max_dirty_pages_pct_lwm)
- server is not performing any activity.
Attachments

Issue Links
- relates to
-
MDEV-25113 Reduce effect of parallel background flush on select workload
-
- Closed
-
-
-
- Closed
-
-
-
- Closed
-
-
-

- Closed
-
-
-
- Closed
-
-
-

- Closed
-
Activity
| Field | Original Value | New Value |
|---|---|---|
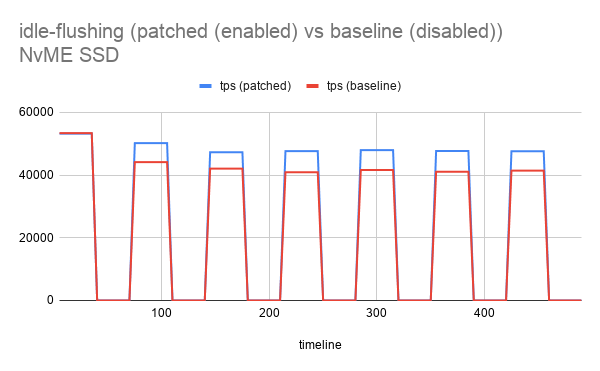
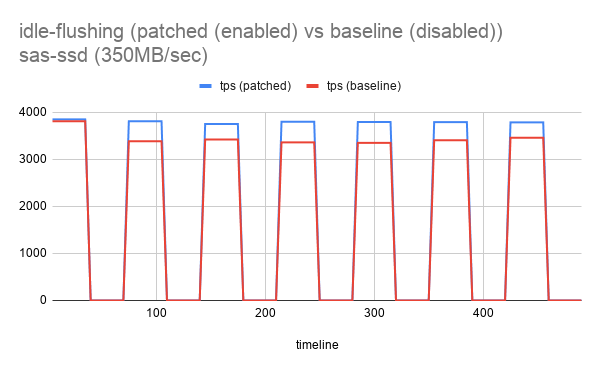
| Attachment | idle-flushing (patched (enabled) vs baseline (disabled))_sas-ssd (350MB_sec).png [ 56401 ] | |
| Attachment | idle-flushing (patched (enabled) vs baseline (disabled))_NvME SSD.png [ 56402 ] |
 vs baseline (disabled))_sas-ssd (350MB_sec).png)
 vs baseline (disabled))_NvME SSD.png)
I also tested the performance of the patch to check if enabling idle flushing helps. As we can see from the graph above it is clearly seen that idle flushing makes helps improve the performance for next burst cycle. (Testing was done with both NVME and SAS type SSD).
More detailed testing to rule out other effect will be done once the basic idea of the patch is accepted.
| Attachment | mdb.nvme.cnf [ 56403 ] |
| Attachment | mdb.sasssd.cnf [ 56404 ] |
I confirm that the idle flushing (when innodb_max_dirty_pages_pct_lwm>0; see also MDEV-24537) was intentionally removed in MDEV-23855. I was under the impression that the two parameters should provide enough flexibility:
- innodb_max_dirty_pages_pct is a ‘hard’ limit: If the ratio of dirty persistent pages to all pages in the buffer pool exceeds this, the page cleaner will attempt to write out innodb_io_capacity pages per second.
- innodb_max_dirty_pages_pct_lwm is a ‘soft’ limit for ‘adaptive flushing’: If it is nonzero (a regression due to
MDEV-24537was present in 10.5.7 and 10.5.8), and the dirty page ratio exceeds this limit, then pages may be written out.
Before MDEV-23855, we did check whether srv_sys.activity_count had been changed, that is, whether srv_inc_activity_count() had been called. During normal operation, that code is currently being called on write transaction commit unless innodb_flush_log_at_trx_commit=0. Even if the counter were not changing, the server could have shifted to a I/O bound read-only workload, possibly triggering eviction flushing in order to replace previous dirty pages in the buffer pool.
Whether it might be useful to have the ‘background flushing’ run under this kind of circumstances (alternating read-only and read-write workload), I truly do not know. If such a read-only burst is short, and if the previously dirtied pages will be soon modified again, it could be useful to keep those dirty pages in the buffer pool, to reduce ‘write amplification’. Before a known read-only burst (such as generating a report), it might be useful to modify the two above mentioned parameters.
krunalbauskar, can you also share the workload script? I am guessing that the script is alternating between write-heavy and no workload. Could you also try to create another script that would alternate between write-heavy and read-heavy workload?
| Link |
This issue relates to |
| Link |
This issue relates to |
| Affects Version/s | 10.5.9 [ 25109 ] | |
| Affects Version/s | 10.5.8 [ 25023 ] |
| Attachment | run.sh [ 56410 ] |
| Attachment | Screenshot from 2021-02-23 19-15-04.png [ 56422 ] |
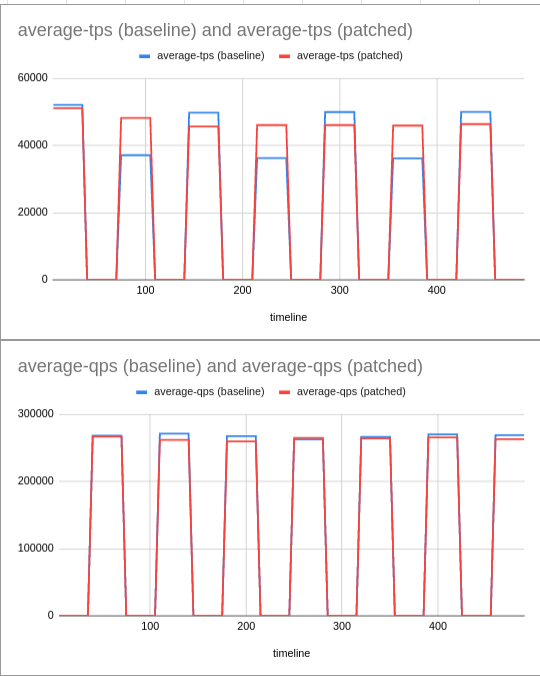
Marko,
I tested the read-only workload instead of sleep. Graph attached. RO workload has not shown any difference in both cases (expected as data is in memory).
- In patched case, rw-workload post RO continues to remain stable (hovering around 47K in the said use-case thanks to idle-flushing that take place).
- In baseline case, rw-worload post RO continue to show lot of jitters with tps touching 49K and next ro turn dropping to 36K.
- Up-down pattern could be seen in the said graph clearly. During 36K pressure get developed from redo-log perspective that increases flushing rate so drop in tps.
So all in all idle-flushing helps maintain stable tps with improved performance with no or negligible effect on ro-workload.
| Assignee | Marko Mäkelä [ marko ] |
| Fix Version/s | 10.5 [ 23123 ] | |
| Fix Version/s | 10.6 [ 24028 ] |
| Status | Open [ 1 ] | In Progress [ 3 ] |
| Attachment | oltp.png [ 56568 ] |
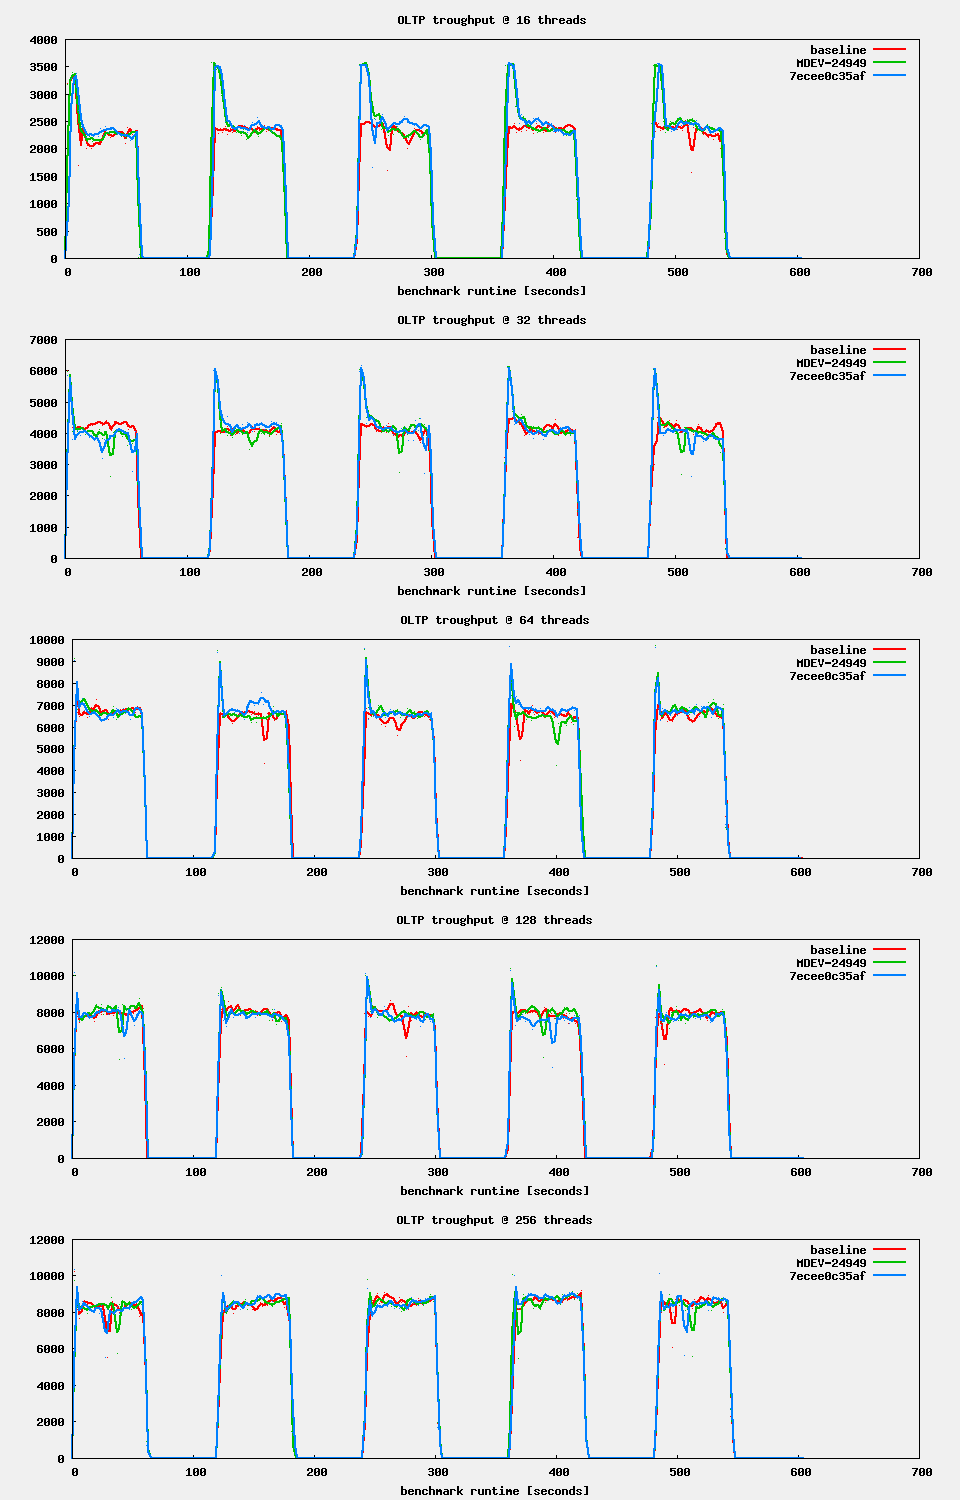
oltp.png![]() shows my results for 10.5.9, the original PR and version from marko for 5x 1min read-write followed by 1min sleep.
shows my results for 10.5.9, the original PR and version from marko for 5x 1min read-write followed by 1min sleep.
my.cnf (stripped to the essentials)
innodb_buffer_pool_size = 8G
|
innodb_log_file_size = 16G
|
innodb_log_buffer_size = 32M
|
innodb_flush_neighbors = 0
|
innodb_io_capacity = 5000
|
innodb_adaptive_flushing = 1
|
innodb_max_dirty_pages_pct = 90
|
innodb_max_dirty_pages_pct_lwm = 20
|
| Attachment | oltp_ts_16.png [ 56569 ] |
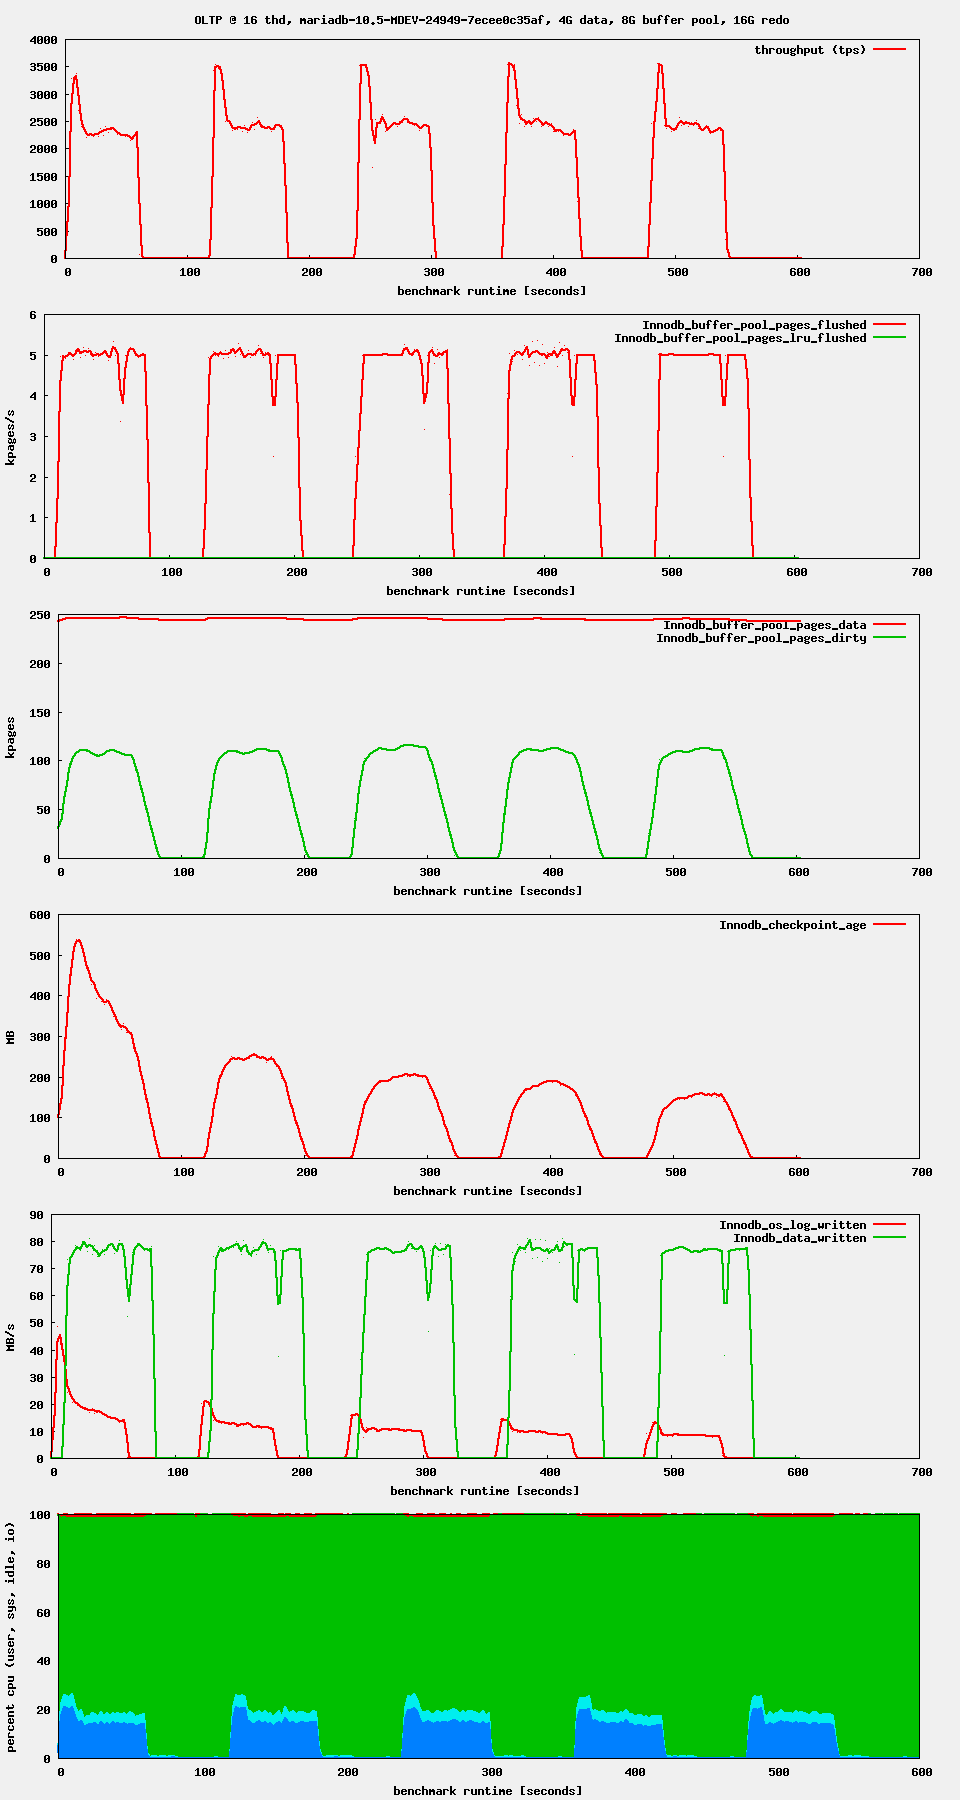
oltp_ts_16.png![]() shows some weird behavior. At the beginning of the 1min work interval it is much faster (3500tps, 20% cpu user). As soon as 100K pages are dirty, by coicidence ( ?) this is innodb_max_dirty_pages_pct_lwm, flushing kicks in with 5K pages/s (corresponding to innodb_io_capacity = 5000). The flushing seems to be slowing down the workers to 2500tps at 13% cpu user.
shows some weird behavior. At the beginning of the 1min work interval it is much faster (3500tps, 20% cpu user). As soon as 100K pages are dirty, by coicidence ( ?) this is innodb_max_dirty_pages_pct_lwm, flushing kicks in with 5K pages/s (corresponding to innodb_io_capacity = 5000). The flushing seems to be slowing down the workers to 2500tps at 13% cpu user.
We seem not to flush "adaptive". It is either on oder off. I would expect the flushing to grow starting at innodb_max_dirty_pages_pct_lwm, reaching the configured innodb_io_capacity at innodb_max_dirty_pages_pct and going to panic mode (furious flushing) above. Its not happening!
Axel,
I see you are using https://github.com/MariaDB/server/commit/7ecee0c35af8085a8730fce9f2f5917c65406bb0. there are multiple issues with the it. one I have already pointed and eventual fix too had issues.
So finally based on discussion with Marko we have decided to revive our original patch that is being tracked under PR#1758. You other graph has tag name MDEV-24949 I presume that is referring to changes from said PR#7158.
You other graph has tag name
MDEV-24949I presume that is referring to changes from said PR#71581758.
That is right. The variant labeled as "MDEV-24949" is PR#1758
I think that the PR#1758 version is better than mine. I developed my version in order to fully understand the logic. In my attempt to ‘make it as simple as possible’ I violated the ‘but not any simpler’ part.
In oltp_ts_16.png![]() we can observe a few things:
we can observe a few things:
- At the start of each write workload period, we will reach peak performance, because the page cleaner is not running yet.
- For most part of each write workload period, the page cleaner will be flushing at full speed. (This should be unrelated to this change, and maybe axel should find a better combination parameters to make the flushing more moderate. Before
MDEV-23399andMDEV-23855, I did not know much of the flushing, and I still did not study adaptive flushing in detail, or understand how it is supposed to work and how the parameters could be tweaked.) - Near the end of the write workload period, there is a drop in the pages flushed (the second graph from the top). I would expect this to coincide with the end of the write workload, but the throughput graph only drops to 0 slightly after this ‘dip’. I suspect that the throughput graph is misaligned. The 2nd and 5th graph look perfectly aligned, and the 5th graph suggests that the workload stopped exactly at the time of the dip.
- After the dip, the idle page flushing will kick in, at full speed. This is not necessarily wrong, especially when the workload is alternating between write-heavy and idle. If we alternated between write-heavy and read-heavy, it could be more meaningful to throttle the flushing speed.
- During the idle-workload periods, we see no purge activity. To work around the incomplete fix of
MDEV-11802, SET GLOBAL innodb_max_purge_lag_wait=0; (MDEV-16952) could be executed at the start of each idle period. - The peaks of the 4th and 5th graphs (checkpoint age and log writes) become gradually lower. The reason might be that initially there will be more page splits, and later more of the writes will be modifying existing data pages.
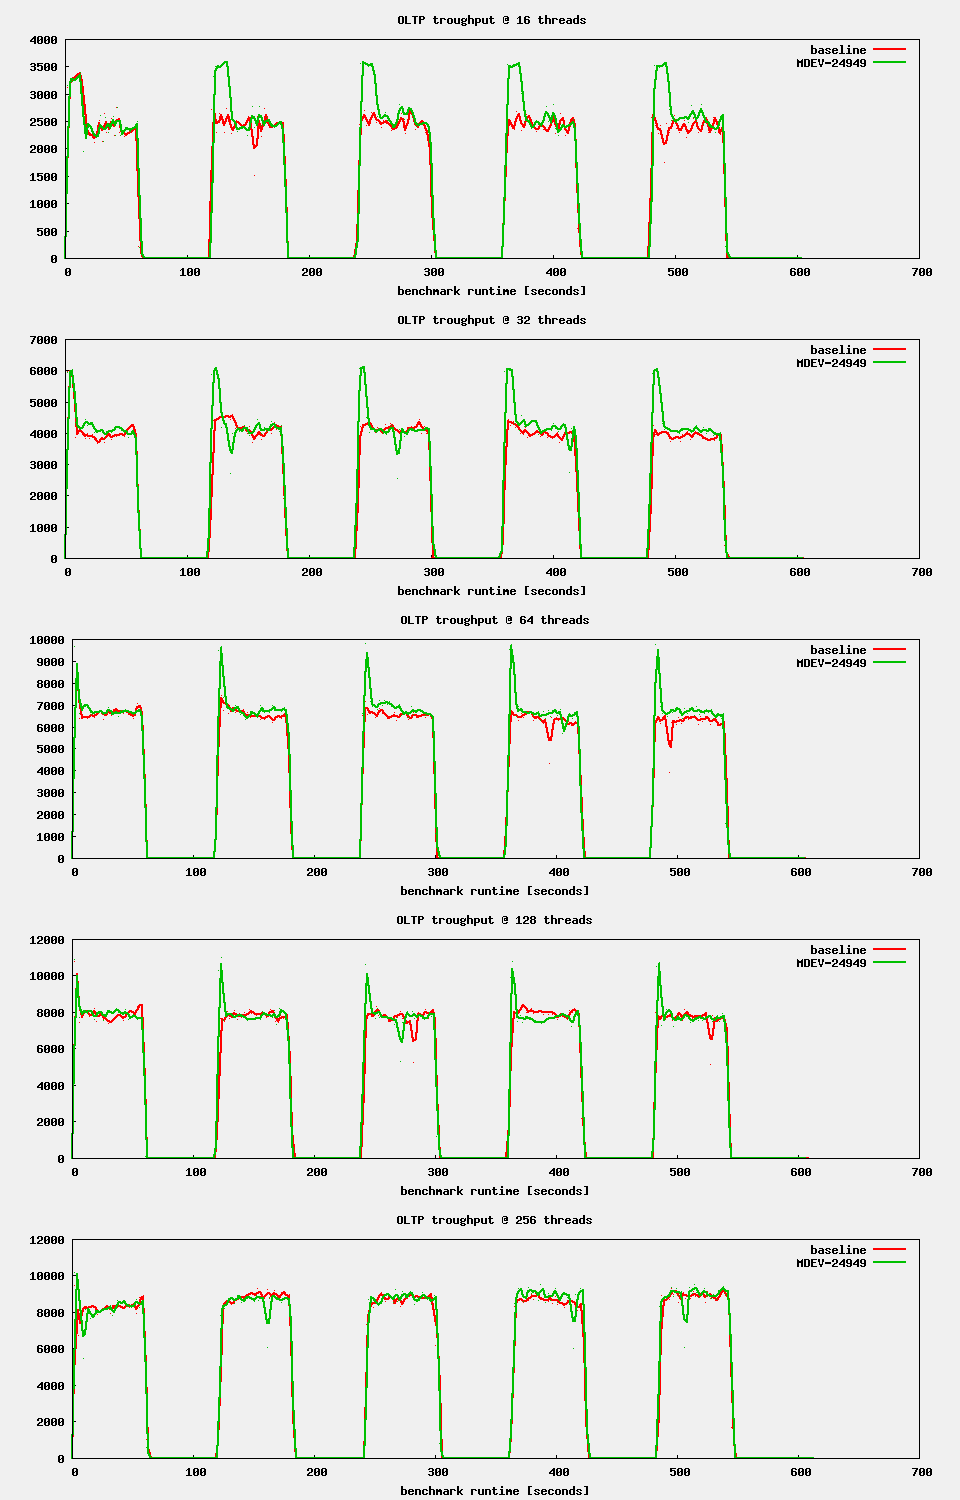
| Attachment | oltpB.png [ 56570 ] |
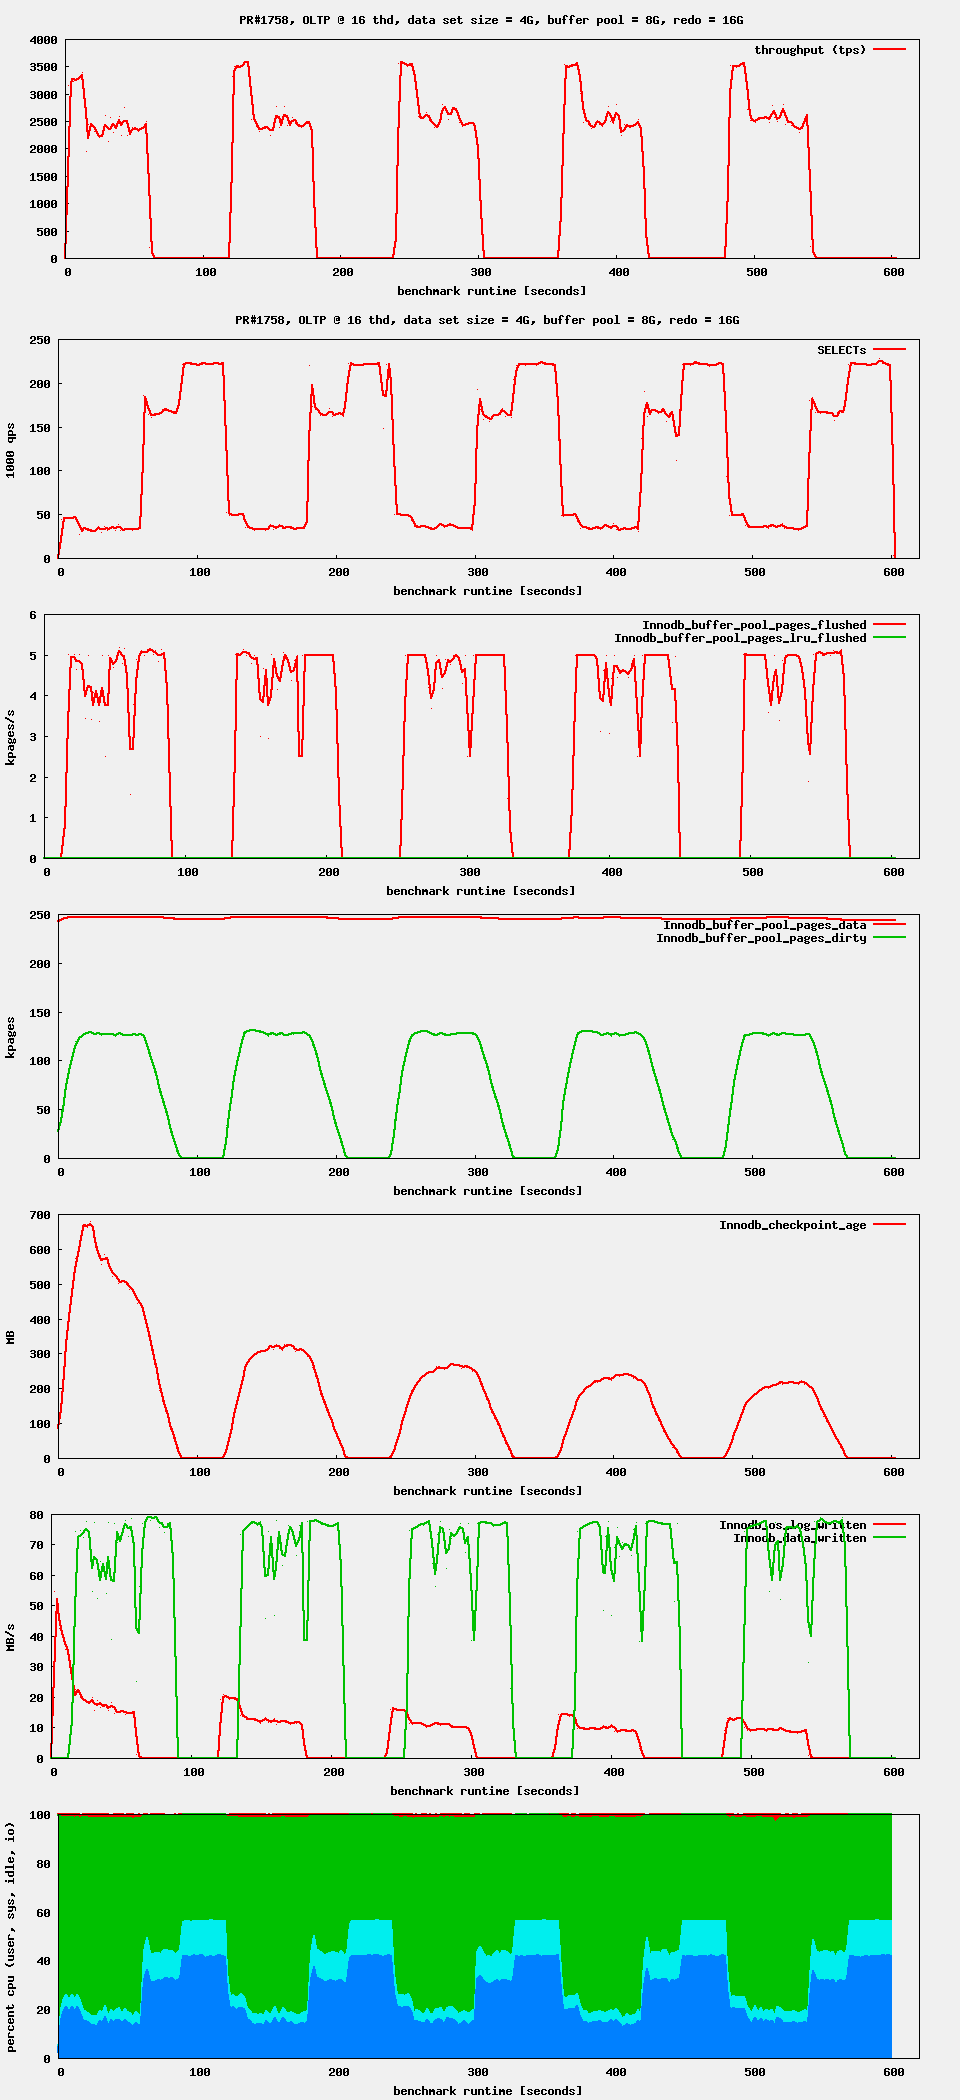
| Attachment | oltp_ts_16B.png [ 56571 ] |
I rerun the test with the following changes:
- workload is now 1 min R/W followed by 1 min RO, repeated 5 times
- innodb_max_dirty_pages_pct_lwm = 25 (was: 20)
oltpB.png![]() shows the overview. Nothing new here.
shows the overview. Nothing new here.
oltp_ts_16B.png![]() shows PR#1758 at 16 threads. A new graph shows the number of SELECTs. One can easily see that:
shows PR#1758 at 16 threads. A new graph shows the number of SELECTs. One can easily see that:
- flushing starts now at 25% dirty pages, so this is no coincidence
- idle flushing interferes with reads, it should be reduced
Axel,
I am just reading you *B graph. Distortion in read-only/select tps will be reduced once we enable idle_flush to consider pending read operation so the idle flushing will not kick in if there are read ops pending.
Another issue I foresee is related to a spike in read-write workload at the start and then a drop. This seems to be originating from the issue that page-cleaner is free and so there is no background flushing going on. Once page-cleaner crosses 10% mark (default) background flushing starts there-by limiting the redo-log activity and in-turn affects the read-write workload.
<this fact should be true irrespective of the said patch>
| Attachment | oltp_ts_16B.png [ 56571 ] |
| Attachment | oltp_ts_16B.png [ 56572 ] |
Another issue I foresee is related to a spike in read-write workload at the start and then a drop. This seems to be originating from the issue that page-cleaner is free and so there is no background flushing going on. Once page-cleaner crosses 10% mark (default) background flushing starts there-by limiting the redo-log activity and in-turn affects the read-write workload.
It is not a 10% mark, but the innodb_max_dirty_pages_pct_lwm = 25 boundary being crossed, that causes the throtteling of R/W throughput by the heavy flushing. I repeat my complaint here:
We seem not to flush "adaptive". It is either on oder off
Axel,
I so much agree with you. For the experiment, I did this.
Used a very large buffer pool (1m pages = 160 GB. Also, set innodb_max_dirty_pages_pct_lwm=70% which means flushing will not happen till we reach that limit unless adaptive flushing kicks in (with 69 GB data the limit is never hit). Adaptive flushing should kick in if there is pressure being build on redo log and is controlled by innodb_adaptive_flushing_lwm (default to 10% that is what I kept too)).
I am running the update-index workload in parallel and as we could see the redo log has crossed the 10% limit and still there is nothing being flushed.
Ideally, on crossing 10% of the redo-log size (20GB * 10% = 2GB) it should start flushing. Max-checkpoint age is correctly set to 85% of the redo-log size (I recall it should be 80-85%).
MariaDB [(none)]> show status like 'Innodb_buffer_pool_pages%'; show status like 'Innodb_checkpoint_%';
-------------------------------------------------+
| Variable_name | Value |
-------------------------------------------------+
| Innodb_buffer_pool_pages_data | 4496537 |
| Innodb_buffer_pool_pages_dirty | 3100258 |
| Innodb_buffer_pool_pages_flushed | 0 |
| Innodb_buffer_pool_pages_free | 5826663 |
| Innodb_checkpoint_age | 4260770018 |
| Innodb_checkpoint_max_age | 17393908102 |
--------------------------------------+
MariaDB [(none)]> show status like 'Innodb_buffer_pool_pages%'; show status like 'Innodb_checkpoint_%';
-------------------------------------------------+
| Variable_name | Value |
-------------------------------------------------+
| Innodb_buffer_pool_pages_data | 4523411 |
| Innodb_buffer_pool_pages_dirty | 4483055 |
| Innodb_buffer_pool_pages_flushed | 0 |
| Innodb_buffer_pool_pages_free | 5799789 |
--------------
| Innodb_checkpoint_age | 15647589898 |
| Innodb_checkpoint_max_age | 17393908102 |
--------------------------------------+
All this with vanilla 10.5 trunk (no patch applied).
So we need to separately investigate this adaptive flushing issue.
[I remember seeing this before too when I complained about it but seems like it was missing the point but now I got could reproduce it correctly].
and of-course the tps drop once we hit the max-dirty age (84K -> 34K)
[ 255s ] thds: 1024 tps: 84861.92 qps: 84862.12 (r/w/o: 0.00/84862.12/0.00) lat (ms,95%): 12.75 err/s: 0.00 reconn/s: 0.00
[ 260s ] thds: 1024 tps: 78755.87 qps: 78755.87 (r/w/o: 0.00/78755.87/0.00) lat (ms,95%): 12.30 err/s: 0.00 reconn/s: 0.00
[ 265s ] thds: 1024 tps: 34419.32 qps: 34419.32 (r/w/o: 0.00/34419.32/0.00) lat (ms,95%): 27.17 err/s: 0.00 reconn/s: 0.00
[ 270s ] thds: 1024 tps: 53913.70 qps: 53913.70 (r/w/o: 0.00/53913.70/0.00) lat (ms,95%): 13.70 err/s: 0.00 reconn/s: 0.00
[ 275s ] thds: 1024 tps: 59043.41 qps: 59043.41 (r/w/o: 0.00/59043.41/0.00) lat (ms,95%): 14.73 err/s: 0.00 reconn/s: 0.00
[ 280s ] thds: 1024 tps: 73390.11 qps: 73390.11 (r/w/o: 0.00/73390.11/0.00) lat (ms,95%): 13.70 err/s: 0.00 reconn/s: 0.00
I think that we indeed need a separate ticket about the adaptive flushing, and we may have to look at older versions than 10.5. It is possible that adaptive flushing was in some way broken in MDEV-23855.
Ok. Will file a separate issue for the adaptive flushing investigation.
| Link |
This issue relates to |
Axel,
I have been investigating this issue that tends to suggest that idle-flushing slows down the select workload.
It seems like any parallel flushing in the background could have the same effect on the select workload.
Let's say we have 1000 pages with innodb_max_dirty_pages_pct_lwm = 25% that means threshold for idle flushing is 250. Now let's assume the read-write workload modifies 700 pages. On completion of read-write workload before the idle flushing kicks in, the existing algorithm will carry out adaptive flushing to flush for the range from 700-250. If we try to track select qps during this time it would be the same as that between 0-250.
Let me share an example:
Block-1: adaptive flushing
Block-2: Idle flushing
Block-3: No flushing
block-1:
[ 1s ] thds: 16 tps: 10801.51 qps: 172968.90 (r/w/o: 151349.91/0.00/21618.99) lat (ms,95%): 1.73 err/s: 0.00 reconn/s: 0.00
[ 2s ] thds: 16 tps: 10665.98 qps: 170672.69 (r/w/o: 149341.73/0.00/21330.96) lat (ms,95%): 1.79 err/s: 0.00 reconn/s: 0.00
[ 3s ] thds: 16 tps: 10361.11 qps: 165755.69 (r/w/o: 145033.48/0.00/20722.21) lat (ms,95%): 2.00 err/s: 0.00 reconn/s: 0.00
[ 4s ] thds: 16 tps: 10395.87 qps: 166338.97 (r/w/o: 145547.23/0.00/20791.75) lat (ms,95%): 1.93 err/s: 0.00 reconn/s: 0.00
[ 5s ] thds: 16 tps: 10357.03 qps: 165701.55 (r/w/o: 144987.49/0.00/20714.07) lat (ms,95%): 1.93 err/s: 0.00 reconn/s: 0.00
[ 6s ] thds: 16 tps: 10384.01 qps: 166172.21 (r/w/o: 145403.18/0.00/20769.03) lat (ms,95%): 1.89 err/s: 0.00 reconn/s: 0.00
[ 7s ] thds: 16 tps: 10386.08 qps: 166167.24 (r/w/o: 145395.09/0.00/20772.16) lat (ms,95%): 1.93 err/s: 0.00 reconn/s: 0.00
[ 8s ] thds: 16 tps: 10386.07 qps: 166160.18 (r/w/o: 145389.03/0.00/20771.15) lat (ms,95%): 1.93 err/s: 0.00 reconn/s: 0.00
[ 9s ] thds: 16 tps: 10381.97 qps: 166159.48 (r/w/o: 145394.54/0.00/20764.93) lat (ms,95%): 1.93 err/s: 0.00 reconn/s: 0.00
[ 10s ] thds: 16 tps: 10305.99 qps: 164843.91 (r/w/o: 144231.92/0.00/20611.99) lat (ms,95%): 1.89 err/s: 0.00 reconn/s: 0.00
[ 11s ] thds: 16 tps: 10345.98 qps: 165590.70 (r/w/o: 144898.74/0.00/20691.96) lat (ms,95%): 1.89 err/s: 0.00 reconn/s: 0.00
[ 12s ] thds: 16 tps: 10377.01 qps: 166040.23 (r/w/o: 145286.20/0.00/20754.03) lat (ms,95%): 1.93 err/s: 0.00 reconn/s: 0.00
[ 13s ] thds: 16 tps: 10396.99 qps: 166285.85 (r/w/o: 145491.87/0.00/20793.98) lat (ms,95%): 1.93 err/s: 0.00 reconn/s: 0.00
[ 14s ] thds: 16 tps: 10383.95 qps: 166176.24 (r/w/o: 145408.34/0.00/20767.91) lat (ms,95%): 1.93 err/s: 0.00 reconn/s: 0.00
[ 15s ] thds: 16 tps: 10343.14 qps: 165495.22 (r/w/o: 144809.94/0.00/20685.28) lat (ms,95%): 1.96 err/s: 0.00 reconn/s: 0.00
==== average tps during adpative flushing: 165K-166K
block-2:
[ 16s ] thds: 16 tps: 10288.87 qps: 164613.94 (r/w/o: 144036.20/0.00/20577.74) lat (ms,95%): 1.93 err/s: 0.00 reconn/s: 0.00
[ 17s ] thds: 16 tps: 10283.08 qps: 164521.28 (r/w/o: 143955.12/0.00/20566.16) lat (ms,95%): 1.89 err/s: 0.00 reconn/s: 0.00
[ 18s ] thds: 16 tps: 10336.92 qps: 165395.71 (r/w/o: 144720.87/0.00/20674.84) lat (ms,95%): 1.93 err/s: 0.00 reconn/s: 0.00
[ 19s ] thds: 16 tps: 10437.94 qps: 167011.10 (r/w/o: 146135.21/0.00/20875.89) lat (ms,95%): 1.93 err/s: 0.00 reconn/s: 0.00
[ 20s ] thds: 16 tps: 10370.09 qps: 165904.50 (r/w/o: 145165.31/0.00/20739.19) lat (ms,95%): 1.93 err/s: 0.00 reconn/s: 0.00
[ 21s ] thds: 16 tps: 10429.01 qps: 166865.11 (r/w/o: 146006.10/0.00/20859.01) lat (ms,95%): 1.89 err/s: 0.00 reconn/s: 0.00
[ 22s ] thds: 16 tps: 10393.06 qps: 166281.96 (r/w/o: 145495.84/0.00/20786.12) lat (ms,95%): 1.93 err/s: 0.00 reconn/s: 0.00
[ 23s ] thds: 16 tps: 10356.96 qps: 165759.33 (r/w/o: 145045.41/0.00/20713.92) lat (ms,95%): 1.96 err/s: 0.00 reconn/s: 0.00
[ 24s ] thds: 16 tps: 10366.98 qps: 165863.68 (r/w/o: 145129.72/0.00/20733.96) lat (ms,95%): 1.96 err/s: 0.00 reconn/s: 0.00
[ 25s ] thds: 16 tps: 10366.00 qps: 165843.99 (r/w/o: 145111.99/0.00/20732.00) lat (ms,95%): 1.93 err/s: 0.00 reconn/s: 0.00
[ 26s ] thds: 16 tps: 10347.85 qps: 165534.55 (r/w/o: 144838.86/0.00/20695.69) lat (ms,95%): 1.93 err/s: 0.00 reconn/s: 0.00
[ 27s ] thds: 16 tps: 10356.13 qps: 165729.08 (r/w/o: 145018.82/0.00/20710.26) lat (ms,95%): 1.93 err/s: 0.00 reconn/s: 0.00
[ 28s ] thds: 16 tps: 10446.03 qps: 167094.52 (r/w/o: 146200.46/0.00/20894.07) lat (ms,95%): 1.93 err/s: 0.00 reconn/s: 0.00
[ 29s ] thds: 16 tps: 10392.93 qps: 166323.91 (r/w/o: 145538.05/0.00/20785.86) lat (ms,95%): 1.89 err/s: 0.00 reconn/s: 0.00
[ 30s ] thds: 16 tps: 10289.15 qps: 164644.36 (r/w/o: 144066.06/0.00/20578.29) lat (ms,95%): 1.89 err/s: 0.00 reconn/s: 0.00
[ 31s ] thds: 16 tps: 10384.98 qps: 166156.68 (r/w/o: 145386.72/0.00/20769.96) lat (ms,95%): 1.89 err/s: 0.00 reconn/s: 0.00
[ 32s ] thds: 16 tps: 10355.93 qps: 165668.84 (r/w/o: 144956.99/0.00/20711.86) lat (ms,95%): 1.93 err/s: 0.00 reconn/s: 0.00
[ 33s ] thds: 16 tps: 10340.00 qps: 165431.99 (r/w/o: 144751.99/0.00/20680.00) lat (ms,95%): 1.93 err/s: 0.00 reconn/s: 0.00
[ 34s ] thds: 16 tps: 10358.99 qps: 165757.88 (r/w/o: 145039.90/0.00/20717.99) lat (ms,95%): 1.93 err/s: 0.00 reconn/s: 0.00
[ 35s ] thds: 16 tps: 10344.93 qps: 165515.92 (r/w/o: 144827.06/0.00/20688.87) lat (ms,95%): 1.93 err/s: 0.00 reconn/s: 0.00
[ 36s ] thds: 16 tps: 10387.07 qps: 166156.14 (r/w/o: 145382.00/0.00/20774.14) lat (ms,95%): 1.89 err/s: 0.00 reconn/s: 0.00
==== average tps during idle flushing: 165K-166K
block-3:
[ 37s ] thds: 16 tps: 10526.01 qps: 168472.21 (r/w/o: 147419.18/0.00/21053.03) lat (ms,95%): 1.89 err/s: 0.00 reconn/s: 0.00
[ 38s ] thds: 16 tps: 10748.06 qps: 171991.89 (r/w/o: 150495.78/0.00/21496.11) lat (ms,95%): 1.79 err/s: 0.00 reconn/s: 0.00
[ 39s ] thds: 16 tps: 10654.91 qps: 170454.53 (r/w/o: 149144.71/0.00/21309.82) lat (ms,95%): 1.76 err/s: 0.00 reconn/s: 0.00
[ 40s ] thds: 16 tps: 10669.93 qps: 170714.83 (r/w/o: 149374.98/0.00/21339.85) lat (ms,95%): 1.76 err/s: 0.00 reconn/s: 0.00
[ 41s ] thds: 16 tps: 10661.98 qps: 170590.61 (r/w/o: 149267.66/0.00/21322.95) lat (ms,95%): 1.76 err/s: 0.00 reconn/s: 0.00
[ 42s ] thds: 16 tps: 10667.20 qps: 170680.16 (r/w/o: 149345.77/0.00/21334.40) lat (ms,95%): 1.76 err/s: 0.00 reconn/s: 0.00
==== average tps during no flushing: 170K
------------------------------------------------------------------------------------------------------------------------
If we keep the idle flushing aside for a minute then the problem could be also re-defined as parallel adaptive flushing during select workload slows down select workload (by 3% in the said case).
This should be looked upon separately. I presume there is mutex contention that we are hitting given pages are being flushed and also being read from the same buffer pool.
| issue.field.resolutiondate | 2021-03-11 06:15:07.0 | 2021-03-11 06:15:07.24 |
| Fix Version/s | 10.5.10 [ 25204 ] | |
| Fix Version/s | 10.6.0 [ 24431 ] | |
| Fix Version/s | 10.5 [ 23123 ] | |
| Fix Version/s | 10.6 [ 24028 ] | |
| Resolution | Fixed [ 1 ] | |
| Status | In Progress [ 3 ] | Closed [ 6 ] |
| Link |
This issue relates to |
| Workflow | MariaDB v3 [ 119403 ] | MariaDB v4 [ 158937 ] |
| Link |
This issue relates to |
| Link |
This issue relates to |
I presume there is mutex contention that we are hitting given pages are being flushed and also being read from the same buffer pool.
There definitely is. While dirty pages are flushed from the buffer pool, read operations are slowed down. My sysbench benchmarks just don't show that, because I
- run read-only tests before any read/write tests
- wait between test runs until all dirty pages are flushed
But this is visible in sysbench tpcc. As soon as log flushing kicks in, there is a surge in througput.
Posting the possible patch: https://github.com/mysqlonarm/server/commit/b5cf788d0f27a1fbebb3ccc489783efeb3c270e1