Details
-
Bug
-
Status: Closed (View Workflow)
-
 Major
Major
-
Resolution: Fixed
-
10.5.4
-
None
Description
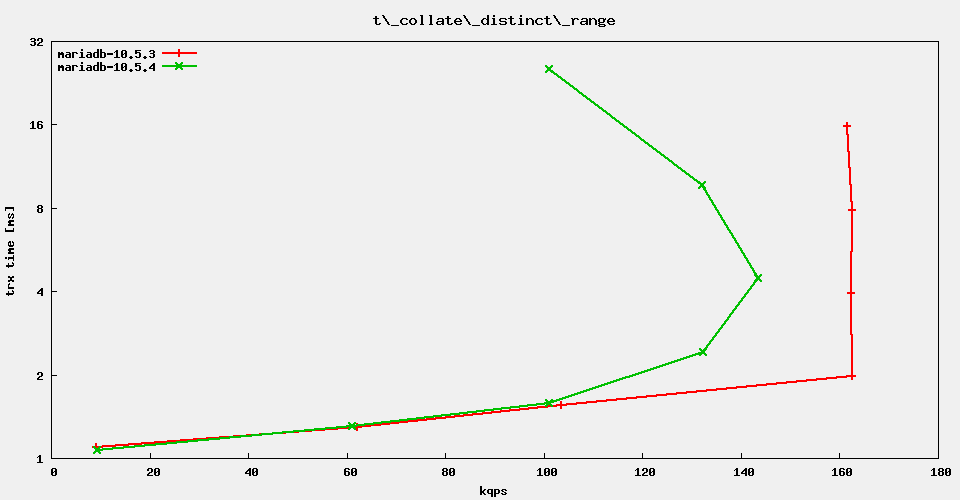
The regression test suite reports rather severe performance regressions in MariaDB 10.5.4 vs. 10.5.3. It looks like it is genuinely for the sysbench OLTP range queries. Example:
Test 't_collate_distinct_range_utf8_general' - sysbench OLTP readonly
|
selecting distinct rows from short range, collation utf8_general_ci
|
1 table, 1 mio rows, engine InnoDB/XtraDB (builtin)
|
numbers are queries per second
|
|
|
#thread count 1 8 16 32 64 128 256
|
mariadb-10.5.3 7840.1 53249 92616 149360 149130 149435 148546
|
mariadb-10.5.4 7794.3 52208 91235 131122 137925 128168 94999
|
Attachments


Issue Links
- is caused by
-
MDEV-15053 Reduce buf_pool_t::mutex contention
-

- Closed
-
- relates to
-
-
- Closed
-
-
-
- Closed
-
Activity
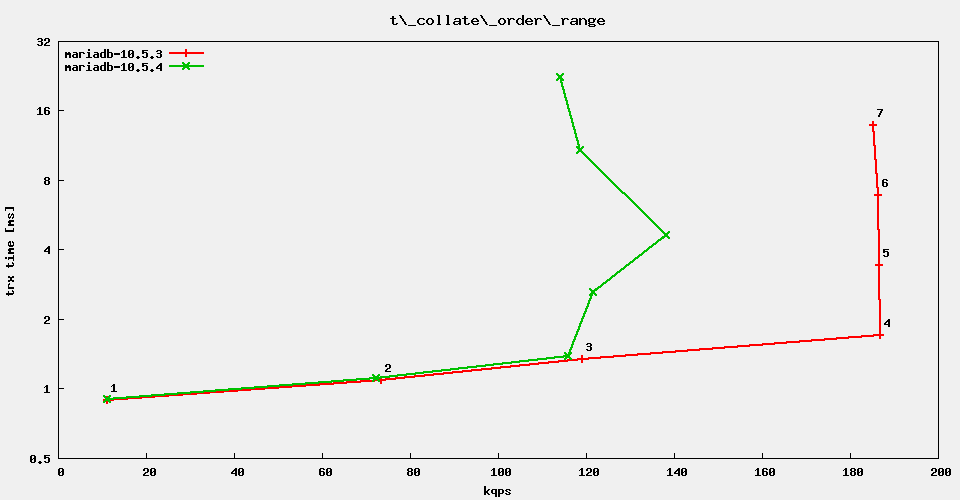
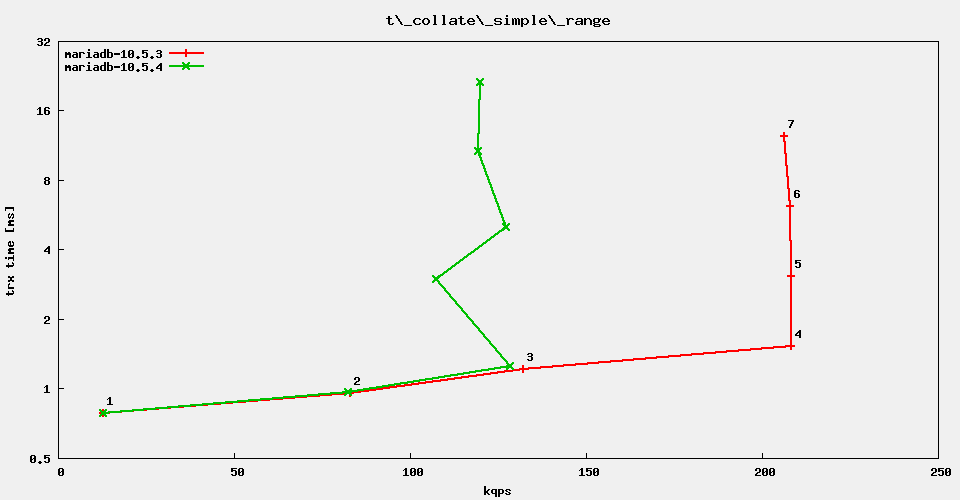
It turns out, that the distinct range query from sysbench is the one that is least affected. The other range queries show much more regression, even the simplistic
SELECT c FROM table WHERE id BETWEEN const AND const
(with c=CHAR(120) and id=INT PRIMARY_KEY)
I'll bisect the commits between 10.5.3 and 10.5.4. Test case: simple range queries @ 32 threads. It turns out that this test does not reproduce the problem.
More tests give more negative feedback:
- this does not seem to be related to anything I configure in my.cnf
- especially it is not connected to table-open-cache or table-open-cache-instances
- it is not connected to running multiple tests with increasing thread counts
Next idea: could it be related to loading the tables fresh vs. using an exisiting datadir?
Bingo! The regression only exists when one loads the database tables and runs the benchmark immediately afterwards (not restarting the server inbetween).
When the server is started fresh, using an existing datadir, then performance is back to normal. See attachment simpe_range4.png![]()
I demote this issue from Critical to Major since it is not very likely for a customer to hit this problem.
It is likely purge activity, that interferes with the workload. once purge is over, it becomes truly "readonly".
MDEV-12288 will make purge reset the DB_TRX_ID after an INSERT. MDEV-515 should remove this ‘purge regression’ in the special case that the data is being inserted into an empty table or partition.
I don't believe in purge being the culprit. In any case I force a complete InnoDB checkpoint after filling the tables and wait for innodb_buffer_pool_pages_dirty becoming less than 100. Also purge would end sooner or later (that benchmark is read-only). But even after 10 or 15 minutes runtime I don't see any change in performance.
Hmm ,what is the culprit then? Apart from purge I can't think of anything else atm. Is there any perf data from a slow run?
I verified that it is not purge. For that reason I started a dummy TRANSACTION WITH CONSISTENT SNAPSHOT even before loading the tables. Then I ran the benchmark and finally killed the client holding the open transaction. This should reliably stop all purge activity during the benchmark.
I traced the regression through the commits between tags mariadb-10.5.3 and mariadb-10.5.4. The first bad commit is b1ab211dee599eabd9a5b886fafa3adea29ae041.
Steps to reproduce. Load sysbench tables:
sysbench --test=oltp.lua --mysql-table-engine=InnoDB --oltp_tables_count=1 \
|
--oltp-table-size=200000 prepare
|
run benchmark:
sysbench --test=oltp.lua --oltp_tables_count=1 --oltp-table-size=200000 \
|
--oltp-read-only=on --oltp_point_selects=0 --oltp_simple_ranges=10 \
|
--oltp_sum_ranges=0 --oltp_order_ranges=0 --oltp_distinct_ranges=0 \
|
--oltp_range_size=10 --num-threads=32 --max-requests=0 --max-time=30 \
|
--report-interval=2 run
|
No special my.cnf needed. A good commit gives ~20000 tps, a bad one ~3500 tps.
If the server is stopped and restarted with the existing datadir, a bad commit gives the same performance as a good one too.
Based on some perf record traces, the problem is in the following:
const bool first_access = fix_block->page.set_accessed(); |
The condition is actually negated! And I do not think that buf_page_optimistic_get() ever needs to initiate read-ahead. axel, can you please test the following patch:
diff --git a/storage/innobase/buf/buf0buf.cc b/storage/innobase/buf/buf0buf.cc
|
index 620c224d4b6..4aaf374da95 100644
|
--- a/storage/innobase/buf/buf0buf.cc
|
+++ b/storage/innobase/buf/buf0buf.cc
|
@@ -3516,7 +3516,7 @@ buf_page_get_low(
|
|| mode == BUF_PEEK_IF_IN_POOL
|
|| fix_block->page.status != buf_page_t::FREED);
|
|
- const bool first_access = fix_block->page.set_accessed();
|
+ const bool not_first_access = fix_block->page.set_accessed();
|
|
if (mode != BUF_PEEK_IF_IN_POOL) {
|
buf_page_make_young_if_needed(&fix_block->page);
|
@@ -3571,7 +3571,7 @@ buf_page_get_low(
|
file, line);
|
}
|
|
- if (mode != BUF_PEEK_IF_IN_POOL && first_access) {
|
+ if (!not_first_access && mode != BUF_PEEK_IF_IN_POOL) {
|
/* In the case of a first access, try to apply linear
|
read-ahead */
|
|
@@ -3678,7 +3678,7 @@ buf_page_optimistic_get(
|
buf_block_buf_fix_inc(block, file, line);
|
hash_lock->read_unlock();
|
|
- const bool first_access = block->page.set_accessed();
|
+ block->page.set_accessed();
|
|
buf_page_make_young_if_needed(&block->page);
|
|
@@ -3723,13 +3723,6 @@ buf_page_optimistic_get(
|
ut_ad(block->page.buf_fix_count());
|
ut_ad(block->page.state() == BUF_BLOCK_FILE_PAGE);
|
|
- if (first_access) {
|
- /* In the case of a first access, try to apply linear
|
- read-ahead */
|
- buf_read_ahead_linear(block->page.id(), block->zip_size(),
|
- ibuf_inside(mtr));
|
- }
|
-
|
buf_pool.stat.n_page_gets++;
|
|
return(TRUE); |
That looks good. I have rerun all the tests from the regression test suite that showed a regression and now all numbers are back to normal. See attachment MDEV-23017.pdf![]()
The regression does not exist with multiple (8) tables.