Details
-
Bug
-
Status: Closed (View Workflow)
-
 Critical
-
Resolution: Fixed
-
6.3.1
-
None
-
SkySQL AWS 32x 128 single node
Description
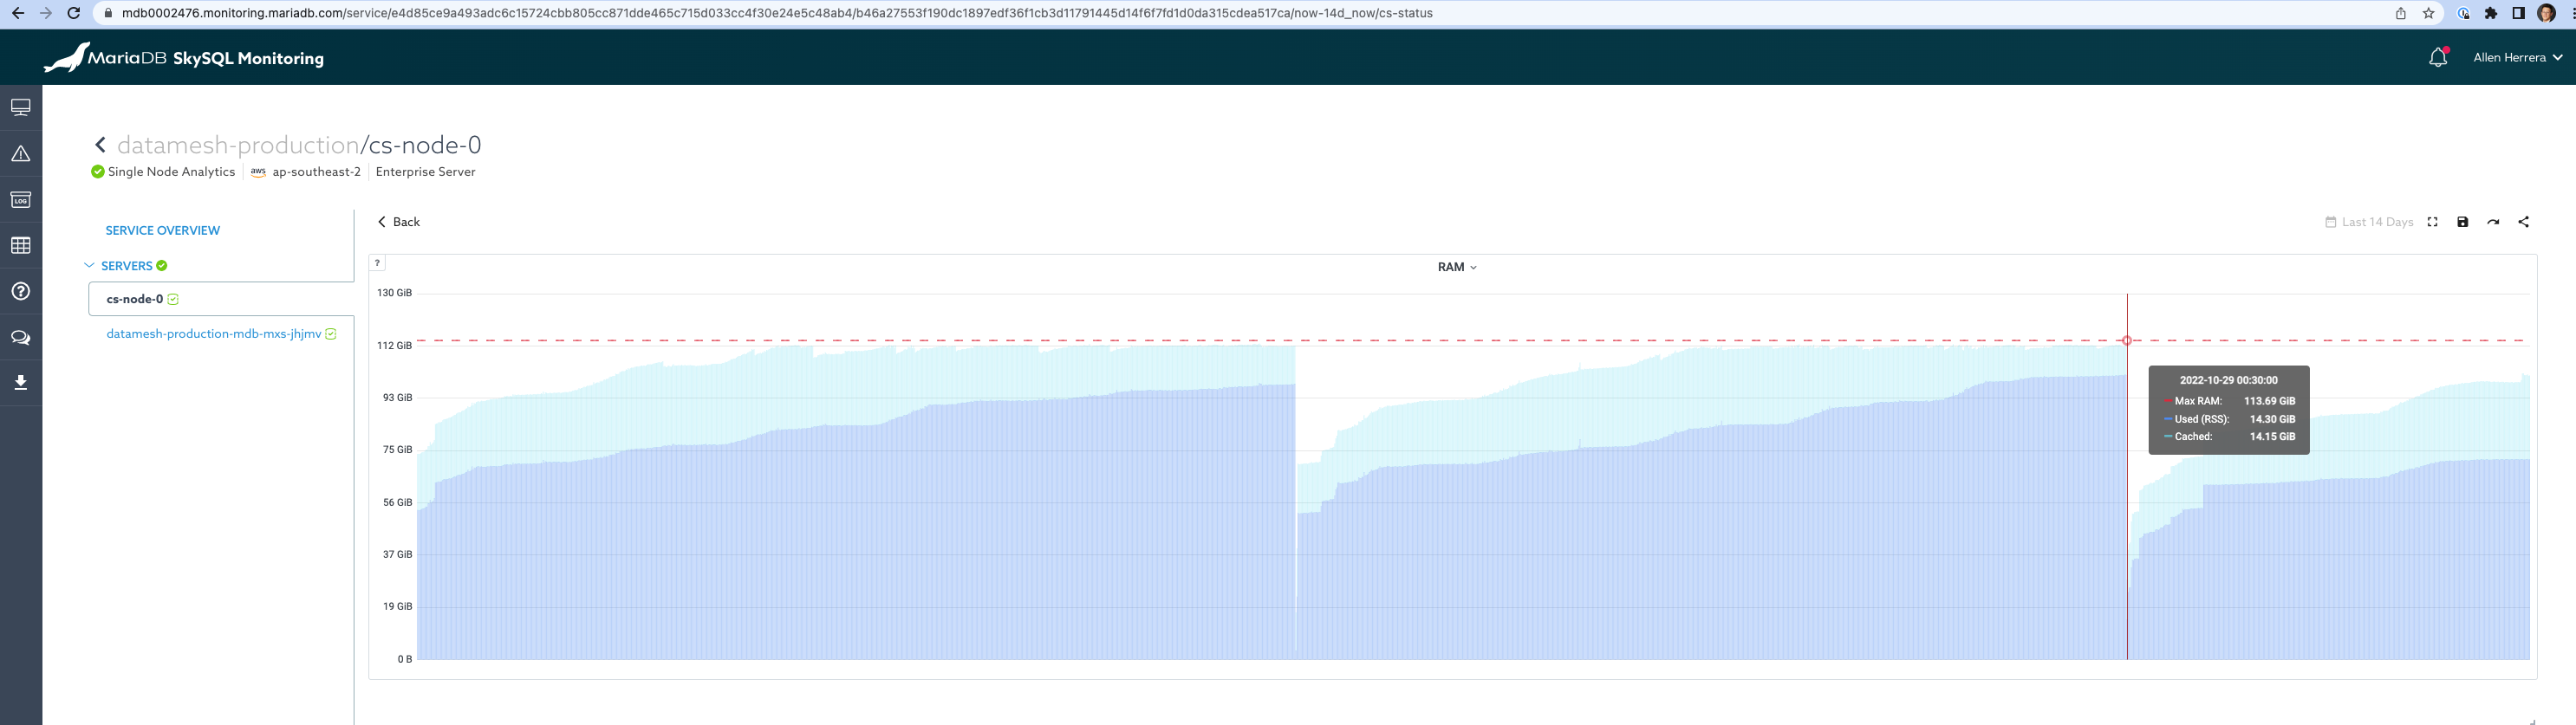
Currently theres a customer whose memory appears not to be released in skysql.
The current work around is that RDBA/ SRE has to manually mcsShutdown and mcsStart every couple days. However the customer often has to file a ticket saying its crashed and to restart before the scheduled stop/start to clear memory.
Link to Logs & Configs in comment below
Attachments
Issue Links
Activity
alan.mologorsky lets convert the instructions above from leonid.fedorov to one applicable to an existing docker container which DOES not have systemd.
Rough outline , that I am asking you to expand and try it
- run 63x container
- mcs cluster stop
- stop cmapi-server and mariadb
- Instructions for setting MALLOC_CONF
- start cmapi and mariadb
- mcs cluster start
- run workload
- collect profile
everyone understands that this is non-persistent setup and will not survive pod restart. This is just the frst step
leonid.fedorov pls edit your instructions to note the location of shred object. maybe create jmalloc_test folder on https://cspkg.s3.amazonaws.com/
this profiling allocator should be installed on one node with this steps.
mkdir /heap_profile
|
--- put shared object in this directory, with the name jemalloc.so
|
chmod 777 /heap_profile
|
then edit
/usr/lib/systemd/system/mcs-primproc.service
|
and replace line
ExecStart=/usr/bin/env bash -c "LD_PRELOAD=$(ldconfig -p | grep -m1 libjemalloc | awk '{print $1}') exec /usr/bin/PrimProc"
|
with
ExecStart=/usr/bin/env bash -c "MALLOC_CONF=prof:true,prof_leak:true,lg_prof_sample:19,prof_final:true,stats_print:true,abort:false,abort_conf:false,prof_prefix:/heap_profile/PrimProc_heap_profile LD_PRELOAD=/heap_profile/jemalloc.so exec /usr/bin/PrimProc"
|
reload systemctl config
systemctl daemon-reload
|
and restart primproc service
service mcs-primproc restart
|
After some payload there should be generated /heap_profile/*.profile files. with heap usage information. We want them for inspection
I created the profiling allocator shared object
wget https://github.com/jemalloc/jemalloc/releases/download/5.3.0/jemalloc-5.3.0.tar.bz2
|
./configure --disable-fill --with-jemalloc-prefix="" --enable-shared --enable-prof
|
make
|
it's attached to the issue, can be downloaded here: jemalloc
Yeah..
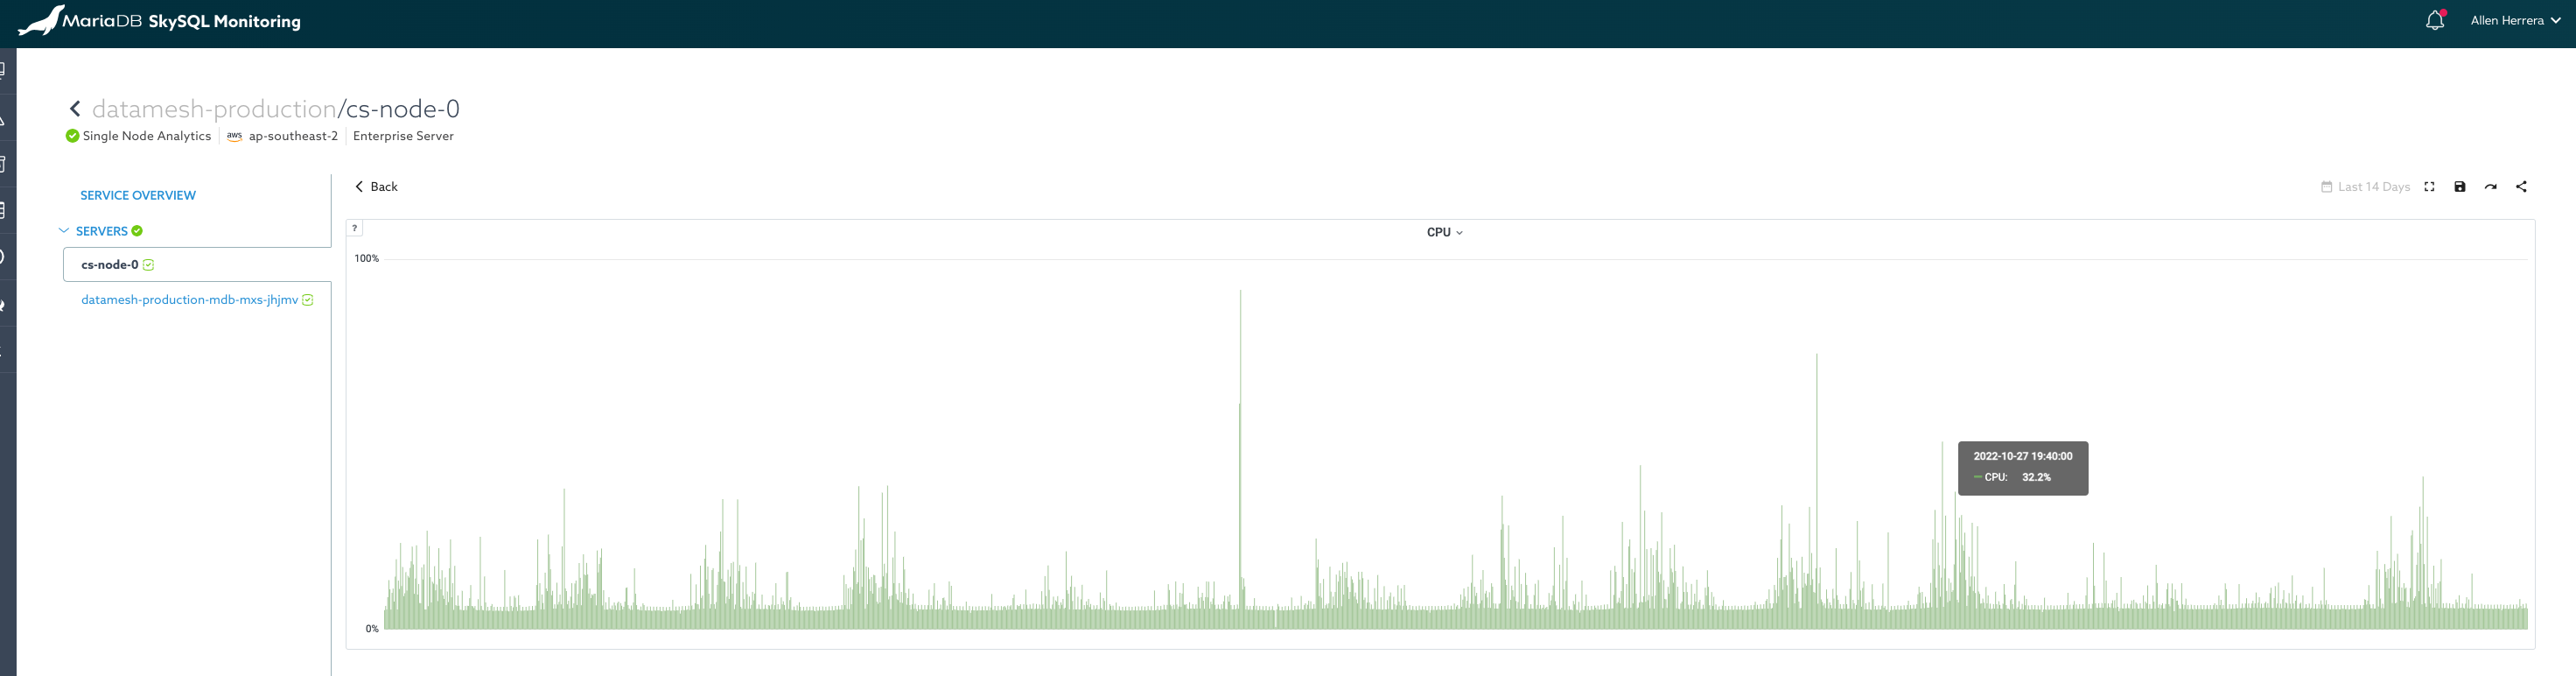
The query log shows a very rich set of OLTP + queries. I don't think it is possible to try each one inhouse and see the leak.
however we do see that exemgr process % of memory grows by 5-6% of total memory every 24h.
We also know that exemgr was refactored and merged into primproc in 22.08.x . It is unknown if this change fixes the problem.
The question is should we try now or wait till Sky upgrades the image .
mkdir /heap_profilechmod 777 /heap_profilecurl -o /heap_profile/jemalloc.so https://jira.mariadb.org/secure/attachment/67568/libjemalloc.so-1.2sed -i 's@$MCS_INSTALL_BIN/PrimProc@MALLOC_CONF=prof:true,prof_leak:true,lg_prof_sample:19,lg_prof_interval:33,prof_final:true,stats_print:true,abort:false,abort_conf:false,prof_prefix:/heap_profile/PrimProc_heap_profile LD_PRELOAD=/heap_profile/jemalloc.so $MCS_INSTALL_BIN/PrimProc@g' /usr/share/columnstore/cmapi/mcs_node_control/custom_dispatchers/container.sh