Details

    • Bug
    • Status: Closed (View Workflow)
    • Minor
    • Resolution: Incomplete
    • 22.08.1, 23.02.3
    • N/A
    • Core
    • RHEL v8.2
      VMware vCenter v7
      MariaDB v10.7 (3 node Galera cluster)
      Maxcsale v23.02.3 (one instance of each per MariaDB VM for redundancy)

    Description

      Hi There,

      We're experiencing regular load balancer crashes that seem to occur while vCenter commences vMotion activities on the same physical hosts where the MariaDB/Maxscale load balancer VMs reside. We have pinned the MariaDB/Maxscale load balancer VMs, as well as the application VMs that connect to the cluster, to the physical host they reside on, but to no avail. We have a three node cluster, and at least one of them experiences this event daily. Memory consumption varies between 50-75% (256Gb total), CPU 30-40% (16 vcores). Network connections immediately preceed the crashes. Upstream Java applications interface the cluster, DB connections vary between 20 to 80. Output below logs the core dump produced, please advise where the dumps are located as they don't appear in the system default location. Would gdb need to be configured to enable this?;

      2023-04-05 23:06:12 error : (871) Network error in connection to server 'viexh-session-usage-mdb-01', session in state 'Stopping session' (DCB::State::POLLING): 104, Connection reset by peer
      2023-04-05 23:06:12 error : (874) Network error in connection to server 'viexh-session-usage-mdb-01', session in state 'Stopping session' (DCB::State::POLLING): 104, Connection reset by peer
      2023-04-05 23:06:12 error : (879) Network error in connection to server 'viexh-session-usage-mdb-01', session in state 'Stopping session' (DCB::State::POLLING): 104, Connection reset by peer
      2023-04-05 23:06:12 error : (838) Network error in connection to server 'viexh-session-usage-mdb-01', session in state 'Stopping session' (DCB::State::POLLING): 104, Connection reset by peer (subsequent similar messages suppressed for 10000 milliseconds)
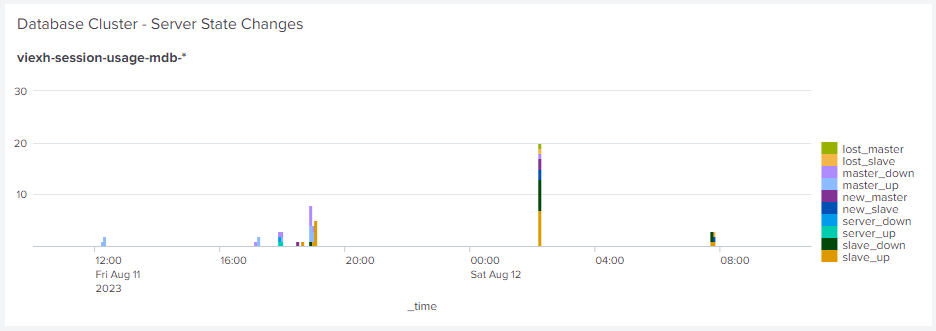
      2023-04-05 23:08:32 notice : Server changed state: viexh-session-usage-mdb-03[10.195.241.81:3306]: lost_slave. [Slave, Synced, Running] -> [Running]
      alert : MaxScale 22.08.1 received fatal signal 6. Commit ID: 2a533b7bce81e767ef5b263b0b32ebb509dbfe4c System name: Linux Release string: Red Hat Enterprise Linux release 8.2 (Ootpa)

      2023-04-05 23:08:52 alert : MaxScale 22.08.1 received fatal signal 6. Commit ID: 2a533b7bce81e767ef5b263b0b32ebb509dbfe4c System name: Linux Release string: Red Hat Enterprise Linux release 8.2 (Ootpa)
      2023-04-05 23:08:52 alert : Statement currently being classified: none/unknown
      2023-04-05 23:08:52 notice : For a more detailed stacktrace, install GDB and add 'debug=gdb-stacktrace' under the [maxscale] section.
      /lib64/libc.so.6(epoll_wait+0x57): ??:?
      /usr/lib64/maxscale/libmaxscale-common.so.1.0.0(_ZN7maxbase6Worker15poll_waiteventsEv+0x120): maxutils/maxbase/src/worker.cc:1099
      /usr/lib64/maxscale/libmaxscale-common.so.1.0.0(_ZN7maxbase6Worker3runEPNS_9SemaphoreE+0x4f): maxutils/maxbase/src/worker.cc:822
      /usr/bin/maxscale(main+0x214c): server/core/gateway.cc:2235
      /lib64/libc.so.6(__libc_start_main+0xf3): ??:?
      /usr/bin/maxscale(_start+0x2e): ??:?
      alert : Writing core dump.

      Thanks.

      Attachments

        1. galera-1.txt
          0.7 kB
        2. galera-2.txt
          0.7 kB
        3. galera-3.txt
          0.7 kB
        4. mariadb-1.txt
          3 kB
        5. mariadb-2.txt
          3 kB
        6. mariadb-3.txt
          3 kB
        7. maxscale-server-1.txt
          5 kB
        8. maxscale-server-2.txt
          3 kB
        9. maxscale-server-3.txt
          3 kB
        10. MXS-4711_keepalived-config-01.txt
          0.6 kB
        11. MXS-4711_maxscale-graphs-01.PNG
          MXS-4711_maxscale-graphs-01.PNG
          21 kB
        12. MXS-4711_maxscale-logs-01.txt
          241 kB
        13. MXS-4711_maxscale-logs-02.txt
          6 kB
        14. MXS-4711_maxscale-logs-03.txt
          40 kB
        15. MXS-4711_maxscale-logs-04.txt
          21 kB

        Activity

          markus makela markus makela added a comment -

          There's an internal thread in MaxScale that monitors the state of all other threads in MaxScale to make sure they aren't stuck. The upcoming 22.08.8 release will contain some improvements that will log the name of the thread that is stuck if a stuck thread is detected. Once the release is out, you could upgrade the MaxScale instances and we should see which thread is stuck.

          markus makela markus makela added a comment - There's an internal thread in MaxScale that monitors the state of all other threads in MaxScale to make sure they aren't stuck. The upcoming 22.08.8 release will contain some improvements that will log the name of the thread that is stuck if a stuck thread is detected. Once the release is out, you could upgrade the MaxScale instances and we should see which thread is stuck.
          Presnickety Presnickety added a comment -

          Hello Markus,

          We'll upgrade to that version when available.

          The issue we have is both vSAN & vMotion traffic share the same allocated bandwidth through the physical host NICs, so whenever a vMotion occurs the associated data transfer chokes everything else. We're currently running the two host 10gb NICs as active/standby, we will configure them as active/active thereby doubling throughput to 20gb as see if that helps. Please close the the ticket if you need to.

          Thanks.

          Presnickety Presnickety added a comment - Hello Markus, We'll upgrade to that version when available. The issue we have is both vSAN & vMotion traffic share the same allocated bandwidth through the physical host NICs, so whenever a vMotion occurs the associated data transfer chokes everything else. We're currently running the two host 10gb NICs as active/standby, we will configure them as active/active thereby doubling throughput to 20gb as see if that helps. Please close the the ticket if you need to. Thanks.
          markus makela markus makela added a comment -

          OK, I think that means that it's most likely a DNS request that's blocking MaxScale and it's just not fast enough to respond to the SystemD watchdog requests to be considered alive. Do you notice a slowdown in the client applications whenever this happens? If you do, this would be supporting evidence to the theory of DNS lookups causing it.

          markus makela markus makela added a comment - OK, I think that means that it's most likely a DNS request that's blocking MaxScale and it's just not fast enough to respond to the SystemD watchdog requests to be considered alive. Do you notice a slowdown in the client applications whenever this happens? If you do, this would be supporting evidence to the theory of DNS lookups causing it.
          Presnickety Presnickety added a comment -

          Hello Markus,

          It's more of a complete stop after these events, when the failover usually occurs connections flip to the next available load balancer, Unsure if this is related to a DNS issue, what we observe after most failover events is the Java apps are unable to get to the DB backends and report "Exhausted to Serve". At this point, most times the connection count remains low, and even when connection count does remain high, the only way to resolve this is by restarting the apps;

          {{2023-08-26 07:19:33,991 ERROR com.telstra.mds.extrahop.kafka.consumer.AccountingListener [mds-cpvnf-extrahop-10-C-1] All Retry-Attempts=201 Exhausted to Serve AcctRecord=

          {"username":"XYZ","acct_status_type":"Interim","acct_session_id":"13413309","event_timestamp":1692998370,"acct_input_octets":946925639,"acct_output_octets":1633297247,"acct_session_time":43200,"acct_delay_time":0,"frame_ip":"100.70.152.54","acct_input_gigawords":0,"nas_identifier":"XYZ","nas_port":3145,"nas_port_id":"ae1.demux0.3222004542:202-3145","nas_port_type":"Ethernet(15)","acct_output_gigawords":4,"nas_ip":"XYZ","last_hb":1692998371062.749}

          }}

          Thanks

          Presnickety Presnickety added a comment - Hello Markus, It's more of a complete stop after these events, when the failover usually occurs connections flip to the next available load balancer, Unsure if this is related to a DNS issue, what we observe after most failover events is the Java apps are unable to get to the DB backends and report "Exhausted to Serve". At this point, most times the connection count remains low, and even when connection count does remain high, the only way to resolve this is by restarting the apps; {{2023-08-26 07:19:33,991 ERROR com.telstra.mds.extrahop.kafka.consumer.AccountingListener [mds-cpvnf-extrahop-10-C-1] All Retry-Attempts=201 Exhausted to Serve AcctRecord= {"username":"XYZ","acct_status_type":"Interim","acct_session_id":"13413309","event_timestamp":1692998370,"acct_input_octets":946925639,"acct_output_octets":1633297247,"acct_session_time":43200,"acct_delay_time":0,"frame_ip":"100.70.152.54","acct_input_gigawords":0,"nas_identifier":"XYZ","nas_port":3145,"nas_port_id":"ae1.demux0.3222004542:202-3145","nas_port_type":"Ethernet(15)","acct_output_gigawords":4,"nas_ip":"XYZ","last_hb":1692998371062.749} }} Thanks
          markus makela markus makela added a comment -

          I'll close this ticket now that most of the problems have been solved. There's an open issue (MXS-4710) for fixing the cases where a slow DNS server can cause the MaxScale process to be killed. I filed MXS-4778 for improving the handling of the case where the DNS lookups are indeed the cause of the aborts.

          markus makela markus makela added a comment - I'll close this ticket now that most of the problems have been solved. There's an open issue ( MXS-4710 ) for fixing the cases where a slow DNS server can cause the MaxScale process to be killed. I filed MXS-4778 for improving the handling of the case where the DNS lookups are indeed the cause of the aborts.

          People

            markus makela markus makela
            Presnickety Presnickety
            Votes:
            0 Vote for this issue
            Watchers:
            3 Start watching this issue

            Dates

              Created:
              Updated:
              Resolved:

              Git Integration

                Error rendering 'com.xiplink.jira.git.jira_git_plugin:git-issue-webpanel'. Please contact your Jira administrators.