Details
-
Bug
-
Status: Closed (View Workflow)
-
 Critical
-
Resolution: Fixed
-
5.5.32
-
None
-
None
-
Debian Wheezy x86_64
Linux greeneggs.lentz.com.au 3.9.3-x86_64-linode33 #1 SMP Mon May 20 10:22:57 EDT 2013 x86_64 GNU/Linux
Description
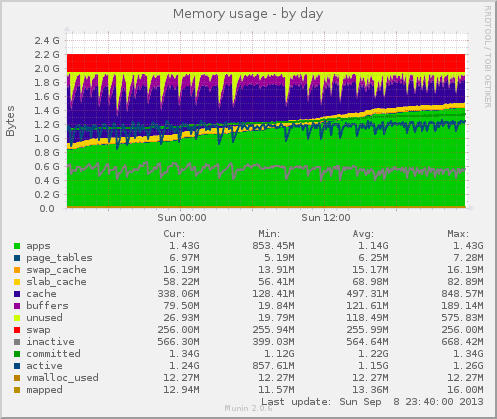
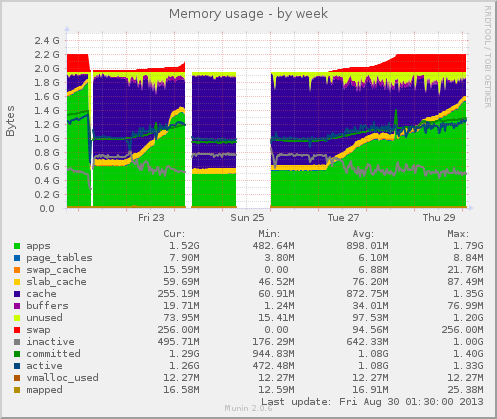
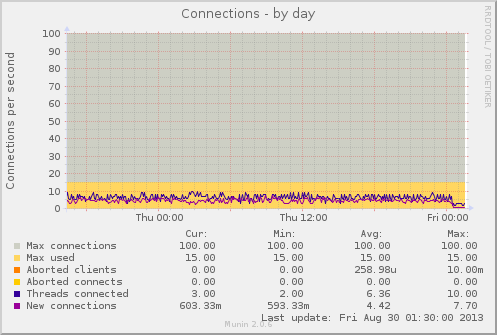
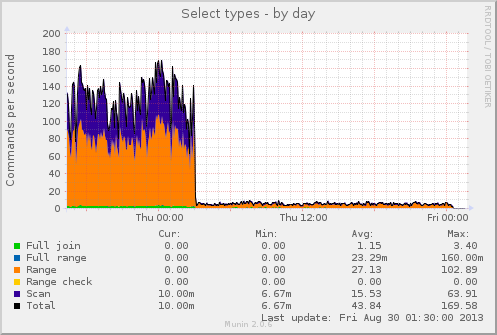
After running mariadb-5.5.32 in a multimaster for a few days its almost out of memory on the active master (the one getting all the reads).
The replication slave (same version) doesn't suffer the memory leak (with or without the replication filters defined).
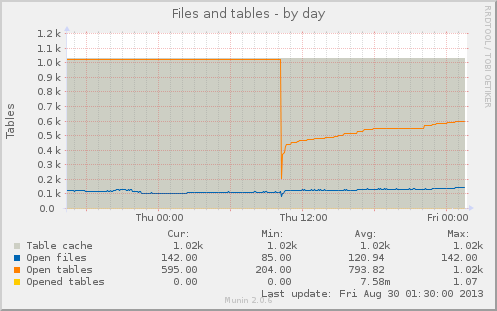
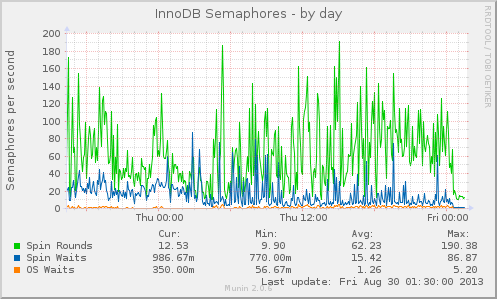
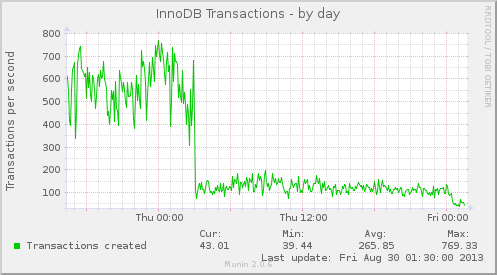
Disabling the query cache on the active master may (was slightly off peak) have slowed the memory leak however it wasn't stopped. In the graph attached the query cache was disabled from Wed 5:30 to Thursday 03:00
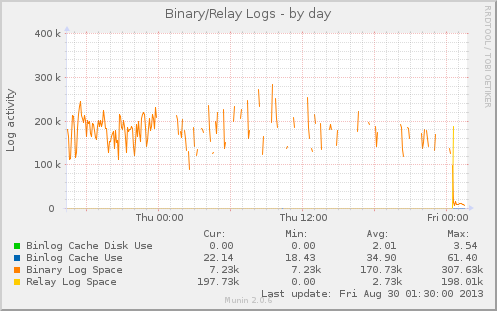
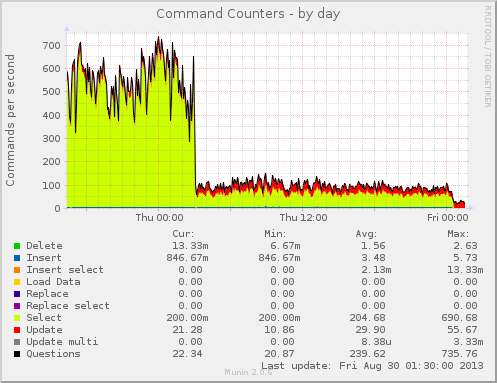
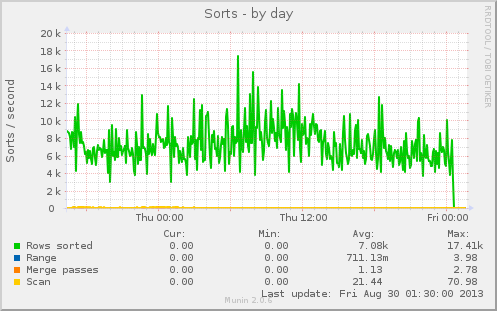
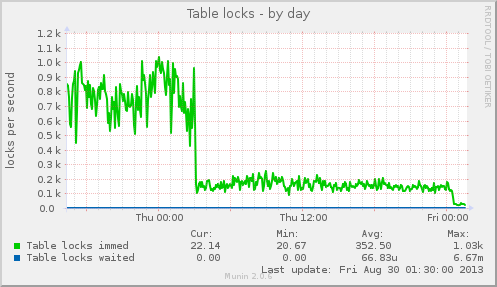
For greeneggs-mysql_commands-day.png the first drop is when query cache was turned back on. At the end I moved the active master to the other server. Other graphs are for this same time interval.
Memory usage calculation:
From http://dev.mysql.com/doc/refman/5.5/en/memory-use.html
per connection:
@read_buffer_size + @read_rnd_buffer_size + @sort_buffer_size + @join_buffer_size + @binlog_cache_size + @thread_stack + @@tmp_table_size = 19070976
Max_used_connections 15
Static component:
@key_buffer_size + @query_cache_size + @innodb_buffer_pool_size + @innodb_additional_mem_pool_size + @@innodb_log_buffer_size
322961408
select 15 * 19070976 + 322961408; = 609026048
609M max
From top:
PID USER PR NI VIRT RES SHR S %CPU %MEM TIME+ COMMAND
4532 mysql 20 0 1999m 1.4g 6072 S 4.0 71.9 1017:21 mysqld
I've still got the server running if more status is required.
show engine innodb status
=====================================
130830 0:46:23 INNODB MONITOR OUTPUT
=====================================
Per second averages calculated from the last 17 seconds
-----------------
BACKGROUND THREAD
-----------------
srv_master_thread loops: 372124 1_second, 372076 sleeps, 37113 10_second, 1716 background, 1715 flush
srv_master_thread log flush and writes: 350597
----------
SEMAPHORES
----------
OS WAIT ARRAY INFO: reservation count 999301, signal count 1149136
Mutex spin waits 3647275, rounds 12020660, OS waits 198769
RW-shared spins 896419, rounds 19893071, OS waits 574516
RW-excl spins 68006, rounds 6887165, OS waits 204958
Spin rounds per wait: 3.30 mutex, 22.19 RW-shared, 101.27 RW-excl
--------
FILE I/O
--------
I/O thread 0 state: waiting for completed aio requests (insert buffer thread)
I/O thread 1 state: waiting for completed aio requests (log thread)
I/O thread 2 state: waiting for completed aio requests (read thread)
I/O thread 3 state: waiting for completed aio requests (read thread)
I/O thread 4 state: waiting for completed aio requests (write thread)
I/O thread 5 state: waiting for completed aio requests (write thread)
Pending normal aio reads: 0 [0, 0] , aio writes: 0 [0, 0] ,
ibuf aio reads: 0, log i/o's: 0, sync i/o's: 0
Pending flushes (fsync) log: 0; buffer pool: 0
7906118 OS file reads, 39186717 OS file writes, 23493355 OS fsyncs
0.65 reads/s, 16384 avg bytes/read, 66.29 writes/s, 29.06 fsyncs/s
-------------------------------------
INSERT BUFFER AND ADAPTIVE HASH INDEX
-------------------------------------
Ibuf: size 1, free list len 287, seg size 289, 111478 merges
merged operations:
insert 106175, delete mark 100854, delete 13481
discarded operations:
insert 0, delete mark 0, delete 0
Hash table size 553229, node heap has 584 buffer(s)
244.87 hash searches/s, 22.53 non-hash searches/s
—
LOG
—
Log sequence number 1981376581482
Log flushed up to 1981376581482
Last checkpoint at 1981376562791
Max checkpoint age 84223550
Checkpoint age target 81591565
Modified age 18691
Checkpoint age 18691
0 pending log writes, 0 pending chkp writes
22419510 log i/o's done, 26.00 log i/o's/second
----------------------
BUFFER POOL AND MEMORY
----------------------
Total memory allocated 275644416; in additional pool allocated 0
Total memory allocated by read views 136
Internal hash tables (constant factor + variable factor)
Adaptive hash index 13998304 (4425832 + 9572472)
Page hash 277432 (buffer pool 0 only)
Dictionary cache 10287074 (1107952 + 9179122)
File system 648160 (82672 + 565488)
Lock system 665688 (664936 + 752)
Recovery system 0 (0 + 0)
Dictionary memory allocated 9179122
Buffer pool size 16383
Buffer pool size, bytes 268419072
Free buffers 1
Database pages 15798
Old database pages 5811
Modified db pages 97
Pending reads 0
Pending writes: LRU 0, flush list 0, single page 0
Pages made young 10760065, not young 0
0.53 youngs/s, 0.00 non-youngs/s
Pages read 7903370, created 882751, written 16452888
0.65 reads/s, 0.00 creates/s, 39.47 writes/s
Buffer pool hit rate 1000 / 1000, young-making rate 0 / 1000 not 0 / 1000
Pages read ahead 0.00/s, evicted without access 0.00/s, Random read ahead 0.00/s
LRU len: 15798, unzip_LRU len: 0
I/O sum[1550]:cur[322], unzip sum[0]:cur[0]
--------------
ROW OPERATIONS
--------------
0 queries inside InnoDB, 0 queries in queue
1 read views open inside InnoDB
0 transactions active inside InnoDB
0 out of 1000 descriptors used
--OLDEST VIEW--
Normal read view
Read view low limit trx n:o 7D2D2F07
Read view up limit trx id 7D2D2F07
Read view low limit trx id 7D2D2F07
Read view individually stored trx ids:
-----------------
Main thread process no. 4532, id 140201824495360, state: sleeping
Number of rows inserted 1308400, updated 9736429, deleted 1227755, read 34888786828
1.00 inserts/s, 11.71 updates/s, 0.00 deletes/s, 249.22 reads/s
------------------------
LATEST DETECTED DEADLOCK
------------------------
130830 0:27:15
-
-
- (1) TRANSACTION:
TRANSACTION 7D2C63D3, ACTIVE 0 sec starting index read
- (1) TRANSACTION:
-
| Variable_name | Value |
| Aborted_clients | 57 |
| Aborted_connects | 0 |
| Access_denied_errors | 0 |
| Aria_pagecache_blocks_not_flushed | 0 |
| Aria_pagecache_blocks_unused | 15737 |
| Aria_pagecache_blocks_used | 3127 |
| Aria_pagecache_read_requests | 262055553 |
| Aria_pagecache_reads | 107163 |
| Aria_pagecache_write_requests | 69866678 |
| Aria_pagecache_writes | 0 |
| Aria_transaction_log_syncs | 0 |
| Binlog_commits | 12529081 |
| Binlog_group_commits | 12486299 |
| Binlog_snapshot_file | mariadb-bin.001408 |
| Binlog_snapshot_position | 57228334 |
| Binlog_bytes_written | 43273655871 |
| Binlog_cache_disk_use | 768128 |
| Binlog_cache_use | 12510967 |
| Binlog_stmt_cache_disk_use | 24 |
| Binlog_stmt_cache_use | 18077 |
| Busy_time | 0.000000 |
| Bytes_received | 60129853267 |
| Bytes_sent | 691695773018 |
| Com_admin_commands | 3809 |
| Com_assign_to_keycache | 0 |
| Com_alter_db | 0 |
| Com_alter_db_upgrade | 0 |
| Com_alter_event | 0 |
| Com_alter_function | 0 |
| Com_alter_procedure | 0 |
| Com_alter_server | 0 |
| Com_alter_table | 114 |
| Com_alter_tablespace | 0 |
| Com_analyze | 0 |
| Com_begin | 62278 |
| Com_binlog | 0 |
| Com_call_procedure | 0 |
| Com_change_db | 69728 |
| Com_change_master | 0 |
| Com_check | 1426 |
| Com_checksum | 0 |
| Com_commit | 45717 |
| Com_create_db | 1 |
| Com_create_event | 0 |
| Com_create_function | 0 |
| Com_create_index | 0 |
| Com_create_procedure | 1 |
| Com_create_server | 0 |
| Com_create_table | 42 |
| Com_create_trigger | 0 |
| Com_create_udf | 0 |
| Com_create_user | 0 |
| Com_create_view | 0 |
| Com_dealloc_sql | 24 |
| Com_delete | 388136 |
| Com_delete_multi | 5 |
| Com_do | 0 |
| Com_drop_db | 1 |
| Com_drop_event | 0 |
| Com_drop_function | 0 |
| Com_drop_index | 0 |
| Com_drop_procedure | 2 |
| Com_drop_server | 0 |
| Com_drop_table | 1 |
| Com_drop_trigger | 0 |
| Com_drop_user | 0 |
| Com_drop_view | 0 |
| Com_empty_query | 0 |
| Com_execute_sql | 24 |
| Com_flush | 6 |
| Com_grant | 0 |
| Com_ha_close | 0 |
| Com_ha_open | 0 |
| Com_ha_read | 0 |
| Com_help | 2 |
| Com_insert | 847948 |
| Com_insert_select | 551 |
| Com_install_plugin | 0 |
| Com_kill | 50 |
| Com_load | 0 |
| Com_lock_tables | 0 |
| Com_optimize | 0 |
| Com_preload_keys | 0 |
| Com_prepare_sql | 24 |
| Com_purge | 0 |
| Com_purge_before_date | 0 |
| Com_release_savepoint | 0 |
| Com_rename_table | 0 |
| Com_rename_user | 0 |
| Com_repair | 0 |
| Com_replace | 0 |
| Com_replace_select | 0 |
| Com_reset | 0 |
| Com_resignal | 0 |
| Com_revoke | 0 |
| Com_revoke_all | 0 |
| Com_rollback | 3 |
| Com_rollback_to_savepoint | 0 |
| Com_savepoint | 0 |
| Com_select | 47174988 |
| Com_set_option | 1189075 |
| Com_signal | 0 |
| Com_show_authors | 0 |
| Com_show_binlog_events | 3 |
| Com_show_binlogs | 1166 |
| Com_show_charsets | 0 |
| Com_show_client_statistics | 0 |
| Com_show_collations | 0 |
| Com_show_contributors | 0 |
| Com_show_create_db | 115 |
| Com_show_create_event | 0 |
| Com_show_create_func | 0 |
| Com_show_create_proc | 0 |
| Com_show_create_table | 4387 |
| Com_show_create_trigger | 0 |
| Com_show_databases | 7 |
| Com_show_engine_logs | 0 |
| Com_show_engine_mutex | 0 |
| Com_show_engine_status | 1167 |
| Com_show_events | 0 |
| Com_show_errors | 0 |
| Com_show_fields | 5721 |
| Com_show_function_status | 0 |
| Com_show_grants | 0 |
| Com_show_keys | 0 |
| Com_show_index_statistics | 0 |
| Com_show_master_status | 1 |
| Com_show_open_tables | 0 |
| Com_show_plugins | 0 |
| Com_show_privileges | 0 |
| Com_show_procedure_status | 0 |
| Com_show_processlist | 1039 |
| Com_show_profile | 0 |
| Com_show_profiles | 0 |
| Com_show_relaylog_events | 0 |
| Com_show_slave_hosts | 0 |
| Com_show_slave_status | 140780 |
| Com_show_status | 12670 |
| Com_show_storage_engines | 0 |
| Com_show_table_statistics | 0 |
| Com_show_table_status | 4287 |
| Com_show_tables | 6794 |
| Com_show_triggers | 4280 |
| Com_show_user_statistics | 0 |
| Com_show_variables | 2175 |
| Com_show_warnings | 0 |
| Com_slave_start | 10 |
| Com_slave_stop | 4 |
| Com_stmt_close | 24 |
| Com_stmt_execute | 24 |
| Com_stmt_fetch | 0 |
| Com_stmt_prepare | 24 |
| Com_stmt_reprepare | 0 |
| Com_stmt_reset | 0 |
| Com_stmt_send_long_data | 0 |
| Com_truncate | 0 |
| Com_uninstall_plugin | 0 |
| Com_unlock_tables | 2 |
| Com_update | 7082015 |
| Com_update_multi | 1 |
| Com_xa_commit | 0 |
| Com_xa_end | 0 |
| Com_xa_prepare | 0 |
| Com_xa_recover | 0 |
| Com_xa_rollback | 0 |
| Com_xa_start | 0 |
| Compression | OFF |
| Connections | 1164212 |
| Cpu_time | 0.000000 |
| Created_tmp_disk_tables | 2202858 |
| Created_tmp_files | 420678 |
| Created_tmp_tables | 5264753 |
| Delayed_errors | 0 |
| Delayed_insert_threads | 0 |
| Delayed_writes | 0 |
| Empty_queries | 14900340 |
| Executed_events | 0 |
| Executed_triggers | 0 |
| Feature_dynamic_columns | 0 |
| Feature_fulltext | 2 |
| Feature_gis | 28 |
| Feature_locale | 0 |
| Feature_subquery | 135848 |
| Feature_timezone | 6850 |
| Feature_trigger | 586 |
| Feature_xml | 0 |
| Flush_commands | 4 |
| Handler_commit | 63318523 |
| Handler_delete | 748245 |
| Handler_discover | 0 |
| Handler_icp_attempts | 71118314 |
| Handler_icp_match | 71108704 |
| Handler_mrr_init | 0 |
| Handler_mrr_key_refills | 0 |
| Handler_mrr_rowid_refills | 0 |
| Handler_prepare | 14968970 |
| Handler_read_first | 1155850 |
| Handler_read_key | 466199920 |
| Handler_read_last | 55346 |
| Handler_read_next | 27258307498 |
| Handler_read_prev | 8491322 |
| Handler_read_rnd | 66364460 |
| Handler_read_rnd_deleted | 1194 |
| Handler_read_rnd_next | 8174479457 |
| Handler_rollback | 21990 |
| Handler_savepoint | 0 |
| Handler_savepoint_rollback | 0 |
| Handler_tmp_update | 15018397 |
| Handler_tmp_write | 515819305 |
| Handler_update | 6481729 |
| Handler_write | 849123 |
| Innodb_adaptive_hash_cells | 553229 |
| Innodb_adaptive_hash_heap_buffers | 581 |
| Innodb_adaptive_hash_hash_searches | 1107671046 |
| Innodb_adaptive_hash_non_hash_searches | 249488632 |
| Innodb_background_log_sync | 350697 |
| Innodb_buffer_pool_pages_data | 15800 |
| Innodb_buffer_pool_bytes_data | 258867200 |
| Innodb_buffer_pool_pages_dirty | 295 |
| Innodb_buffer_pool_bytes_dirty | 4833280 |
| Innodb_buffer_pool_pages_flushed | 16456234 |
| Innodb_buffer_pool_pages_LRU_flushed | 48422 |
| Innodb_buffer_pool_pages_free | 1 |
| Innodb_buffer_pool_pages_made_not_young | 0 |
| Innodb_buffer_pool_pages_made_young | 10760117 |
| Innodb_buffer_pool_pages_misc | 582 |
| Innodb_buffer_pool_pages_old | 5812 |
| Innodb_buffer_pool_pages_total | 16383 |
| Innodb_buffer_pool_read_ahead_rnd | 0 |
| Innodb_buffer_pool_read_ahead | 2072088 |
| Innodb_buffer_pool_read_ahead_evicted | 91126 |
| Innodb_buffer_pool_read_requests | 10973288017 |
| Innodb_buffer_pool_reads | 5715842 |
| Innodb_buffer_pool_wait_free | 9 |
| Innodb_buffer_pool_write_requests | 132620870 |
| Innodb_checkpoint_age | 88015 |
| Innodb_checkpoint_max_age | 84223550 |
| Innodb_checkpoint_target_age | 81591565 |
| Innodb_data_fsyncs | 23497491 |
| Innodb_data_pending_fsyncs | 0 |
| Innodb_data_pending_reads | 0 |
| Innodb_data_pending_writes | 0 |
| Innodb_data_read | 129493962752 |
| Innodb_data_reads | 7906173 |
| Innodb_data_writes | 39194030 |
| Innodb_data_written | 586483447808 |
| Innodb_dblwr_pages_written | 16456234 |
| Innodb_dblwr_writes | 182242 |
| Innodb_deadlocks | 432 |
| Innodb_dict_tables | 1315 |
| Innodb_have_atomic_builtins | ON |
| Innodb_history_list_length | 3523 |
| Innodb_ibuf_discarded_delete_marks | 0 |
| Innodb_ibuf_discarded_deletes | 0 |
| Innodb_ibuf_discarded_inserts | 0 |
| Innodb_ibuf_free_list | 287 |
| Innodb_ibuf_merged_delete_marks | 100855 |
| Innodb_ibuf_merged_deletes | 13481 |
| Innodb_ibuf_merged_inserts | 106192 |
| Innodb_ibuf_merges | 111495 |
| Innodb_ibuf_segment_size | 289 |
| Innodb_ibuf_size | 1 |
| Innodb_log_waits | 0 |
| Innodb_log_write_requests | 73751900 |
| Innodb_log_writes | 22385577 |
| Innodb_lsn_current | 1981377626218 |
| Innodb_lsn_flushed | 1981377626218 |
| Innodb_lsn_last_checkpoint | 1981377538203 |
| Innodb_master_thread_1_second_loops | 372239 |
| Innodb_master_thread_10_second_loops | 37124 |
| Innodb_master_thread_background_loops | 1716 |
| Innodb_master_thread_main_flush_loops | 1715 |
| Innodb_master_thread_sleeps | 372191 |
| Innodb_max_trx_id | 2100117045 |
| Innodb_mem_adaptive_hash | 13965536 |
| Innodb_mem_dictionary | 10287074 |
| Innodb_mem_total | 275644416 |
| Innodb_mutex_os_waits | 198788 |
| Innodb_mutex_spin_rounds | 12021403 |
| Innodb_mutex_spin_waits | 3647342 |
| Innodb_oldest_view_low_limit_trx_id | 2100116933 |
| Innodb_os_log_fsyncs | 22425791 |
| Innodb_os_log_pending_fsyncs | 0 |
| Innodb_os_log_pending_writes | 0 |
| Innodb_os_log_written | 47227117568 |
| Innodb_page_size | 16384 |
| Innodb_pages_created | 882752 |
| Innodb_pages_read | 7903425 |
| Innodb_pages_written | 16456234 |
| Innodb_purge_trx_id | 2100116933 |
| Innodb_purge_undo_no | 0 |
| Innodb_row_lock_current_waits | 0 |
| Innodb_current_row_locks | 0 |
| Innodb_row_lock_time | 3209772 |
| Innodb_row_lock_time_avg | 74 |
| Innodb_row_lock_time_max | 31935 |
| Innodb_row_lock_waits | 43208 |
| Innodb_rows_deleted | 1227755 |
| Innodb_rows_inserted | 1308502 |
| Innodb_rows_read | 34888819968 |
| Innodb_rows_updated | 9738262 |
| Innodb_read_views_memory | 136 |
| Innodb_descriptors_memory | 8000 |
| Innodb_s_lock_os_waits | 574527 |
| Innodb_s_lock_spin_rounds | 19893402 |
| Innodb_s_lock_spin_waits | 896432 |
| Innodb_truncated_status_writes | 0 |
| Innodb_x_lock_os_waits | 204987 |
| Innodb_x_lock_spin_rounds | 6888035 |
| Innodb_x_lock_spin_waits | 68006 |
| Key_blocks_not_flushed | 0 |
| Key_blocks_unused | 5353 |
| Key_blocks_used | 4170 |
| Key_blocks_warm | 141 |
| Key_read_requests | 6295929 |
| Key_reads | 9626 |
| Key_write_requests | 21159 |
| Key_writes | 10962 |
| Last_query_cost | 0.000000 |
| Max_used_connections | 15 |
| Not_flushed_delayed_rows | 0 |
| Open_files | 142 |
| Open_streams | 0 |
| Open_table_definitions | 397 |
| Open_tables | 595 |
| Opened_files | 9756380 |
| Opened_table_definitions | 6425 |
| Opened_tables | 8666 |
| Opened_views | 0 |
| Performance_schema_cond_classes_lost | 0 |
| Performance_schema_cond_instances_lost | 0 |
| Performance_schema_file_classes_lost | 0 |
| Performance_schema_file_handles_lost | 0 |
| Performance_schema_file_instances_lost | 0 |
| Performance_schema_locker_lost | 0 |
| Performance_schema_mutex_classes_lost | 0 |
| Performance_schema_mutex_instances_lost | 0 |
| Performance_schema_rwlock_classes_lost | 0 |
| Performance_schema_rwlock_instances_lost | 0 |
| Performance_schema_table_handles_lost | 0 |
| Performance_schema_table_instances_lost | 0 |
| Performance_schema_thread_classes_lost | 0 |
| Performance_schema_thread_instances_lost | 0 |
| Prepared_stmt_count | 0 |
| Qcache_free_blocks | 6616 |
| Qcache_free_memory | 18486664 |
| Qcache_hits | 75724207 |
| Qcache_inserts | 8304484 |
| Qcache_lowmem_prunes | 1719071 |
| Qcache_not_cached | 2443705 |
| Qcache_queries_in_cache | 8992 |
| Qcache_total_blocks | 24978 |
| Queries | 142821923 |
| Questions | 133827961 |
| Rows_read | 35275818740 |
| Rows_sent | 1787826753 |
| Rows_tmp_read | 592687087 |
| Rpl_status | AUTH_MASTER |
| Select_full_join | 268533 |
| Select_full_range_join | 6393 |
| Select_range | 6218451 |
| Select_range_check | 0 |
| Select_scan | 3587397 |
| Slave_heartbeat_period | 1800.000 |
| Slave_open_temp_tables | 0 |
| Slave_received_heartbeats | 0 |
| Slave_retried_transactions | 0 |
| Slave_running | ON |
| Slow_launch_threads | 0 |
| Slow_queries | 3796864 |
| Sort_merge_passes | 269513 |
| Sort_range | 170798 |
| Sort_rows | 1870364969 |
| Sort_scan | 4917255 |
| Sphinx_error | |
| Sphinx_time | |
| Sphinx_total | |
| Sphinx_total_found | |
| Sphinx_word_count | |
| Sphinx_words | |
| Ssl_accept_renegotiates | 0 |
| Ssl_accepts | 0 |
| Ssl_callback_cache_hits | 0 |
| Ssl_cipher | |
| Ssl_cipher_list | |
| Ssl_client_connects | 0 |
| Ssl_connect_renegotiates | 0 |
| Ssl_ctx_verify_depth | 0 |
| Ssl_ctx_verify_mode | 0 |
| Ssl_default_timeout | 0 |
| Ssl_finished_accepts | 0 |
| Ssl_finished_connects | 0 |
| Ssl_session_cache_hits | 0 |
| Ssl_session_cache_misses | 0 |
| Ssl_session_cache_mode | NONE |
| Ssl_session_cache_overflows | 0 |
| Ssl_session_cache_size | 0 |
| Ssl_session_cache_timeouts | 0 |
| Ssl_sessions_reused | 0 |
| Ssl_used_session_cache_entries | 0 |
| Ssl_verify_depth | 0 |
| Ssl_verify_mode | 0 |
| Ssl_version | |
| Subquery_cache_hit | 4512 |
| Subquery_cache_miss | 3930 |
| Syncs | 4171361 |
| Table_locks_immediate | 85865730 |
| Table_locks_waited | 15 |
| Tc_log_max_pages_used | 0 |
| Tc_log_page_size | 0 |
| Tc_log_page_waits | 46 |
| Threadpool_idle_threads | 0 |
| Threadpool_threads | 0 |
| Threads_cached | 13 |
| Threads_connected | 2 |
| Threads_created | 15 |
| Threads_running | 2 |
| Uptime | 349494 |
| Uptime_since_flush_status | 349494 |
| Variable_name | Value | |
| aria_block_size | 8192 | |
| aria_checkpoint_interval | 30 | |
| aria_checkpoint_log_activity | 1048576 | |
| aria_force_start_after_recovery_failures | 0 | |
| aria_group_commit | none | |
| aria_group_commit_interval | 0 | |
| aria_log_file_size | 1073741824 | |
| aria_log_purge_type | immediate | |
| aria_max_sort_file_size | 9223372036853727232 | |
| aria_page_checksum | ON | |
| aria_pagecache_age_threshold | 300 | |
| aria_pagecache_buffer_size | 134217728 | |
| aria_pagecache_division_limit | 100 | |
| aria_recover | NORMAL | |
| aria_repair_threads | 1 | |
| aria_sort_buffer_size | 134217728 | |
| aria_stats_method | nulls_unequal | |
| aria_sync_log_dir | NEWFILE | |
| aria_used_for_temp_tables | ON | |
| auto_increment_increment | 2 | |
| auto_increment_offset | 2 | |
| autocommit | ON | |
| automatic_sp_privileges | ON | |
| back_log | 50 | |
| basedir | /usr | |
| big_tables | OFF | |
| binlog_annotate_row_events | OFF | |
| binlog_cache_size | 32768 | |
| binlog_checksum | NONE | |
| binlog_direct_non_transactional_updates | OFF | |
| binlog_format | MIXED | |
| binlog_optimize_thread_scheduling | ON | |
| binlog_stmt_cache_size | 32768 | |
| bulk_insert_buffer_size | 1048576 | |
| character_set_client | latin1 | |
| character_set_connection | latin1 | |
| character_set_database | latin1 | |
| character_set_filesystem | binary | |
| character_set_results | latin1 | |
| character_set_server | latin1 | |
| character_set_system | utf8 | |
| character_sets_dir | /usr/share/mysql/charsets/ | |
| collation_connection | latin1_swedish_ci | |
| collation_database | latin1_swedish_ci | |
| collation_server | latin1_swedish_ci | |
| completion_type | NO_CHAIN | |
| concurrent_insert | ALWAYS | |
| connect_timeout | 5 | |
| datadir | /var/lib/mysql/ | |
| date_format | %Y-%m-%d | |
| datetime_format | %Y-%m-%d %H:%i:%s | |
| deadlock_search_depth_long | 15 | |
| deadlock_search_depth_short | 4 | |
| deadlock_timeout_long | 50000000 | |
| deadlock_timeout_short | 10000 | |
| debug_no_thread_alarm | OFF | |
| default_storage_engine | InnoDB | |
| default_week_format | 0 | |
| delay_key_write | ON | |
| delayed_insert_limit | 100 | |
| delayed_insert_timeout | 300 | |
| delayed_queue_size | 1000 | |
| div_precision_increment | 4 | |
| engine_condition_pushdown | OFF | |
| event_scheduler | OFF | |
| expensive_subquery_limit | 100 | |
| expire_logs_days | 3 | |
| extra_max_connections | 1 | |
| extra_port | 0 | |
| flush | OFF | |
| flush_time | 0 | |
| foreign_key_checks | ON | |
| ft_boolean_syntax | + -><()~*:""& | |
| ft_max_word_len | 84 | |
| ft_min_word_len | 4 | |
| ft_query_expansion_limit | 20 | |
| ft_stopword_file | (built-in) | |
| general_log | OFF | |
| general_log_file | greeneggs.log | |
| group_concat_max_len | 1024 | |
| have_compress | YES | |
| have_crypt | YES | |
| have_csv | YES | |
| have_dynamic_loading | YES | |
| have_geometry | YES | |
| have_innodb | YES | |
| have_ndbcluster | NO | |
| have_openssl | DISABLED | |
| have_partitioning | YES | |
| have_profiling | YES | |
| have_query_cache | YES | |
| have_rtree_keys | YES | |
| have_ssl | DISABLED | |
| have_symlink | YES | |
| hostname | greeneggs.lentz.com.au | |
| ignore_builtin_innodb | OFF | |
| ignore_db_dirs | ||
| init_connect | ||
| init_file | ||
| init_slave | ||
| innodb_adaptive_flushing | ON | |
| innodb_adaptive_flushing_method | estimate | |
| innodb_adaptive_hash_index | ON | |
| innodb_adaptive_hash_index_partitions | 1 | |
| innodb_additional_mem_pool_size | 8388608 | |
| innodb_autoextend_increment | 8 | |
| innodb_autoinc_lock_mode | 1 | |
| innodb_blocking_buffer_pool_restore | OFF | |
| innodb_buffer_pool_instances | 1 | |
| innodb_buffer_pool_populate | OFF | |
| innodb_buffer_pool_restore_at_startup | 600 | |
| innodb_buffer_pool_shm_checksum | ON | |
| innodb_buffer_pool_shm_key | 0 | |
| innodb_buffer_pool_size | 268435456 | |
| innodb_change_buffering | all | |
| innodb_checkpoint_age_target | 0 | |
| innodb_checksums | ON | |
| innodb_commit_concurrency | 0 | |
| innodb_concurrency_tickets | 500 | |
| innodb_corrupt_table_action | assert | |
| innodb_data_file_path | ibdata1:10M:autoextend | |
| innodb_data_home_dir | ||
| innodb_dict_size_limit | 0 | |
| innodb_doublewrite | ON | |
| innodb_doublewrite_file | ||
| innodb_fake_changes | OFF | |
| innodb_fast_checksum | OFF | |
| innodb_fast_shutdown | 1 | |
| innodb_file_format | Antelope | |
| innodb_file_format_check | ON | |
| innodb_file_format_max | Antelope | |
| innodb_file_per_table | ON | |
| innodb_flush_log_at_trx_commit | 1 | |
| innodb_flush_method | O_DIRECT | |
| innodb_flush_neighbor_pages | area | |
| innodb_force_load_corrupted | OFF | |
| innodb_force_recovery | 0 | |
| innodb_ibuf_accel_rate | 100 | |
| innodb_ibuf_active_contract | 1 | |
| innodb_ibuf_max_size | 134201344 | |
| innodb_import_table_from_xtrabackup | 0 | |
| innodb_io_capacity | 1000 | |
| innodb_kill_idle_transaction | 0 | |
| innodb_large_prefix | OFF | |
| innodb_lazy_drop_table | 0 | |
| innodb_lock_wait_timeout | 50 | |
| innodb_locking_fake_changes | ON | |
| innodb_locks_unsafe_for_binlog | OFF | |
| innodb_log_block_size | 512 | |
| innodb_log_buffer_size | 4194304 | |
| innodb_log_file_size | 52428800 | |
| innodb_log_files_in_group | 2 | |
| innodb_log_group_home_dir | ./ | |
| innodb_max_bitmap_file_size | 104857600 | |
| innodb_max_changed_pages | 1000000 | |
| innodb_max_dirty_pages_pct | 75 | |
| innodb_max_purge_lag | 0 | |
| innodb_merge_sort_block_size | 1048576 | |
| innodb_mirrored_log_groups | 1 | |
| innodb_old_blocks_pct | 37 | |
| innodb_old_blocks_time | 0 | |
| innodb_open_files | 400 | |
| innodb_page_size | 16384 | |
| innodb_print_all_deadlocks | OFF | |
| innodb_purge_batch_size | 20 | |
| innodb_purge_threads | 1 | |
| innodb_random_read_ahead | OFF | |
| innodb_read_ahead | linear | |
| innodb_read_ahead_threshold | 56 | |
| innodb_read_io_threads | 2 | |
| innodb_recovery_stats | OFF | |
| innodb_recovery_update_relay_log | OFF | |
| innodb_replication_delay | 0 | |
| innodb_rollback_on_timeout | OFF | |
| innodb_rollback_segments | 128 | |
| innodb_show_locks_held | 10 | |
| innodb_show_verbose_locks | 0 | |
| innodb_spin_wait_delay | 6 | |
| innodb_stats_auto_update | 1 | |
| innodb_stats_method | nulls_equal | |
| innodb_stats_on_metadata | ON | |
| innodb_stats_sample_pages | 8 | |
| innodb_stats_update_need_lock | 1 | |
| innodb_strict_mode | OFF | |
| innodb_support_xa | ON | |
| innodb_sync_spin_loops | 30 | |
| innodb_table_locks | ON | |
| innodb_thread_concurrency | 0 | |
| innodb_thread_concurrency_timer_based | OFF | |
| innodb_thread_sleep_delay | 10000 | |
| innodb_track_changed_pages | OFF | |
| innodb_use_atomic_writes | OFF | |
| innodb_use_fallocate | OFF | |
| innodb_use_global_flush_log_at_trx_commit | ON | |
| innodb_use_native_aio | ON | |
| innodb_use_sys_malloc | ON | |
| innodb_use_sys_stats_table | OFF | |
| innodb_version | 5.5.32-MariaDB-30.2 | |
| innodb_write_io_threads | 2 | |
| interactive_timeout | 28800 | |
| join_buffer_size | 131072 | |
| join_buffer_space_limit | 2097152 | |
| join_cache_level | 2 | |
| keep_files_on_create | OFF | |
| key_buffer_size | 8388608 | |
| key_cache_age_threshold | 300 | |
| key_cache_block_size | 1024 | |
| key_cache_division_limit | 100 | |
| key_cache_segments | 0 | |
| large_files_support | ON | |
| large_page_size | 0 | |
| large_pages | OFF | |
| lc_messages | en_US | |
| lc_messages_dir | /usr/share/mysql | |
| lc_time_names | en_US | |
| license | GPL | |
| local_infile | ON | |
| lock_wait_timeout | 31536000 | |
| locked_in_memory | OFF | |
| log | OFF | |
| log_bin | ON | |
| log_bin_trust_function_creators | OFF | |
| log_error | ||
| log_output | FILE | |
| log_queries_not_using_indexes | ON | |
| log_slave_updates | ON | |
| log_slow_filter | admin,filesort,filesort_on_disk,full_join,full_scan,query_cache,query_cache_miss,tmp_table,tmp_table_on_disk | |
| log_slow_queries | ON | |
| log_slow_rate_limit | 1 | |
| log_slow_verbosity | query_plan | |
| log_warnings | 2 | |
| long_query_time | 3.000000 | |
| low_priority_updates | OFF | |
| lower_case_file_system | OFF | |
| lower_case_table_names | 0 | |
| master_verify_checksum | OFF | |
| max_allowed_packet | 16777216 | |
| max_binlog_cache_size | 18446744073709547520 | |
| max_binlog_size | 104857600 | |
| max_binlog_stmt_cache_size | 18446744073709547520 | |
| max_connect_errors | 10 | |
| max_connections | 100 | |
| max_delayed_threads | 20 | |
| max_error_count | 64 | |
| max_heap_table_size | 16777216 | |
| max_insert_delayed_threads | 20 | |
| max_join_size | 18446744073709551615 | |
| max_length_for_sort_data | 1024 | |
| max_long_data_size | 16777216 | |
| max_prepared_stmt_count | 16382 | |
| max_relay_log_size | 0 | |
| max_seeks_for_key | 4294967295 | |
| max_sort_length | 1024 | |
| max_sp_recursion_depth | 0 | |
| max_tmp_tables | 32 | |
| max_user_connections | 0 | |
| max_write_lock_count | 4294967295 | |
| metadata_locks_cache_size | 1024 | |
| min_examined_row_limit | 0 | |
| mrr_buffer_size | 262144 | |
| multi_range_count | 256 | |
| myisam_block_size | 1024 | |
| myisam_data_pointer_size | 6 | |
| myisam_max_sort_file_size | 9223372036853727232 | |
| myisam_mmap_size | 18446744073709551615 | |
| myisam_recover_options | BACKUP,QUICK | |
| myisam_repair_threads | 1 | |
| myisam_sort_buffer_size | 536870912 | |
| myisam_stats_method | nulls_unequal | |
| myisam_use_mmap | OFF | |
| net_buffer_length | 16384 | |
| net_read_timeout | 30 | |
| net_retry_count | 10 | |
| net_write_timeout | 60 | |
| old | OFF | |
| old_alter_table | OFF | |
| old_passwords | OFF | |
| open_files_limit | 2159 | |
| optimizer_prune_level | 1 | |
| optimizer_search_depth | 62 | |
| optimizer_switch | index_merge=on,index_merge_union=on,index_merge_sort_union=on,index_merge_intersection=on,index_merge_sort_intersection=off,engine_condition_pushdown=off,index_condition_pushdown=on,derived_merge=on,derived_with_keys=on,firstmatch=on,loosescan=on,materialization=on,in_to_exists=on,semijoin=on,partial_match_rowid_merge=on,partial_match_table_scan=on,subquery_cache=on,mrr=off,mrr_cost_based=off,mrr_sort_keys=off,outer_join_with_cache=on,semijoin_with_cache=on,join_cache_incremental=on,join_cache_hashed=on,join_cache_bka=on,optimize_join_buffer_size=off,table_elimination=on,extended_keys=off | |
| performance_schema | OFF | |
| performance_schema_events_waits_history_long_size | 10000 | |
| performance_schema_events_waits_history_size | 10 | |
| performance_schema_max_cond_classes | 80 | |
| performance_schema_max_cond_instances | 1000 | |
| performance_schema_max_file_classes | 50 | |
| performance_schema_max_file_handles | 32768 | |
| performance_schema_max_file_instances | 10000 | |
| performance_schema_max_mutex_classes | 200 | |
| performance_schema_max_mutex_instances | 1000000 | |
| performance_schema_max_rwlock_classes | 30 | |
| performance_schema_max_rwlock_instances | 1000000 | |
| performance_schema_max_table_handles | 100000 | |
| performance_schema_max_table_instances | 50000 | |
| performance_schema_max_thread_classes | 50 | |
| performance_schema_max_thread_instances | 1000 | |
| pid_file | /var/run/mysqld/mysqld.pid | |
| plugin_dir | /usr/lib/mysql/plugin/ | |
| plugin_maturity | unknown | |
| port | 3306 | |
| preload_buffer_size | 32768 | |
| profiling | OFF | |
| profiling_history_size | 15 | |
| progress_report_time | 56 | |
| protocol_version | 10 | |
| query_alloc_block_size | 8192 | |
| query_cache_limit | 131072 | |
| query_cache_min_res_unit | 4096 | |
| query_cache_size | 33554432 | |
| query_cache_strip_comments | OFF | |
| query_cache_type | ON | |
| query_cache_wlock_invalidate | OFF | |
| query_prealloc_size | 8192 | |
| range_alloc_block_size | 4096 | |
| read_buffer_size | 1048576 | |
| read_only | ON | |
| read_rnd_buffer_size | 524288 | |
| relay_log | ||
| relay_log_index | ||
| relay_log_info_file | relay-log.info | |
| relay_log_purge | ON | |
| relay_log_recovery | OFF | |
| relay_log_space_limit | 0 | |
| replicate_annotate_row_events | OFF | |
| replicate_do_db | ||
| replicate_do_table | ||
| replicate_events_marked_for_skip | replicate | |
| replicate_ignore_db | ||
| replicate_ignore_table | peoplesforum.cache | |
| replicate_wild_do_table | ||
| replicate_wild_ignore_table | peoplesforum.cache% | |
| report_host | greeneggs | |
| report_password | ||
| report_port | 3306 | |
| report_user | ||
| rowid_merge_buff_size | 8388608 | |
| rpl_recovery_rank | 0 | |
| secure_auth | OFF | |
| secure_file_priv | ||
| server_id | 12302 | |
| skip_external_locking | ON | |
| skip_name_resolve | ON | |
| skip_networking | OFF | |
| skip_show_database | OFF | |
| slave_compressed_protocol | OFF | |
| slave_exec_mode | STRICT | |
| slave_load_tmpdir | /tmp | |
| slave_max_allowed_packet | 1073741824 | |
| slave_net_timeout | 3600 | |
| slave_skip_errors | 1062 | |
| slave_sql_verify_checksum | ON | |
| slave_transaction_retries | 10 | |
| slave_type_conversions | ||
| slow_launch_time | 2 | |
| slow_query_log | ON | |
| slow_query_log_file | /var/log/mysql/mariadb-slow.log | |
| socket | /var/run/mysqld/mysqld.sock | |
| sort_buffer_size | 262144 | |
| sql_auto_is_null | OFF | |
| sql_big_selects | ON | |
| sql_big_tables | OFF | |
| sql_buffer_result | OFF | |
| sql_log_bin | ON | |
| sql_log_off | OFF | |
| sql_low_priority_updates | OFF | |
| sql_max_join_size | 18446744073709551615 | |
| sql_mode | NO_ENGINE_SUBSTITUTION | |
| sql_notes | ON | |
| sql_quote_show_create | ON | |
| sql_safe_updates | OFF | |
| sql_select_limit | 18446744073709551615 | |
| sql_slave_skip_counter | 0 | |
| sql_warnings | OFF | |
| ssl_ca | ||
| ssl_capath | ||
| ssl_cert | ||
| ssl_cipher | ||
| ssl_key | ||
| storage_engine | InnoDB | |
| stored_program_cache | 256 | |
| sync_binlog | 3 | |
| sync_frm | ON | |
| sync_master_info | 0 | |
| sync_relay_log | 0 | |
| sync_relay_log_info | 0 | |
| system_time_zone | UTC | |
| table_definition_cache | 400 | |
| table_open_cache | 1024 | |
| thread_cache_size | 128 | |
| thread_concurrency | 10 | |
| thread_handling | one-thread-per-connection | |
| thread_pool_idle_timeout | 60 | |
| thread_pool_max_threads | 500 | |
| thread_pool_oversubscribe | 3 | |
| thread_pool_size | 8 | |
| thread_pool_stall_limit | 500 | |
| thread_stack | 294912 | |
| time_format | %H:%i:%s | |
| time_zone | SYSTEM | |
| timed_mutexes | OFF | |
| tmp_table_size | 16777216 | |
| tmpdir | /tmp | |
| transaction_alloc_block_size | 8192 | |
| transaction_prealloc_size | 4096 | |
| tx_isolation | REPEATABLE-READ | |
| unique_checks | ON | |
| updatable_views_with_limit | YES | |
| userstat | OFF | |
| version | 5.5.32-MariaDB-1~wheezy-log | |
| version_comment | mariadb.org binary distribution | |
| version_compile_machine | x86_64 | |
| version_compile_os | debian-linux-gnu | |
| wait_timeout | 600 |
I'm planning on doing a debug build from MDEV-572 and maybe try to get valgrind to narrow it down (if that doesn't bring the server to a total halt). Better suggestions welcome.
Attachments


Activity
| Field | Original Value | New Value |
|---|---|---|
| Assignee | Elena Stepanova [ elenst ] |
> Could you please specify the replication topology you are using?
Two servers, both masters to each other, both slaves of each other.
> how come are you using a Wheezy package on Squeeze?
Was in error. Am using a wheezy package on wheezy.
| Environment |
Debian Squeeze x86_64 Linux greeneggs.lentz.com.au 3.9.3-x86_64-linode33 #1 SMP Mon May 20 10:22:57 EDT 2013 x86_64 GNU/Linux |
Debian Wheezy x86_64 Linux greeneggs.lentz.com.au 3.9.3-x86_64-linode33 #1 SMP Mon May 20 10:22:57 EDT 2013 x86_64 GNU/Linux |
valgrind output of mysqld running under load for about an hour.
If you want me to run with other valgrind options let me know.
| Attachment | valgrind.mysqld.27336 [ 23400 ] |
Hi Daniel,
Can you share any information in regard to SELECTs that you're using? Even better if there's also information about the data structures.
Thanks.
Elena, I don't see relevance for that request. And it's unpractical.
First of all, it could be any query (including INSERT, UPDATE, DELETE as well as DDL) or any other activity in the server that leaks - so in that sense, only a full general query log output could possibly be of any help. However, it's more likely to just provide a large pile of relatively useless data.
We're not discussing a single instance where some queries cause a problem, this system is merely where we've specifically put instrumentation in place to track down the problem that we've seen in a couple of systems. These systems have pretty much nothing in common in terms of applications that run on them, so from that angle also I don't think it's relevant.
I would think that the Valgrind output should provide a good lead when it comes to memory leaks?
A related question, can you please confirm whether the build team runs the testsuite on a Valgrind build for each release? This used to be done but given the issue with the memory leak in 5.5.31 I'd just like to make sure. Thanks
Arjen,
There is obvious relevance though.
The valgrind errors that Daniel provided indicate that the memory loss happens on SELECTs, apparently on SELECTs with subqueries and/or joins. Usually when it happens, it happens in some specific circumstances (the query structure, the data structure). I am running a big general set of tests with valgrind over the last couple of days, and it might (or might not) catch the problem at the end, but that's impractical for solving this particular problem in the limited time before 5.5.33 release. It would be much faster and more efficient if Daniel was able to provide any information in regard to the queries that he actually uses that might fit the valgrind errors he caught, so I could narrow down the test and hit the error faster.
For the question about valgrind and MTR, yes, I confirm that the team runs the test suite on a Valgrind build for each release (for each push, for that matter). You can see it as "work-amd64-valgrind" builder results on the buildbot page.
The db is doing about 60 selects per second across 40 databases with a fair diversity of code on it. The last trackback identified 20 in ~40mins so is still a large dataset to filter.
I was playing with the following in an init script and having the general log running. Was hoping that --vgdb=yes --vgdb-error=1 would freeze activity (waiting for debugger) in the general log leaving an offending query somewhere near the end of the general log. Any other ideas?
/usr/bin/valgrind --leak-check=full --read-var-info=yes --undef-value-errors=no --trace-children=yes --trace-children-skip='/cut,/wc,/grep,/date,/dirname,/expr,/logger,/rm,/my_print_defaults,/sed' --log-file=/tmp/valgrind.mysqld.%p --vgdb=yes --vgdb-error=1 \
/usr/bin/mysqld_safe "${@:2}" > /dev/null 2>&1 &
note: --undef-value-errors=no is a big cpu saver
> Was hoping that --vgdb=yes --vgdb-error=1
Didn't work. Compiling valgrind from source with the --error-limit at 1 (./coregrind/m_errormgr.c M_COLLECT_NO_ERRORS_AFTER_FOUND=1 (not 10,000,000)).
Hi Elena - tnx for that info, good to hear.
As Dan indicated, we're trying to narrow things down as it's too many schemas and queries on this server.
At this point I'd take whatever I could get. If I understand correctly, Daniel's run with valgrind also had general log enabled, is it so? If it is, would it be possible for me to see that general log? 60 selects per second in an hour-long test run is not that bad, I could actually go through the log to see what it has that my tests don't and proceed from there.
Elena - k can do. might have to make that a private upload.
Will leave the practical side of that to Dan to work out.
Hi Daniel,
Could you please try another thing: turn off index_merge* switches in the optimizer_switch (globally) and see if it makes the problem go away? It might or might not, depending on which queries cause the leak. According to Sergei Petrunia's analysis, it's either queries that use index_merge, or queries with GROUP BY and/or ORDER BY (and join, of course). The latter is not very helpful, because there are a huge number of queries with ORDER BY in the flow; so it's easier to check the index_merge theory first.
Ok. Have set index_merge*=off on the non-valgrind running server to see if there's a leak globally. Will run this under valgrind if there proves to be a leak or tomorrow.
before:
| optimizer_switch | index_merge=on,index_merge_union=on,index_merge_sort_union=on,index_merge_intersection=on,index_merge_sort_intersection=off,engine_condition_pushdown=off,index_condition_pushdown=on,derived_merge=on,derived_with_keys=on,firstmatch=on,loosescan=on,materialization=on,in_to_exists=on,semijoin=on,partial_match_rowid_merge=on,partial_match_table_scan=on,subquery_cache=on,mrr=off,mrr_cost_based=off,mrr_sort_keys=off,outer_join_with_cache=on,semijoin_with_cache=on,join_cache_incremental=on,join_cache_hashed=on,join_cache_bka=on,optimize_join_buffer_size=off,table_elimination=on,extended_keys=off |
-------------------------------------------------------------------------------------------------------------------------------------------------------------------------------------------------------------------------------------------------------------------------------------------------------------------------------------------------------------------------------------------------------------------------------------------------------------------------------------------------------------------------------------------------------------------------------------------------------------------------------------+
1 row in set (0.00 sec)
after:
MariaDB [(none)]> set global optimizer_switch='index_merge=off,index_merge_union=off,index_merge_sort_union=off,index_merge_intersection=off,index_merge_sort_intersection=off,engine_condition_pushdown=off,index_condition_pushdown=on,derived_merge=on,derived_with_keys=on,firstmatch=on,loosescan=on,materialization=on,in_to_exists=on,semijoin=on,partial_match_rowid_merge=on,partial_match_table_scan=on,subquery_cache=on,mrr=off,mrr_cost_based=off,mrr_sort_keys=off,outer_join_with_cache=on,semijoin_with_cache=on,join_cache_incremental=on,join_cache_hashed=on,join_cache_bka=on,optimize_join_buffer_size=off,table_elimination=on,extended_keys=off';
Query OK, 0 rows affected (0.01 sec)
| Attachment | catinthehat_memory-day_no_indexmerge.png [ 23402 ] |
Thanks, Daniel.
That's bad news, since my next attempts to reproduce it over the weekend (now by populating your schema with some random values and re-running the entire general log) also didn't hit the problem.
I'll think what else to do.
My thoughts are to get this arcane patch compiled and try to view the datastructure ( https://bugs.kde.org/show_bug.cgi?id=108905 ) to give a clue or write a patch on valgrind to record the allocation time of memory and try to correlate it that way.
Hi Daniel,
To make sure I build server the same way you do (I mean the valgrind one) – how do you build it?
Also, was there anything suspicious at all in the error log?
Maybe you could use valgrind massif?
http://www.mysqlperformanceblog.com/2013/01/09/profiling-mysql-memory-usage-with-valgrind-massif/
The valgrind I've used so far has just been the debian packaged valgrind. I did end up compling a valgrind-3.8.1 with a basic ./configure && make && sudo make install
Mariadb was fairly standard:
apt-get build-dep mariadb-5.5
apt-get install cmake libaio1 libaio-dev fakeroot valgrind
apt-get source mariadb-5.5
cd mariadb-5.5*
edited debian/control and debian/rules as per https://kb.askmonty.org/en/how-to-produce-a-full-stack-trace-for-mysqld-the-mariadb-server/#comment_359 (except using 5.5 as version number)
edit debian/rules added -DCMAKE_BUILD_TYPE=Debug to cmake as per https://kb.askmonty.org/en/compiling-mariadb-for-debugging/
dpkg-buildpackage -nc -us -uc (http://www.debian.org/doc/manuals/maint-guide/build.en.html)
dpkg -i
edit /etc/init.d/mysql to contain
/usr/local/bin/valgrind --leak-check=full --read-var-info=yes --undef-value-errors=no --trace-children=yes --trace-children-skip='/cut,/wc,/grep,/date,/dirname,/expr,/logger,/rm,/my_print_defaults,/sed' --log-file=/tmp/valgrind.mysqld.%p --time-stamp=yes \
before the mysqld_safe line
Thanks for the link Patryk - I had seen this before but dismissed it as not enough. Given what I have currently I'll take another look.
massiff output pushed to MDEV-4974_2.tar.gz ftp://ftp.askmonty.org/private/
I've yet to look at it myself. On irc if you have any requests
MDEV-4974_3.tar.gz added - threshold lowered and configured to do millisecond offsets
the mysqld was started with general log active and this is included the tarball
ok. I've looked through the massif logs. They don't have a sample snapshot/backtrace the same as the memcheck one so the ones so far aren't that much use.
They do however produce a have a time on the snapshot that can be correlated with the general query log.
I may just need to run the massif long enough to get the snapshot (though I'm thinking this is still a low probability of a hit).
More realistic could tigger debug messages (or some gdb events) to obtain timings at one of the following locations to correlate with the general query log:
==7763== by 0x6BFE55: init_read_record(READ_RECORD*, THD*, TABLE*, SQL_SELECT*, int, bool, bool) (records.cc:595)
==7763== by 0x4D236F: join_init_read_record(st_join_table*) (sql_select.cc:17203)
==7763== by 0x4C25D0: sub_select(JOIN*, st_join_table*, bool) (sql_select.cc:16329)
That's right, I also saw that there was no this specific one in init_read_record; but there was something in evaluate_join_record instead. Sergei Petrunia is going to take a look at the output to see if it's relevant to the initial memory leak problem.
I've been reading up on https://sourceware.org/gdb/onlinedocs/gdb.html#Tracepoints
I've compiled userspace-rcu-0.5.3/ust-0.11 and built gdbserver (gdb/gdbserver with ./configure --with-ust=/usr/local ).
In record.cc added the following after the existing includes (duplicate and seemingly equivalent defs occurred for likely/unlikely)
#undef unlikely
#undef likely
#include <ust/marker.h>
inside the existing if (! init_rr_cache(thd, info) braces added:
/* is there something more I should be capturing? - text representation of query? or execution plan? */
trace_mark(record,init_read_record,"TIME: %lld ALLOC: %p", (long long int) thd->start_time, info->cache);
configure.cmake
MY_SEARCH_LIBS(marker_probe_cb ust LIBUST)
MY_SEARCH_LIBS(rcu_read_lock urcu-bp LIBURCUBP)
and appending ${LIBUST} ${LIBURCUBP} to then end of CMAKE_REQUIRED_LIBRARIES
Unfortunately is currently not linking with the following error:
.../.libmysqld.a/(libmysqld.arecords.cc.o()libmysqld.arecords.cc.o![]() ()_markersrecords.cc.o+:0x20)()::_markers (+0x20): __markersundefined+0x20)undefined: undefined reference reference to `marker_probe_cb'to
()_markersrecords.cc.o+:0x20)()::_markers (+0x20): __markersundefined+0x20)undefined: undefined reference reference to `marker_probe_cb'to
../libmysqld.a(records.cc.o`)marker_probe_cb'
:libmysqld.a(__markers+0x28(): undefined records.cc.o reference) :reference(to __markers to+` __mark_empty_function0x28'`
)marker_probe_cb:'
undefined. .reference/ libmysqld.ato( records.cc.o`)__mark_empty_function:'(
_markers+0x28): undefined reference to `_mark_empty_function'
tips on debugging this welcome but haven't spent much time on this.
next I plan to:
with gdbserver running mysqld (or the valgrind --tool=memcheck if I can)
attach gdb and try the following:
set default-collect $args,$locals,$_ret,$_sdata
strace -m record/init_read_record if select!=0 && use_record_cache==1 && print_error==1 && disable_rr_cache==FALSE;
- this restricts the calls to the join_init_read_record and join_read_record_no_init calls (of which join_init_read_record was seen in the memleak backtrace).
- if possible add to the condition $_ret == (location after the call in join_init_read_record)
tstart
- wait for collection
tstop
tfind start
while ($trace_frame != -1)
printf "Frame %d, = %08X, sdataSP = %s, ret = %08X\n", \
$trace_frame, $_sdata, $_ret
tfind
end
and correlated allocated address to memleak output, or time to general query log.
After switching from Precise to Wheezy, I've got the one in ma_checkpoint_init (which is also in your valgrind output). No those about sub_select/join_init_record yet, but it's already remarkable since i wasn't getting any at all on Precise. I'm going to re-run my other tests on Wheezy, possibly it's something system-related (valgrind version is the same on both, 3.7.0)
| Attachment | psergey-mdev4974-xpl1.diff [ 23701 ] |
Me and Elena went through the available information again, including the massif logs, and could not get any clue.
Daniel, could you try exploring with the attached patch, psergey-mdev4974-xpl1.diff ?
The patch makes the server to write a file, /tmp/leaks-track.sql. Into that file it will write, at appropriate times, statements:
insert into track_mem (query_id, ptr, query) values (%lld, %p, '%s');
delete from track_mem where query_id=%lld and ptr=%p;
insert into leaks select * from track_mem where query_id=%lld;
the idea is that one can pipe leaks-track.sql into another mysql server, and as soon as table "leaks" is not empty, it will have the query that has caused the leak.
Sergie, thanks for the patch. I have compiled, run and uploaded the result to ftp://ftp.askmonty.org/private/.
Seems to only include the insert into leaks command and no insert/delete from/into track_mem. I tried moving track_mem_alloc(thd, info->cache); before DBUG_RETURN(1); in sql/record.cc but it didn't seem to have an effect.
Assigned to Sergei Petrunia for the follow-up on the debug output.
| Assignee | Elena Stepanova [ elenst ] | Sergei Petrunia [ psergey ] |
| Fix Version/s | 5.5.35 [ 14000 ] |
| Priority | Major [ 3 ] | Critical [ 2 ] |
I've looked through 4974-leaks-track.sql and have found this:
insert into track_mem (query_id, ptr, query) values (29476, 0x7f277f242000, 'SELECT DISTINCT node.nid AS nid,
node.type AS node_type,
node.title AS node_title,
users.name AS users_name,
users.uid AS users_uid,
node_comment_statistics.comment_count AS node_comment_statistics_comment_count,
node_comment_statistics.');
This gives us something!
Btw, the above is the only such query in all the uploaded files.
- For some reason, the query text has been cut. danblack, is it possible to grep through query logs, or the app you're running and find the full query that starts with
SELECT DISTINCT node.nid AS nid,
node.type AS node_type,
node.title AS node_title,
users.name AS users_name,
users.uid AS users_uid,
node_comment_statistics.comment_count AS node_comment_statistics_comment_count,
node_comment_statistics.
(If there are multiple candidates, we would like all of them).
- When you've found the query, could you provide
- the query text (essential)
- the table DDLs for the involved tables (just as essential)
- what you get if you run EXPLAIN for the query (nice to have)
- (not essential, but nice to have) Could you start the server with the above provided patch, run the query manually, and then provide leaks-track.sql? This is to check whether the query always leaks data. If it doesn't leak data, we would still like to have query text, DDLs, etc - there are still chances I'll spot the leak.
Interesting - that looks like Drupal 6 query. Other deployments where we observed the leak don't use Drupal, but it's good to see that we can catch at least one aspect of the problem in this way. We'll find out what the full query is.
I don't see another patch?
| Attachment | drupal.sql [ 24500 ] |
'''# Time: 131121 10:35:06
- User@Host: oq-drupal[oq-drupal] @ [74.207.241.159]
- Thread_id: 1024112 Schema: oq_drupal QC_hit: No
- Query_time: 3.298782 Lock_time: 0.000182 Rows_sent: 25 Rows_examined: 224767
- Full_scan: No Full_join: No Tmp_table: Yes Tmp_table_on_disk: Yes
- Filesort: Yes Filesort_on_disk: Yes Merge_passes: 13
use oq_drupal;
SET timestamp=1385030106;
SELECT DISTINCT node.nid AS nid,
node.type AS node_type,
node.title AS node_title,
users.name AS users_name,
users.uid AS users_uid,
node_comment_statistics.comment_count AS node_comment_statistics_comment_count,
node_comment_statistics.last_comment_timestamp AS node_comment_statistics_last_comment_timestamp
FROM node node
INNER JOIN users users ON node.uid = users.uid
INNER JOIN node_comment_statistics node_comment_statistics ON node.nid = node_comment_statistics.nid
INNER JOIN node_access na ON na.nid = node.nid WHERE (na.grant_view >= 1 AND ((na.gid = 0 AND na.realm = 'all') OR (na.gid = 1 AND na.realm = 'forum_access'))) AND ( node.status = 1
)ORDER BY node_title ASC
LIMIT 16075, 25;
MariaDB [oq_drupal]> explain ^MSELECT DISTINCT node.nid AS nid,
-> node.type AS node_type,
-> node.title AS node_title,
-> users.name AS users_name,
-> users.uid AS users_uid,
-> node_comment_statistics.comment_count AS node_comment_statistics_comment_count,
-> node_comment_statistics.last_comment_timestamp AS node_comment_statistics_last_comment_timestamp
-> FROM node node
-> INNER JOIN users users ON node.uid = users.uid
-> INNER JOIN node_comment_statistics node_comment_statistics ON node.nid = node_comment_statistics.nid
-> INNER JOIN node_access na ON na.nid = node.nid WHERE (na.grant_view >= 1 AND ((na.gid = 0 AND na.realm = 'all') OR (na.gid = 1 AND na.realm = 'forum_access'))) AND ( node.status = 1
-> )ORDER BY node_title ASC
-> LIMIT 16075, 25;;
--------------------------------------------------------------------------------------------------------------------------------------------------------------------+
| id | select_type | table | type | possible_keys | key | key_len | ref | rows | Extra |
--------------------------------------------------------------------------------------------------------------------------------------------------------------------+
| 1 | SIMPLE | node | ref | PRIMARY,node_status_type,uid | node_status_type | 4 | const | 21023 | Using where; Using temporary; Using filesort |
| 1 | SIMPLE | node_comment_statistics | eq_ref | PRIMARY | PRIMARY | 4 | oq_drupal.node.nid | 1 | |
| 1 | SIMPLE | users | eq_ref | PRIMARY | PRIMARY | 4 | oq_drupal.node.uid | 1 | Using where |
| 1 | SIMPLE | na | ref | PRIMARY | PRIMARY | 4 | oq_drupal.node.nid | 1 | Using where; Distinct |
--------------------------------------------------------------------------------------------------------------------------------------------------------------------+
'''
Variants include the last ORDER by being node_comment_statistics_comment_count, user_name and some of these are DESC.
''
Don't worry - patch is still applied.
SELECT DISTINCT node.nid AS nid,
node.type AS node_type,
node.title AS node_title,
users.name AS users_name,
users.uid AS users_uid,
node_comment_statistics.comment_count AS node_comment_statistics_comment_count,
node_comment_statistics.last_comment_timestamp AS node_comment_statistics_last_comment_timestamp
FROM node node
INNER JOIN users users ON node.uid = users.uid
INNER JOIN node_comment_statistics node_comment_statistics ON node.nid = node_comment_statistics.nid
INNER JOIN node_access na ON na.nid = node.nid WHERE (na.grant_view >= 1 AND ((na.gid = 0 AND na.realm = 'all') OR (na.gid = 1 AND na.realm = 'forum_access'))) AND ( node.status = 1
)ORDER BY node_title ASC
LIMIT 16075, 25;
| Attachment | leaks-track.sql [ 24501 ] |
( cat /var/log/mysql/mariadb-slow.log.1 ; zcat /var/log/mysql/mariadb-slow.log*z ) | grep A 12 'SELECT DISTINCT node.nid AS nid' | grep -v '-$' | mysql oq_drupal
| Attachment | leaks-track-allqueries.sql [ 24502 ] |
| Attachment | allqueries.sql [ 24503 ] |
see drupal_data_MDEV4974.sql in private ftp for extracted tables relevant to these query. users data is just uid and a name in a form.
| Status | Open [ 1 ] | In Progress [ 3 ] |
Ok, I was able to repeat the leak with the provided data. Thanks a lot!
The query plan uses "Using temporary; Using filesort" and "Distinct". What that means:
1. The join is executed, and the results are put into the temporary table (Using temporary). The table has a unique key, this is how "Distinct" is achieved.
2. The temporary table is then passed to filesort(). filesort() produces an ordered stream (an IO_CACHE of rowids).
3. Then, a join (a degenerate one, a result of make_simple_join()) is run the temptable + IO_CACHE. Reading the table is initialized with
init_read_record(), which calls init_rr_cache().
4. sub_select() finishes with NESTED_LOOP_QUERY_LIMIT
5. JOIN::join_free() is invoked. it calls JOIN::cleanup(full=TRUE)
which calls free_io_cache(table). free_io_cache() frees something, but that's not what init_read_record() has allocated.
I am not sure who didn't free what init_read_record() has allocated. Will need to debug further.
Awesome Sergei, glad to hear you were able to replicate the prob using the data provided by us.
Hopefully we'll see the final find soon!
One question that will of course be interesting to know the answer to is when and where the problem was introduced.
Hey Sergei. Any luck isolating which function should free the init_read_record allocation?
Hi Daniel,
I'll need to debug to find out which part of the code fails to free the memory. This bug is at the top of my todo, but I am currently on vacation and is unable to work on it. I hope to start working on it at around Dec, 16th.
I'm glad you weren't working on it on your vacation and I hope you enjoyed yourself. If there's anything I can help with now that you're back please let me know.
The EXPLAIN is:
-------------------------..-----------------------------------------------------------------------+
| table | type | .. | key | key_len | ref | rows | Extra |
-------------------------..-----------------------------------------------------------------------+
| node | ref | .. | node_status_type | 4 | const | 20926 | Using where; Using temporary; Using filesort |
| users | eq_ref | .. | PRIMARY | 4 | node.uid | 1 | Using where |
| node_comment_statistics | eq_ref | .. | PRIMARY | 4 | node.nid | 1 | |
| na | ref | .. | PRIMARY | 4 | node.nid | 1 | Using where; Distinct |
-------------------------..-----------------------------------------------------------------------+
It means, execution proceeds as follows:
1. Execute the join of 4 tables.
2. Put join output into a temporary table with TABLE::distinct=1. This resolves the SELECT .. DISTINCT part of the query.
3. Pass the temporary table to filesort.
4. filesort() will produce "record pointers" (that is, an array of rowids in the temporary table)
5. then, use that array to read first LIMIT rows in disk order.
(the above is valid for both MariaDB and MySQL)
MySQL code traditionally had a weak spot. On step #1, JOIN::join_tab referred to the original base tables (node, users, node_comment_statistics, na). Before step #5, the executor would set JOIN::join_tab to point to an array of one element, with temptable created on step#2. The original array was gone, though, which caused problems for EXPLAIN and didn't allow to implement SHOW EXPLAIN (or EXPLAIN FOR CONNECTION).
MariaDB has solved this problem in the following cset:
timour@askmonty.org-20120821122443-ut07mf3z3194ch5d
5.5-md447
Fix bug mdev-447: Wrong output from the EXPLAIN command of the test case for lp bug #714999
The fix backports from MWL#182: Explain running statements the logic that
saves the original JOIN_TAB array of a query plan after optimization. This
array is later used during EXPLAIN to iterate over the original JOIN plan
nodes in the cases when this plan could be changed by early subquery
execution during the optimization phase of the outer query.
The idea of the fix was to have two JOIN_TAB arrays (grep for WALK_OPTIMIZATION_TABS and WALK_EXECUTION_TABS). However, we have introduced this bug - we don't call JOIN_TAB::cleanup() for the JOIN_TAB that reads from the temp. table. This works typically (most query plans will just read the temp. table). However, when reading from temporary table employs init_rr_cache() and rr_from_cache() functions, one must free the cache afterwards. MariaDB didn't do this, which caused this bug.
I suspect, MySQL 5.6 also faced this problem. They have made this change:
evgeny.potemkin@oracle.com-20120531162137-iq3wjp1dppk17syi
WL#6071: Inline tmp tables into the nested loops algorithm.
they don't create two JOIN_TAB arrays. Instead, they extend the original join_tab array, and put the join_tab element that reads from temp.table at the very end of that array. I'm not sure which approach is better (WL#6071 is not public, so I need to guess about Evgen's reasoning) but one consequence is that MySQL 5.6 does not have an analog of this bug.
This fix makes the leak go away. I think, it needs a round of testing, the join cleanup area doesnt have a clear architecture so I could be missing something.
| Attachment | psergey-fix-mdev4954.diff [ 25600 ] |
Elena, could you please test 5.5 tree, patched with psergey-fix-mdev4954.diff ?
The first round of tests went well, running the next one, now with valgrind.
Although, I am still to try to figure out why the bug itself was not triggered by regular tests. We have DISTINCTs, and joins, and ORDER BYs, and LIMIT, and various combinations of those.
| Assignee | Sergei Petrunia [ psergey ] | Oleksandr Byelkin [ sanja ] |
The patch is OK to push.
I 100% sure that I already faced problem of non-cleanup table_access_tabs (you even found flaw in my firat patch), but I can't find results (probably it was not pushed or passed to you).
| Assignee | Oleksandr Byelkin [ sanja ] | Sergei Petrunia [ psergey ] |
Fix pushed into 5.5 tree (I have made a smaller testcase that could be included into mysql-test).
Daniel, thanks a lot for reporting this, and for all the input that allowed us to pin down and fix the problem!
| Resolution | Fixed [ 1 ] | |
| Status | In Progress [ 3 ] | Closed [ 6 ] |
Thanks Sergei, Sanja, and Elena for the fix. Looking forward to a DB that doesn't leak memory and all the other cool stuff and fixes you've done over last months (and years really).
http://bazaar.launchpad.net/~maria-captains/maria/5.5/revision/4013
Here is the smallest test case based on Daniel's data that I could come up so far. Sergei, could you please take a look and if it is good enough, use it as a bugfix test case (I checked that the valgrind error it causes disappeared after the bugfix, but I'm not sure it's the main target problem and not just a side-effect).
CREATE TABLE t1 (a VARCHAR(32000) DEFAULT '', b VARCHAR(32000), id INT);
INSERT INTO t1 (b, id) VALUES
('t1',2), ('t2',1),('t3',2),('t4',1),('t5',2),('t6',1),('t7',2),('t8',1),
('t9',2),('t10',1),('t11',2),('t12',1),('t13',2),('t14',1),('t15',2),('t16',1),
('t17',2),('t18',1),('t19',2),('t20',1),('t21',2),('t22',1),('t23',2),('t24',1),
('t25',2),('t26',1),('t27',2),('t28',1),('t29',2),('t30',1),('t31',2),('t32',1),
('t33',2),('t34',1),('t35',2),('t36',1),('t37',2),('t38',1),('t39',2),('t40',1),
('t41',2),('t42',1),('t43',2),('t44',1),('t45',2),('t46',1),('t47',2),('t48',1),
('t49',2),('t50',1),('t51',2),('t52',1),('t53',2),('t54',1),('t55',2),('t56',1),
('t57',2),('t58',1),('t59',2),('t60',1),('t61',2),('t62',1),('t63',2),('t64',1),
('t65',2),('t66',1),('t67',2),('t68',1),('t69',2),('t70',1),('t71',2),('t72',1),
('t73',2),('t74',1),('t75',2),('t76',1),('t77',2),('t78',1),('t79',2),('t80',1),
('t81',2),('t82',1),('t83',2),('t84',1),('t85',2),('t86',1),('t87',2),('t88',1),
('t89',2),('t90',1),('t91',2),('t92',1),('t93',2),('t94',1),('t95',2),('t96',1),
('t97',2),('t98',1),('t99',2),('t100',1),('t101',2),('t102',1),('t103',2),
('t104',1),('t105',2),('t106',1),('t107',2),('t108',1),('t109',2),('t110',1),
('t111',2),('t112',1),('t113',2),('t114',1),('t115',2),('t116',1),('t117',2),
('t118',1),('t119',2),('t120',1),('t121',2),('t122',1),('t123',2),('t124',1),
('t125',2),('t126',1),('t127',2),('t128',1),('t129',2),('t130',1),('t131',2),
('t132',1),('t133',2),('t134',1),('t135',2),('t136',1),('t137',2),('t138',1),
('t139',2),('t140',1),('t141',2),('t142',1),('t143',2),('t144',1),('t145',2),
('t146',1),('t147',2),('t148',1),('t149',2),('t150',1),('t151',2),('t152',1),
('t153',2),('t154',1),('t155',2),('t156',1),('t157',2),('t158',1),('t159',2),
('t160',1),('t161',2),('t162',1),('t163',2),('t164',1),('t165',2),('t166',1),
('t167',2),('t168',1),('t169',2),('t170',1),('t171',2),('t172',1),('t173',2),
('t174',1),('t175',2),('t176',1),('t177',2),('t178',1),('t179',2),('t180',1),
('t181',2),('t182',1),('t183',2),('t184',1),('t185',2),('t186',1),('t187',2),
('t188',1),('t189',2),('t190',1),('t191',2),('t192',1),('t193',2),('t194',1),
('t195',2),('t196',1),('t197',2),('t198',1),('t199',2),('t200',1),('t201',2),
('t202',1),('t203',2),('t204',1),('t205',2),('t206',1),('t207',2),('t208',1),
('t209',2),('t210',1),('t211',2),('t212',1),('t213',2),('t214',1),('t215',2),
('t216',1),('t217',2),('t218',1),('t219',2),('t220',1),('t221',2),('t222',1),
('t223',2),('t224',1),('t225',2),('t226',1),('t227',2),('t228',1),('t229',2),
('t230',1),('t231',2),('t232',1),('t233',2),('t234',1),('t235',2),('t236',1),
('t237',2),('t238',1),('t239',2),('t240',1),('t241',2),('t242',1),('t243',2),
('t244',1),('t245',2),('t246',1),('t247',2),('t248',1),('t249',2),('t250',1),
('t251',2),('t252',1),('t253',2);
CREATE TABLE t2 (c VARCHAR(60) NOT NULL, id INT(10));
INSERT INTO t2 VALUES ('user1',1),('user2',2);
SELECT DISTINCT * FROM t1 INNER JOIN t2 ON t1.id = t2.id ORDER BY t1.b;
been running 5.5.35 for 7 hrs now and no memory leaks. It would of leaked about 100M previously.
Definitely fixed and thanks gain.
| Workflow | defaullt [ 28729 ] | MariaDB v2 [ 43957 ] |
| Workflow | MariaDB v2 [ 43957 ] | MariaDB v3 [ 63200 ] |
| Workflow | MariaDB v3 [ 63200 ] | MariaDB v4 [ 147003 ] |
Hi Daniel,
Given that it's 5.5 (hence no multi-source replication there), what exactly do you mean by multi-master? Could you please specify the replication topology you are using?
And another question, for better understanding – how come are you using a Wheezy package on Squeeze?
Thanks.