Details
-
Bug
-
Status: Confirmed (View Workflow)
-
 Major
Major
-
Resolution: Unresolved
-
10.6, 10.11, 11.4, 11.8, 12.1(EOL), 12.2(EOL)
-
Related to performance
Description
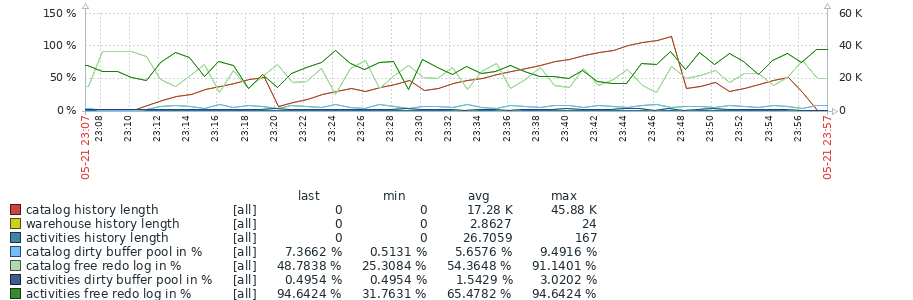
Original finding here. There is a history length regression in 10.6;
Testcase setup:
sudo apt install python3-pymysql |
Then start a fresh server instance with the following options:
--innodb_flush_method=O_DIRECT --innodb_change_buffering=none --innodb_buffer_pool_size=17179869184
|
Start a client and add this table:
CREATE TABLE `catalog` ( |
`uid` BIGINT UNSIGNED NOT NULL, |
`security_uid` INT UNSIGNED, |
`owner` varchar(255) binary NOT NULL default '', |
`viewable_owner` varchar(255) binary NOT NULL default '', |
`path` varchar(255) NOT NULL default '', |
`relative_url` varchar(255) NOT NULL default '', |
`parent_uid` BIGINT UNSIGNED default '0', |
`id` varchar(255) default '', |
`description` text,
|
`title` varchar(255) default '', |
`meta_type` varchar(255) default '', |
`portal_type` varchar(255) default '', |
`opportunity_state` varchar(255) default '', |
`corporate_registration_code` varchar(255), |
`ean13_code` varchar(255), |
`validation_state` varchar(255) default '', |
`simulation_state` varchar(255) default '', |
`causality_state` varchar(255) default '', |
`invoice_state` varchar(255) default '', |
`payment_state` varchar(255) default '', |
`event_state` varchar(255) default '', |
`immobilisation_state` varchar(255) default '', |
`reference` varchar(255) binary default '', |
`grouping_reference` varchar(255) default '', |
`grouping_date` datetime,
|
`source_reference` varchar(255) default '', |
`destination_reference` varchar(255) default '', |
`string_index` varchar(255), |
`int_index` INT, |
`float_index` real, |
`has_cell_content` bool,
|
`creation_date` datetime,
|
`modification_date` datetime,
|
`indexation_timestamp` TIMESTAMP DEFAULT CURRENT_TIMESTAMP ON UPDATE CURRENT_TIMESTAMP, |
PRIMARY KEY (`uid`), |
KEY `security_uid` (`security_uid`), |
KEY `owner` (`owner`), |
KEY `viewable_owner` (`viewable_owner`), |
KEY `Parent` (`parent_uid`), |
KEY `Path` (`path`), |
KEY `Title` (`title`), |
KEY `Reference` (`reference`), |
KEY `relative_url` (`relative_url`), |
KEY `Portal Type` (`portal_type`, `reference`), |
KEY `opportunity_state` (`opportunity_state`), |
KEY `validation_state_portal_type` (`validation_state`, `portal_type`), |
KEY `simulation_state_portal_type` (`simulation_state`, `portal_type`), |
KEY `causality_state_portal_type` (`causality_state`, `portal_type`), |
KEY `invoice_state` (`invoice_state`), |
KEY `payment_state` (`payment_state`), |
KEY `event_state` (`event_state`) |
) ENGINE=InnoDB;
|
Next find out the port of the server (ps -ef | grep $PWD | grep port or similar), and change the port = variable setting at the head of test.py, which is otherwise as follows:
import threading |
import time |
import pymysql |
import random |
|
|
host = "127.0.0.1" |
port = 10238 |
user = "root" |
password = "" |
database = "test" |
num_threads = 512 |
num_items = 2 |
query_list = [ |
[
|
"BEGIN", |
"SELECT uid, path from catalog WHERE path IN (" + ", ".join("'%s'" for _ in range(num_items)) + ")", |
"SELECT uid, path from catalog WHERE uid IN (" + ", ".join("%s" for _ in range(num_items)) + ")", |
"REPLACE INTO catalog (`uid`, `path`) VALUES " + ", ".join("(%s, '%s')" for _ in range(num_items)), |
"COMMIT", |
],
|
[
|
"BEGIN", |
"SELECT uid, path from catalog WHERE path IN (" + ", ".join("'%s'" for _ in range(num_items)) + ")", |
"SELECT uid, path from catalog WHERE uid IN (" + ", ".join("%s" for _ in range(num_items)) + ")", |
"COMMIT", |
],
|
]
|
|
|
connection_list = [ |
pymysql.connect(host=host, port=port, user=user, password=password, database=database, cursorclass=pymysql.cursors.DictCursor) |
for _ in range(num_threads + 1) |
]
|
|
|
def worker(thread_id): |
""" |
Worker function for each thread.
|
"""
|
conn = connection_list[thread_id] |
cursor = conn.cursor() |
try: |
for _ in range(100): |
uid_list = [random.randint(1, 10**12) for _ in range(num_items)] |
if thread_id % 2 == 0: |
query = query_list[0] |
args = sum(([e, e, e, e] for e in uid_list), []) |
else: |
query = query_list[1] |
args = sum(([e, e] for e in uid_list), []) |
for q in query: |
num_args = q.count('%s') |
args_ = args[:num_args] |
cursor.execute(q, args_)
|
args = args[num_args:] |
except Exception as e: |
print(f"Thread {thread_id}: Error: {e}") |
raise |
finally: |
cursor.close()
|
|
|
if __name__ == "__main__": |
conn = connection_list[-1] |
cursor = conn.cursor() |
for i in range(100): |
threads = [] |
start_time = time.time() |
for thread_id in range(num_threads): |
thread = threading.Thread(target=worker, args=(thread_id,)) |
threads.append(thread)
|
thread.start()
|
|
|
for thread in threads: |
thread.join()
|
end_time = time.time() |
print(f"Iteration {i}: executed in {end_time - start_time:.4f} seconds", flush=True) |
cursor.execute("SHOW TABLE STATUS LIKE 'catalog'") |
print(cursor.fetchall(), flush=True) |
cursor.execute("SHOW ENGINE INNODB STATUS") |
print([e for e in cursor.fetchone()['Status'].splitlines() if 'History' in e][0], flush=True) |
Note that the script was updated from the original source version. Run as follows:
python3 test.py | tee log.txt |
You will see per-iteration output. To capture details from the same, you can use:
cat log.txt | grep Histor | grep -o '[0-9]\+' | head -n23 # History length |
cat log.txt | grep exec | sed 's|.*in||' | grep -o '[\.0-9]\+' | head -n23 # Execution time |
cat log.txt | grep -o 'Rows.: [0-9]\+' | grep -o '[\.0-9]\+' | head -n23 # Number of rows as per SHOW TABLE STATUS |
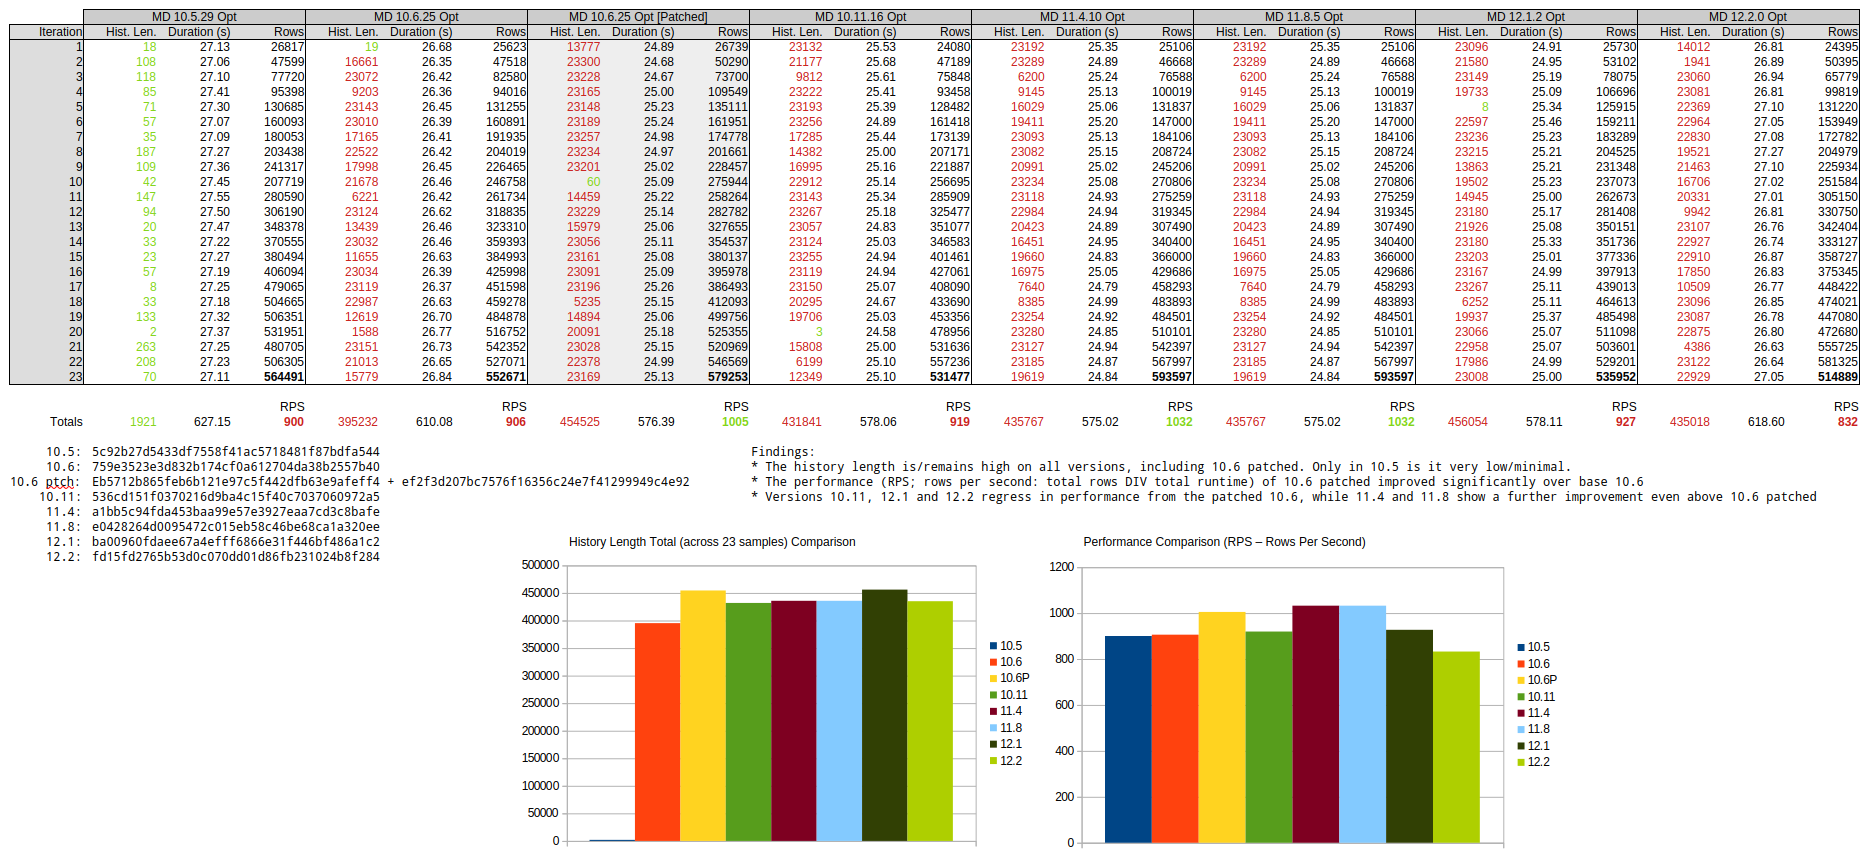
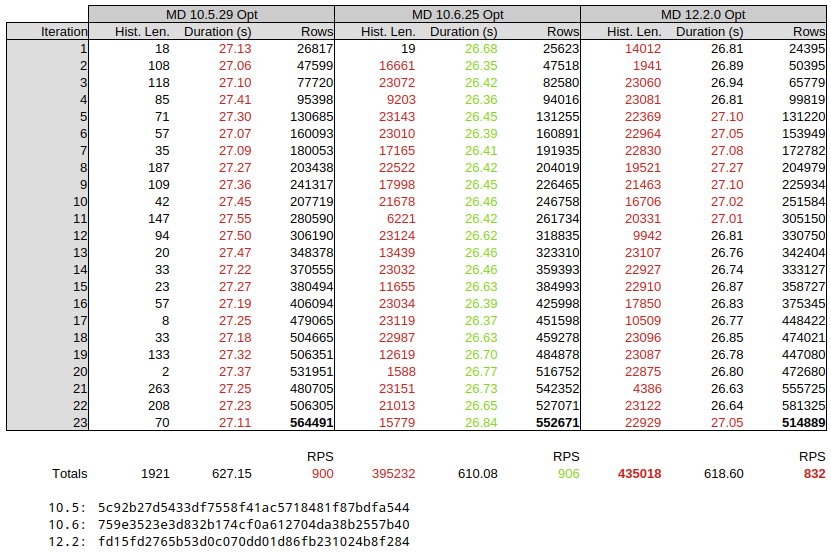
Attached (MDEV-36472_test_results_2.png![]() ) an overview of the first 23 iterations which show an significant increase in history length in 10.6.
) an overview of the first 23 iterations which show an significant increase in history length in 10.6.
|
Versions used |
CS 10.5.29 c43d0a015f974c5a0142e6779332089a7a979853 (Optimized) Build 15/02/2025
|
CS 10.6.22 f1d7e0c17e33f77278e6226dd94aeb30fc856bf0 (Optimized) Build 15/02/2025
|
The increase in history length seems to go matched with a longer per-iteration duration, and a lesser number of rows processed. Based on results during test tuning, it is expected that additional tuning of the workload can further increase the history length and other offsets.
Attachments
Issue Links
- is caused by
-
-

- Closed
-
- relates to
-
-
- Closed
-
-
MDEV-17598 InnoDB index option for per-record transaction ID
-
- Open
-
-
-
- Closed
-
-
-
- Closed
-
