Uploaded image for project: 'MariaDB Server'
  1. MariaDB Server
  2. MDEV-35894

Ongoing issue with problematical swap consuming of MariaDB instance

Details

    Description

      Hello all,

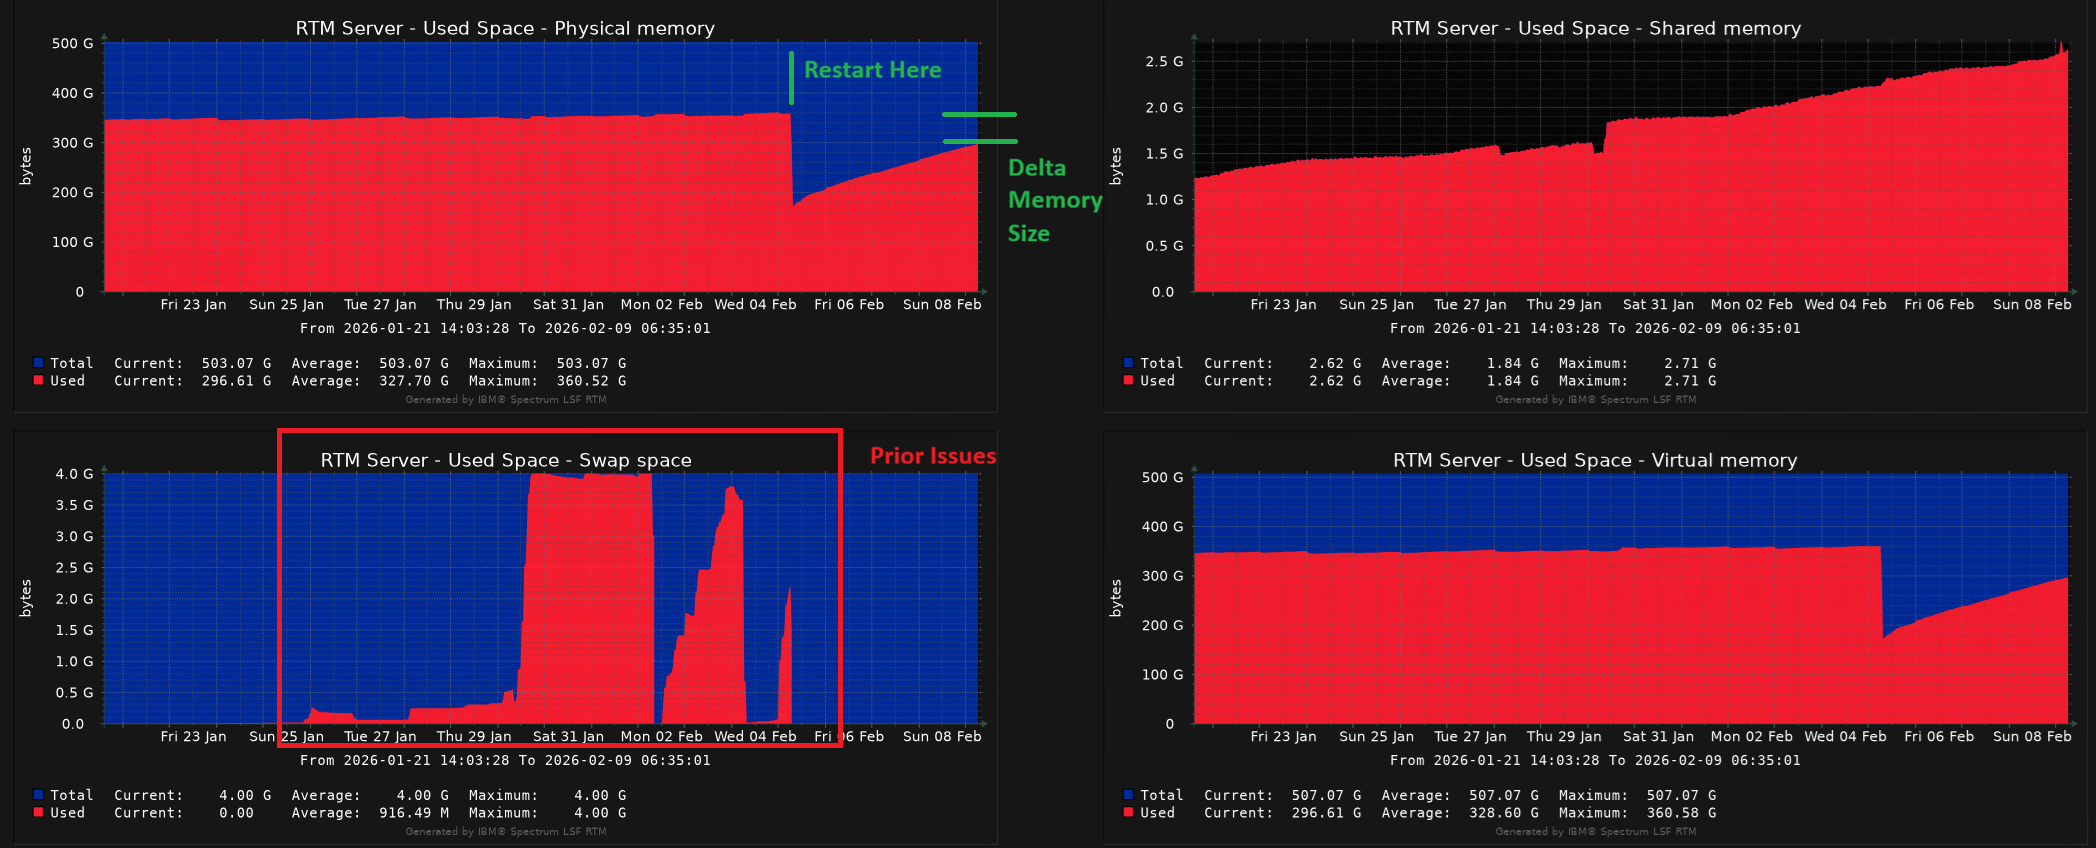
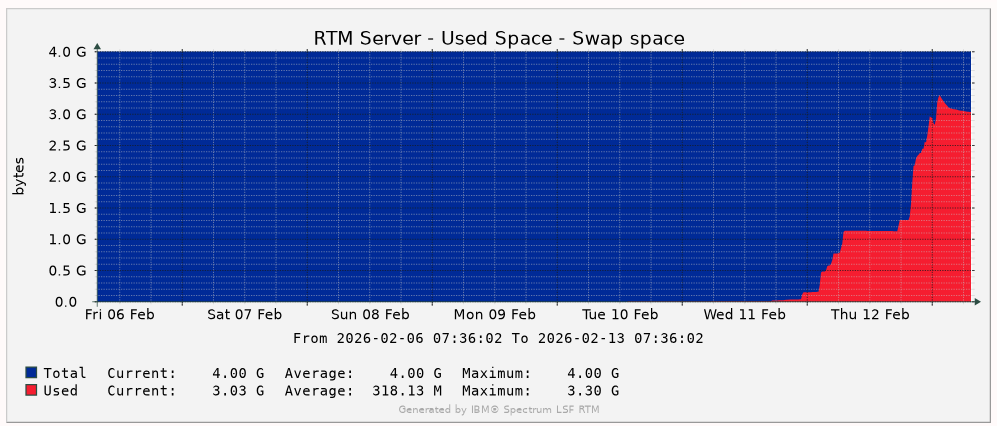
      we keep having problems with one of our MariaDB instances consuming more and more swap since October 2023. You can see a cutout of the swap usage in the attached image.
      As a result it crashed several times.

      We already tried these things:

      • increase of swap (server)
      • increase of memory (server) + memory settings (MariaDB instance)
      • patch to MariaDB version 10.4.28
      • migration to new server (old server CentOS 5)
      • major upgrade of MariaDB instance from version 10.4.28 to 10.11.7
      • reduce of swappiness (server)
      • several restarts (server + MariaDB instance)
      • major upgrade of customer application (Pimcore 6.2.3 to 11.4.1)
      • major upgrade of MariaDB instance from version 10.11.7 to 11.4.4

      We are running out of ideas as the performance_schema does not help either and would be very thankful for support.

      Kind regards
      Sandra Attermeyer

      Attachments

        Activity

          elenst Elena Stepanova added a comment - - edited

          What exactly did you get from the performance schema? Specifically, on 10.11 or 11.4, as performance schema in 10.4 it is indeed not very useful for investigating memory issues? I assume, you enabled memory-related instruments and set up a monitor which was reading from performance_schema.memory_xxx tables periodically, so where was the largest consumption?

          Also, there have been cases when switching to a different memory allocator helped (see for example MDEV-35700). You didn't mention it among the things you tried, so maybe it's something to experimented with.

          elenst Elena Stepanova added a comment - - edited What exactly did you get from the performance schema? Specifically, on 10.11 or 11.4, as performance schema in 10.4 it is indeed not very useful for investigating memory issues? I assume, you enabled memory-related instruments and set up a monitor which was reading from performance_schema.memory_xxx tables periodically, so where was the largest consumption? Also, there have been cases when switching to a different memory allocator helped (see for example MDEV-35700 ). You didn't mention it among the things you tried, so maybe it's something to experimented with.
          atte005 Sandra Attermeyer added a comment -

          Hello Elena, thank you for your support!

          I've attached a file with the output of the following query, I hope that is helpful.

          SELECT event_name, count_alloc, count_free, sum_number_of_bytes_alloc FROM performance_schema.memory_summary_global_by_event_name ORDER BY sum_number_of_bytes_alloc DESC;

          The underlying OS (CentOS Stream 9), does not support tcmalloc or jemalloc. But maybe we are able to combine it with MariaDB directly. Have to discuss it in our team.

          atte005 Sandra Attermeyer added a comment - Hello Elena, thank you for your support! I've attached a file with the output of the following query, I hope that is helpful. SELECT event_name, count_alloc, count_free, sum_number_of_bytes_alloc FROM performance_schema.memory_summary_global_by_event_name ORDER BY sum_number_of_bytes_alloc DESC; The underlying OS (CentOS Stream 9), does not support tcmalloc or jemalloc. But maybe we are able to combine it with MariaDB directly. Have to discuss it in our team.

          People

            Unassigned Unassigned
            atte005 Sandra Attermeyer
            Votes:
            0 Vote for this issue
            Watchers:
            3 Start watching this issue

            Dates

              Created:
              Updated:

              Git Integration

                Error rendering 'com.xiplink.jira.git.jira_git_plugin:git-issue-webpanel'. Please contact your Jira administrators.