Uploaded image for project: 'MariaDB Server'
  1. MariaDB Server
  2. MDEV-33340

fix for MDEV-24670 causes a performance regression

Details

    • Bug
    • Status: Closed (View Workflow)
    • Blocker
    • Resolution: Cannot Reproduce
    • N/A
    • N/A
    • N/A

    Description

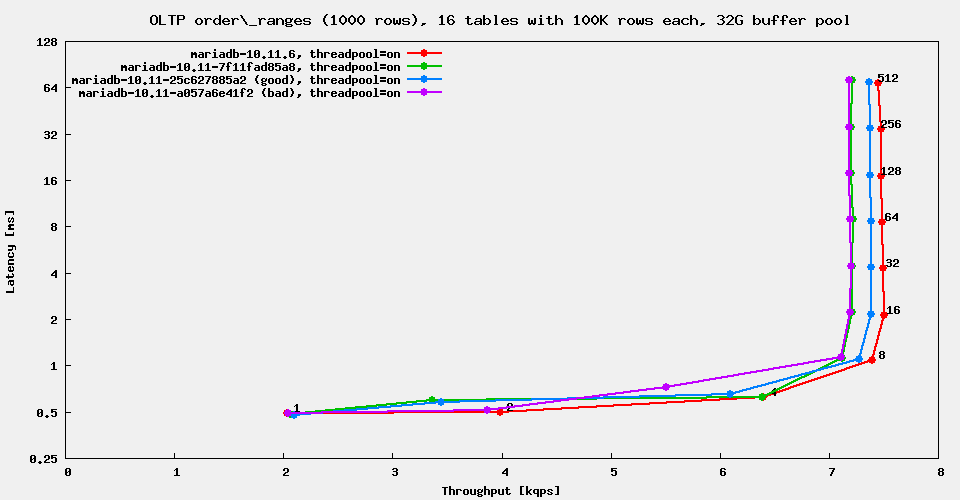
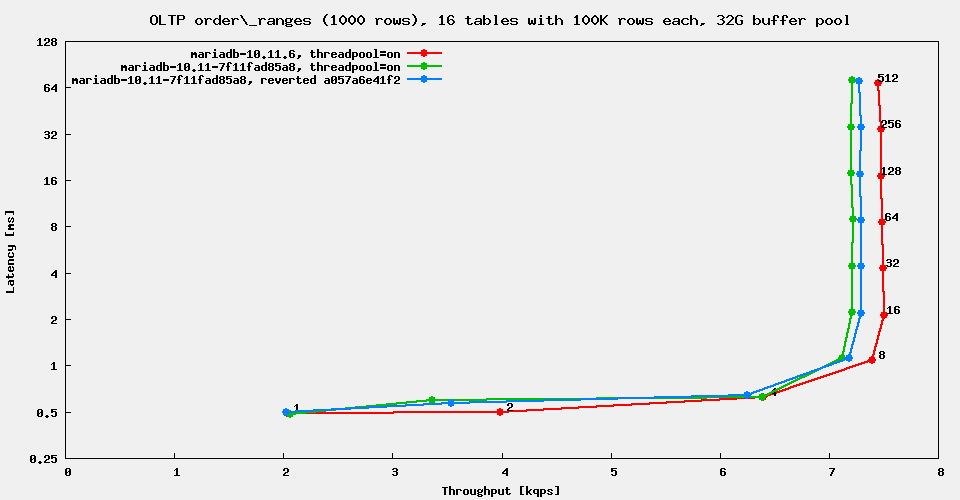
      The regression test suite found a regression for the t_threadpool* tests. It turned out to be a regression for sorting rows. Further analysis in TODO-4510 traced it to commit a057a6e41f2 for MDEV-24670.

      The regression gets bigger when more rows have to be sorted and is in the order of 3% for 1000 rows. Additionally the execution times for queries fluctuate more than normal.

      Attachments

        1. 25c627885a2-good.svg
          129 kB
          Axel Schwenke
        2. a057a6e41f2-bad.svg
          127 kB
          Axel Schwenke
        3. big_ranges_tp_off.png
          7 kB
          Axel Schwenke
        4. big_ranges_tp_off2.png
          7 kB
          Axel Schwenke
        5. big_ranges_tp_on.png
          7 kB
          Axel Schwenke
        6. big_ranges_tp_on2.png
          6 kB
          Axel Schwenke
        7. errlog-bad.txt
          3 kB
          Axel Schwenke
        8. errlog-good.txt
          3 kB
          Axel Schwenke
        9. pmp_raw_1706708923.txt.gz
          12 kB
          Axel Schwenke
        10. report.txt.gz
          38 kB
          Axel Schwenke
        11. report-no-children.txt.gz
          15 kB
          Axel Schwenke

        Issue Links

          Activity

            axel Axel Schwenke added a comment -

            The performance test results for the OLTP order ranges test:

            axel Axel Schwenke added a comment - The performance test results for the OLTP order ranges test:

            MDEV-24670 was joint work of myself and danblack. I wrote the buf_pool_t::garbage_collect(). Every invocation of it should also invoke the following:

              sql_print_information("InnoDB: Memory pressure event freed %zu pages",
                                    freed);
            

            Because there are no such messages in the server error log, the problem should not be this code (which would likely cause more severe regression later on during any performance test, by forcing pages to be read back into the buffer pool), the problem should be in some code that danblack wrote, such as mem_pressure::setup() or mem_pressure::pressure_routine().

            marko Marko Mäkelä added a comment - MDEV-24670 was joint work of myself and danblack . I wrote the buf_pool_t::garbage_collect() . Every invocation of it should also invoke the following: sql_print_information( "InnoDB: Memory pressure event freed %zu pages" , freed); Because there are no such messages in the server error log, the problem should not be this code (which would likely cause more severe regression later on during any performance test, by forcing pages to be read back into the buffer pool), the problem should be in some code that danblack wrote, such as mem_pressure::setup() or mem_pressure::pressure_routine() .
            danblack Daniel Black added a comment -

            [a057a6e41f2](https://github.com/MariaDB/server/commit/a057a6e41f2) is a simple condition in the buffer pool init so that it doesn't get activated for MariaDB-backup.

            As both commits contain the same "Failed to initialize memory pressure: No such file or directory" the both took the same path though this. (Note this error message was removed later).

            Because of this error, there isn't even a background thread running (confirmed by PMP). There would have been a little extra processing in init, however extra no CPU time during the run. Even it if had of been Ubuntu 22.04, or an OS with cgroups2, the background thread is waiting on a poll for an even that shouldn't happen without memory pressure.

            Looking at the flame graphs there's 0.08 difference in percentage at start_thread. By the time gets up to JOIN::exec the difference in percentage is 0.25. Going up further to join_init_read_record the difference in percentage is 0.83. Obviously we haven't touched any code created by memory pressure.

            Obviously with 7f11fad85a885d148254ca05f508125e3b94339c showing the same performance, there's still a regression there.

            Did reverting a057a6e41f2 show the improvement come back?

            Yes, there's a regression, but with nothing showing in the CPU profile related to MDEV-24670, on an OS platform that doesn't support the functionality that MDEV-24670 adds, confirmed by the logs, its not the problem.

            danblack Daniel Black added a comment - [a057a6e41f2] ( https://github.com/MariaDB/server/commit/a057a6e41f2 ) is a simple condition in the buffer pool init so that it doesn't get activated for MariaDB-backup. As both commits contain the same "Failed to initialize memory pressure: No such file or directory" the both took the same path though this. (Note this error message was removed later). Because of this error, there isn't even a background thread running (confirmed by PMP). There would have been a little extra processing in init, however extra no CPU time during the run. Even it if had of been Ubuntu 22.04, or an OS with cgroups2, the background thread is waiting on a poll for an even that shouldn't happen without memory pressure. Looking at the flame graphs there's 0.08 difference in percentage at start_thread. By the time gets up to JOIN::exec the difference in percentage is 0.25. Going up further to join_init_read_record the difference in percentage is 0.83. Obviously we haven't touched any code created by memory pressure. Obviously with 7f11fad85a885d148254ca05f508125e3b94339c showing the same performance, there's still a regression there. Did reverting a057a6e41f2 show the improvement come back? Yes, there's a regression, but with nothing showing in the CPU profile related to MDEV-24670 , on an OS platform that doesn't support the functionality that MDEV-24670 adds, confirmed by the logs, its not the problem.
            axel Axel Schwenke added a comment -

            I retested commit 7f11fad85a8 (the original bad release candidate) with the supposed bad commit a057a6e41f2 reverted. Result:


            for threadpool=off this looks like a057a6e41f2 could be the culprit, but then for threadpool=on it does not. I noticed also high fluctuations in throughput. Meaning the test used for bisecting could have returned bogus numbers.

            I will close this ticket, and reopen TODO-4510. Then bisect again in a different branch and maybe with a better (more stable) test case.

            axel Axel Schwenke added a comment - I retested commit 7f11fad85a8 (the original bad release candidate) with the supposed bad commit a057a6e41f2 reverted. Result: for threadpool=off this looks like a057a6e41f2 could be the culprit, but then for threadpool=on it does not. I noticed also high fluctuations in throughput. Meaning the test used for bisecting could have returned bogus numbers. I will close this ticket, and reopen TODO-4510. Then bisect again in a different branch and maybe with a better (more stable) test case.
            axel Axel Schwenke added a comment -

            Looks like this was a false alarm.

            axel Axel Schwenke added a comment - Looks like this was a false alarm.

            People

              Unassigned Unassigned
              axel Axel Schwenke
              Votes:
              1 Vote for this issue
              Watchers:
              8 Start watching this issue

              Dates

                Created:
                Updated:
                Resolved:

                Git Integration

                  Error rendering 'com.xiplink.jira.git.jira_git_plugin:git-issue-webpanel'. Please contact your Jira administrators.