Uploaded image for project: 'MariaDB Server'
  1. MariaDB Server
  2. MDEV-23228

Optimizer chooses bad Execution Plan in wordpress query

Details

    Description

      Optimizer chooses bad strategy for some word press queries on table wp_postmeta:

      SELECT post_id, meta_key, meta_value
        FROM wp_postmeta 
       WHERE post_id IN (27529,...1125 other entries...,10584)
       ORDER BY meta_id ASC
      ;
      

      • Up to MariaDB 10.2

      +------+-------------+-------------+-------+---------------+---------+---------+------+-------+---------------------------------------+
      | id   | select_type | table       | type  | possible_keys | key     | key_len | ref  | rows  | Extra                                 |
      +------+-------------+-------------+-------+---------------+---------+---------+------+-------+---------------------------------------+
      |    1 | SIMPLE      | wp_postmeta | range | post_id       | post_id | 8       | NULL | 25301 | Using index condition; Using filesort |
      +------+-------------+-------------+-------+---------------+---------+---------+------+-------+---------------------------------------+
      

      Execution time about: 100 - 110 ms.

      • From MariaDB 10.3

      +------+--------------+-------------+------+---------------+---------+---------+--------------+------+---------------------------------+
      | id   | select_type  | table       | type | possible_keys | key     | key_len | ref          | rows | Extra                           |
      +------+--------------+-------------+------+---------------+---------+---------+--------------+------+---------------------------------+
      |    1 | PRIMARY      | <subquery2> | ALL  | distinct_key  | NULL    | NULL    | NULL         | 1128 | Using temporary; Using filesort |
      |    1 | PRIMARY      | wp_postmeta | ref  | post_id       | post_id | 8       | tvc_0._col_1 |    4 | Using index condition           |
      |    2 | MATERIALIZED | <derived3>  | ALL  | NULL          | NULL    | NULL    | NULL         | 1128 |                                 |
      |    3 | DERIVED      | NULL        | NULL | NULL          | NULL    | NULL    | NULL         | NULL | No tables used                  |
      +------+--------------+-------------+------+---------------+---------+---------+--------------+------+---------------------------------+
      

      Execution time: About 150 ms (50% worse).

      We did not find any way to force the optimizer to choose the older execution plan with optimizer_switches:

      set session optimizer_switch='materialization=off,semijoin=off';
      set session optimizer_switch='derived_merge=OFF';

      https://mariadb.org/wp-content/uploads/2018/07/state-of-mariadb-optimizer-r08.pdf
      https://mariadb.com/kb/en/derived-table-with-key-optimization/
      https://mariadb.com/kb/en/semi-join-materialization-strategy/
      https://mariadb.com/kb/en/derived-table-merge-optimization/

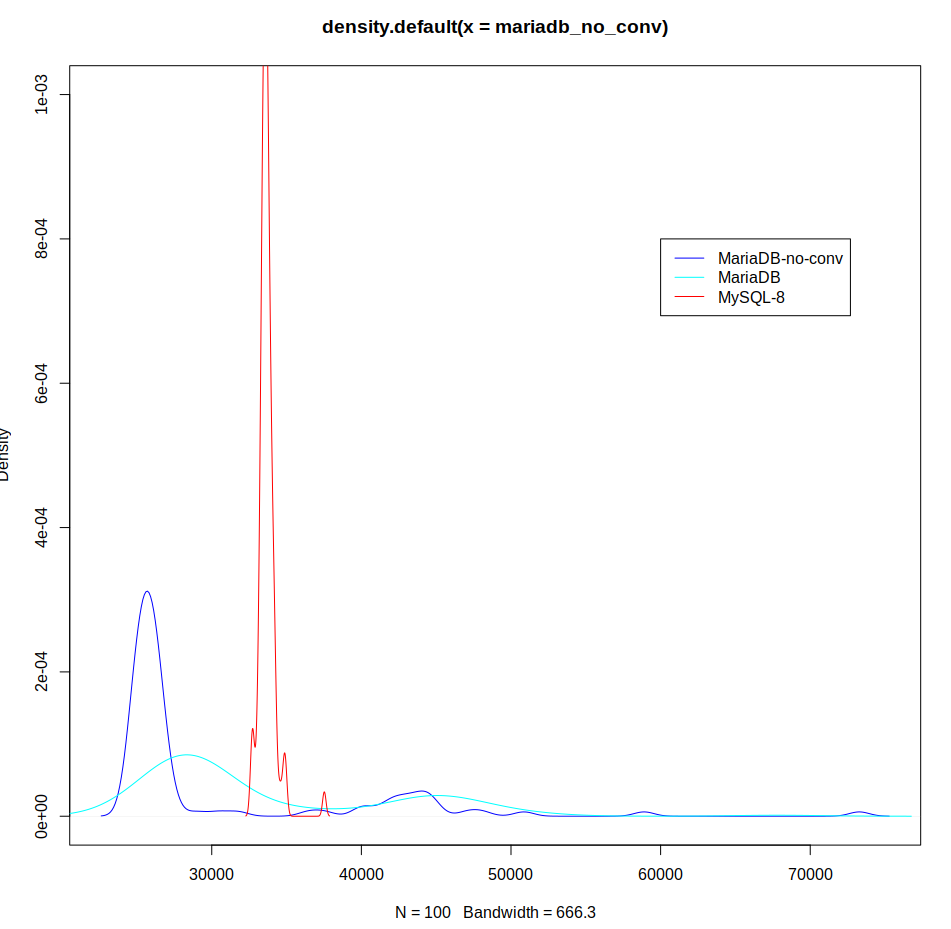
      Further a Execution Plan of a competitive product did slightly better:

      +----+-------------+-------------+------------+-------+---------------+---------+---------+------+------+----------+--------------------------------------------------+
      | id | select_type | table       | partitions | type  | possible_keys | key     | key_len | ref  | rows | filtered | Extra                                            |
      +----+-------------+-------------+------------+-------+---------------+---------+---------+------+------+----------+--------------------------------------------------+
      |  1 | SIMPLE      | wp_postmeta | NULL       | range | post_id       | post_id | 8       | NULL | 6768 |   100.00 | Using index condition; Using MRR; Using filesort |
      +----+-------------+-------------+------------+-------+---------------+---------+---------+------+------+----------+--------------------------------------------------+
      

      Execution time: 80 ms (100% improvement to the previous).

      We were not able to enforce this better Execution plan with optimizer_switches either:

      set session optimizer_switch='mrr=on,mrr_sort_keys=on';

      (psergey: edited to make more readable)

      Attachments

        1. generate-query.txt
          0.3 kB
        2. mdev23228-fill-tables.sql
          0.8 kB
        3. mdev23228-q-timings.sql
          8 kB
        4. run-timings.sql
          7 kB
        5. screenshot-1.png
          screenshot-1.png
          62 kB
        6. xaa
          9.00 MB
        7. xab
          9.00 MB
        8. xac
          381 kB

        Activity

          psergei Sergei Petrunia added a comment - - edited

          oli, thanks for the dataset.

          Played with it on my side. (The query times are microseconds, each query is tried 100 times)
          https://gist.github.com/spetrunia/774fad85731338785fa8f0434358c23e

          Results

          • For me, MariaDB was faster.
          • With ORDER BY clause , In->to->subquery conversion gives about 1.4x slowdown.
          • Without ORDER BY, In->to->subquery conversion gives 0.93x slowdown (that is, a speedup)

          Two angles:

          • would be interesting to know why the results are different. (My setup is slightly different - self-built binaries, not exactly same 8.0 version, etc)
          • What (if anything) could be done about the slowdown with ORDER BY.
          psergei Sergei Petrunia added a comment - - edited oli , thanks for the dataset. Played with it on my side. (The query times are microseconds, each query is tried 100 times) https://gist.github.com/spetrunia/774fad85731338785fa8f0434358c23e Results For me, MariaDB was faster. With ORDER BY clause , In->to->subquery conversion gives about 1.4x slowdown. Without ORDER BY, In->to->subquery conversion gives 0.93x slowdown (that is, a speedup) Two angles: would be interesting to know why the results are different. (My setup is slightly different - self-built binaries, not exactly same 8.0 version, etc) What (if anything) could be done about the slowdown with ORDER BY.

          Roel, could you try on your side (the details are in the email)

          psergei Sergei Petrunia added a comment - Roel , could you try on your side (the details are in the email)
          Roel Roel Van de Paar added a comment - - edited

          Original posted issue confirmed. I did this on a large Google cloud instance which was otherwise idle.
          1) Used the 'Dump, Create Table and Query' data attached to issue.
          2) Started self-build 10.2.33 and 10.3.24 with fresh database instances, no tuning, optimized (release) builds.
          3) Remarked EXPLAIN in the query sql file (wp_postmeta_query.sql)
          4) Brought up CLI command line and ran SOURCE wp_postmeta_dump.sql;
          5) Used SOURCE wp_postmeta_query.sql; to execute the query.
          6) Waited for output to finish on one mysqld instance before moving to next one (to avoid tests affecting each other)
          7) Compared the results (after significant visual output);

          10.2.33 (Optimized)

          ...
          25301 rows in set (0.16 sec)
          

          10.3.24 697273554f0952160baa10606c02be1f6cf3c6c5 (Optimized)

          ...
          25301 rows in set (0.230 sec)
          

          Note the rather large increase for 10.3, which indeed seems like a performance regression.

          Subsequent runs of the same query still vary though less; caching of any sort likely kicked in, especially as run times are shorter. The results in that case were 0.11 seconds (10.2.33) and 0.170 seconds (10.3.24). Still a significant difference. This result is repeatable (0.11/0.166 on next run), and is deemed non-sporadic.

          I next tested 10.5.5 (again on a freshly created instance) and the result there was:

          10.5.5 744919552cc6a2b1229dbaa59f65d798122c6adb (Optimized)

          25301 rows in set (0.628 sec)
          

          A significantly worse result on the first query. Subsequent runs gave 0.186 sec and 0.179 sec respectively, which is close to 10.3 performance. It thus seems like there is a regression starting with 10.3 only. I next test 10.4 to see what the outcome was there. For the first query there was;

          10.4.14 dc68846ec5ffdd6f08d93dc3bda123ff9cef04fa (Optimized)

          25301 rows in set (0.231 sec)
          

          And subsequent queries gave 0.170 sec and 0.170 sec again on the third run. I thus conclude that the performance regression started in 10.3 and continues to exist today.

          Note that the use of the CLI may mean that the output is slow (has regressed) versus the actual query being slow. To analyze this further, I re-enabled EXPLAIN to see if there was a difference in query execution plan on my side also. I also re-initalized the server completely to have a fresh environment and avoid any caching from affecting things. Results:

          10.2.33 (Optimized)

          10.2.33>source /home/roel/test/wp_postmeta_query.sql
          *************************** 1. row ***************************
                     id: 1
            select_type: SIMPLE
                  table: wp_postmeta
                   type: range
          possible_keys: post_id
                    key: post_id
                key_len: 8
                    ref: NULL
                   rows: 25301
                  Extra: Using index condition; Using filesort
          1 row in set (0.01 sec)
          

          10.3.24 697273554f0952160baa10606c02be1f6cf3c6c5 (Optimized)

          10.3.24>source /home/roel/test/wp_postmeta_query.sql
          *************************** 1. row ***************************
                     id: 1
            select_type: PRIMARY
                  table: <subquery2>
                   type: ALL
          possible_keys: distinct_key
                    key: NULL
                key_len: NULL
                    ref: NULL
                   rows: 1128
                  Extra: Using temporary; Using filesort
          *************************** 2. row ***************************
                     id: 1
            select_type: PRIMARY
                  table: wp_postmeta
                   type: ref
          possible_keys: post_id
                    key: post_id
                key_len: 8
                    ref: tvc_0._col_1
                   rows: 1   *REF*
                  Extra: Using index condition
          *************************** 3. row ***************************
                     id: 2
            select_type: MATERIALIZED
                  table: <derived3>
                   type: ALL
          possible_keys: NULL
                    key: NULL
                key_len: NULL
                    ref: NULL
                   rows: 1128
                  Extra: 
          *************************** 4. row ***************************
                     id: 3
            select_type: DERIVED
                  table: NULL
                   type: NULL
          possible_keys: NULL
                    key: NULL
                key_len: NULL
                    ref: NULL
                   rows: NULL
                  Extra: No tables used
          4 rows in set (0.001 sec)
          

          In summary; the changed query execution plan seems to lead to a significant performance regression from 10.3 onwards. Looking at the number of rows, perhaps the issue is that in 10.3 onwards, there are 1128 rows x? 1128 = 1272384? rows accessed, versus 25301 rows in the first one? Just an idea. Another reason may be the "using temporary"?

          I also checked 10.4 and 10.5 query execution plans, and they almost completely match, though for the number of rows (marked by 'REF' in the last EXPLAIN about above) there are 2 rows instead of 1 row for 10.4.14, and 3 rows instead of 1 row for 10.5.5 which seems very odd. Note also that in the original issue posted it's 4 . Again, all other markers are the same as the last EXPLAIN output above.

          I've updated the bug tags.

          Roel Roel Van de Paar added a comment - - edited Original posted issue confirmed. I did this on a large Google cloud instance which was otherwise idle. 1) Used the 'Dump, Create Table and Query' data attached to issue. 2) Started self-build 10.2.33 and 10.3.24 with fresh database instances, no tuning, optimized (release) builds. 3) Remarked EXPLAIN in the query sql file (wp_postmeta_query.sql) 4) Brought up CLI command line and ran SOURCE wp_postmeta_dump.sql; 5) Used SOURCE wp_postmeta_query.sql; to execute the query. 6) Waited for output to finish on one mysqld instance before moving to next one (to avoid tests affecting each other) 7) Compared the results (after significant visual output); 10.2.33 (Optimized) ... 25301 rows in set (0.16 sec) 10.3.24 697273554f0952160baa10606c02be1f6cf3c6c5 (Optimized) ... 25301 rows in set (0.230 sec) Note the rather large increase for 10.3, which indeed seems like a performance regression. Subsequent runs of the same query still vary though less; caching of any sort likely kicked in, especially as run times are shorter. The results in that case were 0.11 seconds (10.2.33) and 0.170 seconds (10.3.24). Still a significant difference. This result is repeatable (0.11/0.166 on next run), and is deemed non-sporadic. I next tested 10.5.5 (again on a freshly created instance) and the result there was: 10.5.5 744919552cc6a2b1229dbaa59f65d798122c6adb (Optimized) 25301 rows in set (0.628 sec) A significantly worse result on the first query. Subsequent runs gave 0.186 sec and 0.179 sec respectively, which is close to 10.3 performance. It thus seems like there is a regression starting with 10.3 only. I next test 10.4 to see what the outcome was there. For the first query there was; 10.4.14 dc68846ec5ffdd6f08d93dc3bda123ff9cef04fa (Optimized) 25301 rows in set (0.231 sec) And subsequent queries gave 0.170 sec and 0.170 sec again on the third run. I thus conclude that the performance regression started in 10.3 and continues to exist today. Note that the use of the CLI may mean that the output is slow (has regressed) versus the actual query being slow. To analyze this further, I re-enabled EXPLAIN to see if there was a difference in query execution plan on my side also. I also re-initalized the server completely to have a fresh environment and avoid any caching from affecting things. Results: 10.2.33 (Optimized) 10.2.33>source /home/roel/test/wp_postmeta_query.sql *************************** 1. row *************************** id: 1 select_type: SIMPLE table: wp_postmeta type: range possible_keys: post_id key: post_id key_len: 8 ref: NULL rows: 25301 Extra: Using index condition; Using filesort 1 row in set (0.01 sec) 10.3.24 697273554f0952160baa10606c02be1f6cf3c6c5 (Optimized) 10.3.24>source /home/roel/test/wp_postmeta_query.sql *************************** 1. row *************************** id: 1 select_type: PRIMARY table: <subquery2> type: ALL possible_keys: distinct_key key: NULL key_len: NULL ref: NULL rows: 1128 Extra: Using temporary; Using filesort *************************** 2. row *************************** id: 1 select_type: PRIMARY table: wp_postmeta type: ref possible_keys: post_id key: post_id key_len: 8 ref: tvc_0._col_1 rows: 1 *REF* Extra: Using index condition *************************** 3. row *************************** id: 2 select_type: MATERIALIZED table: <derived3> type: ALL possible_keys: NULL key: NULL key_len: NULL ref: NULL rows: 1128 Extra: *************************** 4. row *************************** id: 3 select_type: DERIVED table: NULL type: NULL possible_keys: NULL key: NULL key_len: NULL ref: NULL rows: NULL Extra: No tables used 4 rows in set (0.001 sec) In summary; the changed query execution plan seems to lead to a significant performance regression from 10.3 onwards. Looking at the number of rows, perhaps the issue is that in 10.3 onwards, there are 1128 rows x? 1128 = 1272384? rows accessed, versus 25301 rows in the first one? Just an idea. Another reason may be the "using temporary"? I also checked 10.4 and 10.5 query execution plans, and they almost completely match, though for the number of rows (marked by ' REF ' in the last EXPLAIN about above) there are 2 rows instead of 1 row for 10.4.14, and 3 rows instead of 1 row for 10.5.5 which seems very odd. Note also that in the original issue posted it's 4 . Again, all other markers are the same as the last EXPLAIN output above. I've updated the bug tags.

          oli Please note that the uploaded data is public and available to anyone even without logging in. Just want to make sure you're clear on that. Thanks.

          Roel Roel Van de Paar added a comment - oli Please note that the uploaded data is public and available to anyone even without logging in. Just want to make sure you're clear on that. Thanks.

          I wonder if this is related,
          just did an upgrade from ubuntu 20.04 packaged mariadb (identifies as 10.3.25-MariaDB-0ubuntu0.20.04.1-log ) to mariadbs packaged 10.5.9
          and now facing a lot of queries not using indexes anymore leading to extensive CPU usage in certain situations rendering the service unuseable.

          possible_keys -> yes
          key/key_len/ref NULL
          rows -> 33703609
          Using where

          Only solution is to use force key to get the resource usage down to a sane level again.

          Used Query is something like
          SELECT `field_a`, SUM(`field_b`) as value FROM `table` WHERE `indexed_field` = 'somevalue' ;

          ztk Christoph Zysik added a comment - I wonder if this is related, just did an upgrade from ubuntu 20.04 packaged mariadb (identifies as 10.3.25-MariaDB-0ubuntu0.20.04.1-log ) to mariadbs packaged 10.5.9 and now facing a lot of queries not using indexes anymore leading to extensive CPU usage in certain situations rendering the service unuseable. possible_keys -> yes key/key_len/ref NULL rows -> 33703609 Using where Only solution is to use force key to get the resource usage down to a sane level again. Used Query is something like SELECT `field_a`, SUM(`field_b`) as value FROM `table` WHERE `indexed_field` = 'somevalue' ;

          People

            psergei Sergei Petrunia
            oli Oli Sennhauser
            Votes:
            1 Vote for this issue
            Watchers:
            8 Start watching this issue

            Dates

              Created:
              Updated:

              Git Integration

                Error rendering 'com.xiplink.jira.git.jira_git_plugin:git-issue-webpanel'. Please contact your Jira administrators.