Details
-
Bug
-
Status: Closed (View Workflow)
-
 Critical
-
Resolution: Fixed
-
10.5.0
-
linux
-
Related to performance
-
Fixed a performance regression in the oltp_read_write benchmark with transaction-isolation=READ-COMMITTED. Regression introduced in 10.3.
-
Q3/2026 Server Maintenance
Description
Hello, guys
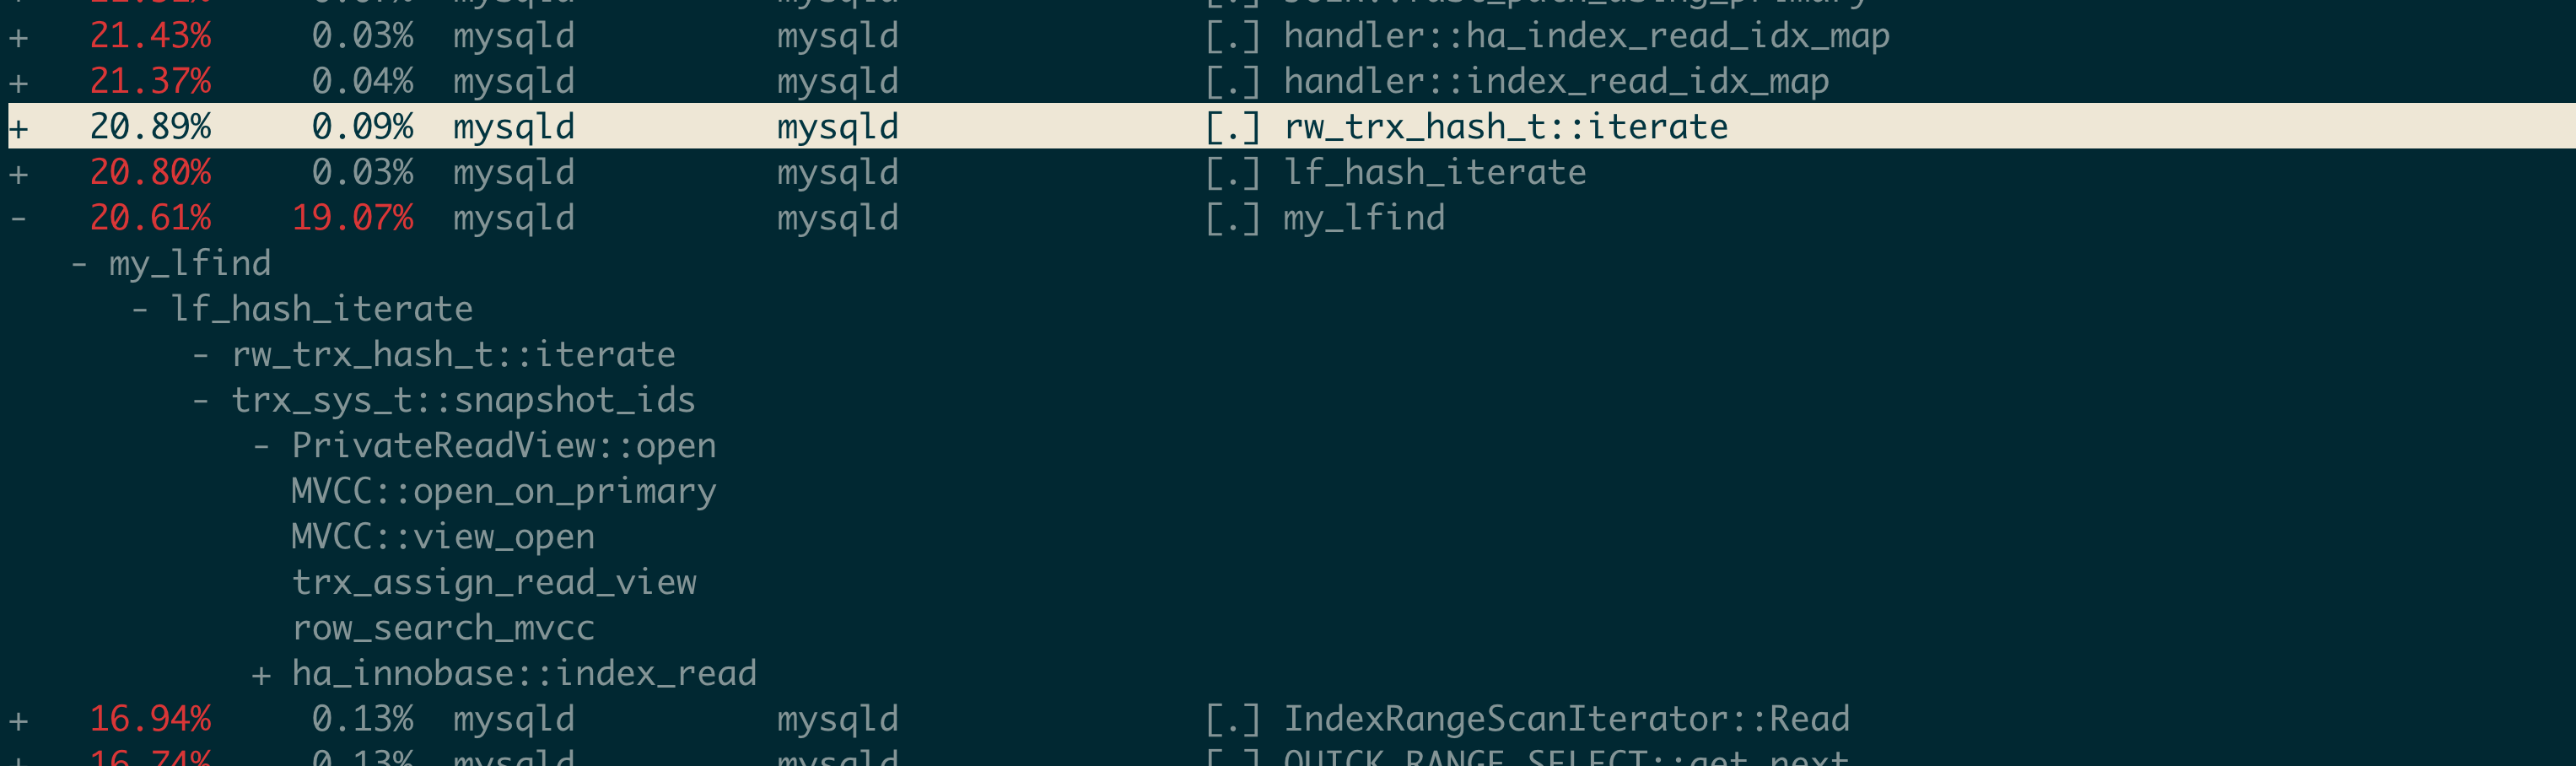
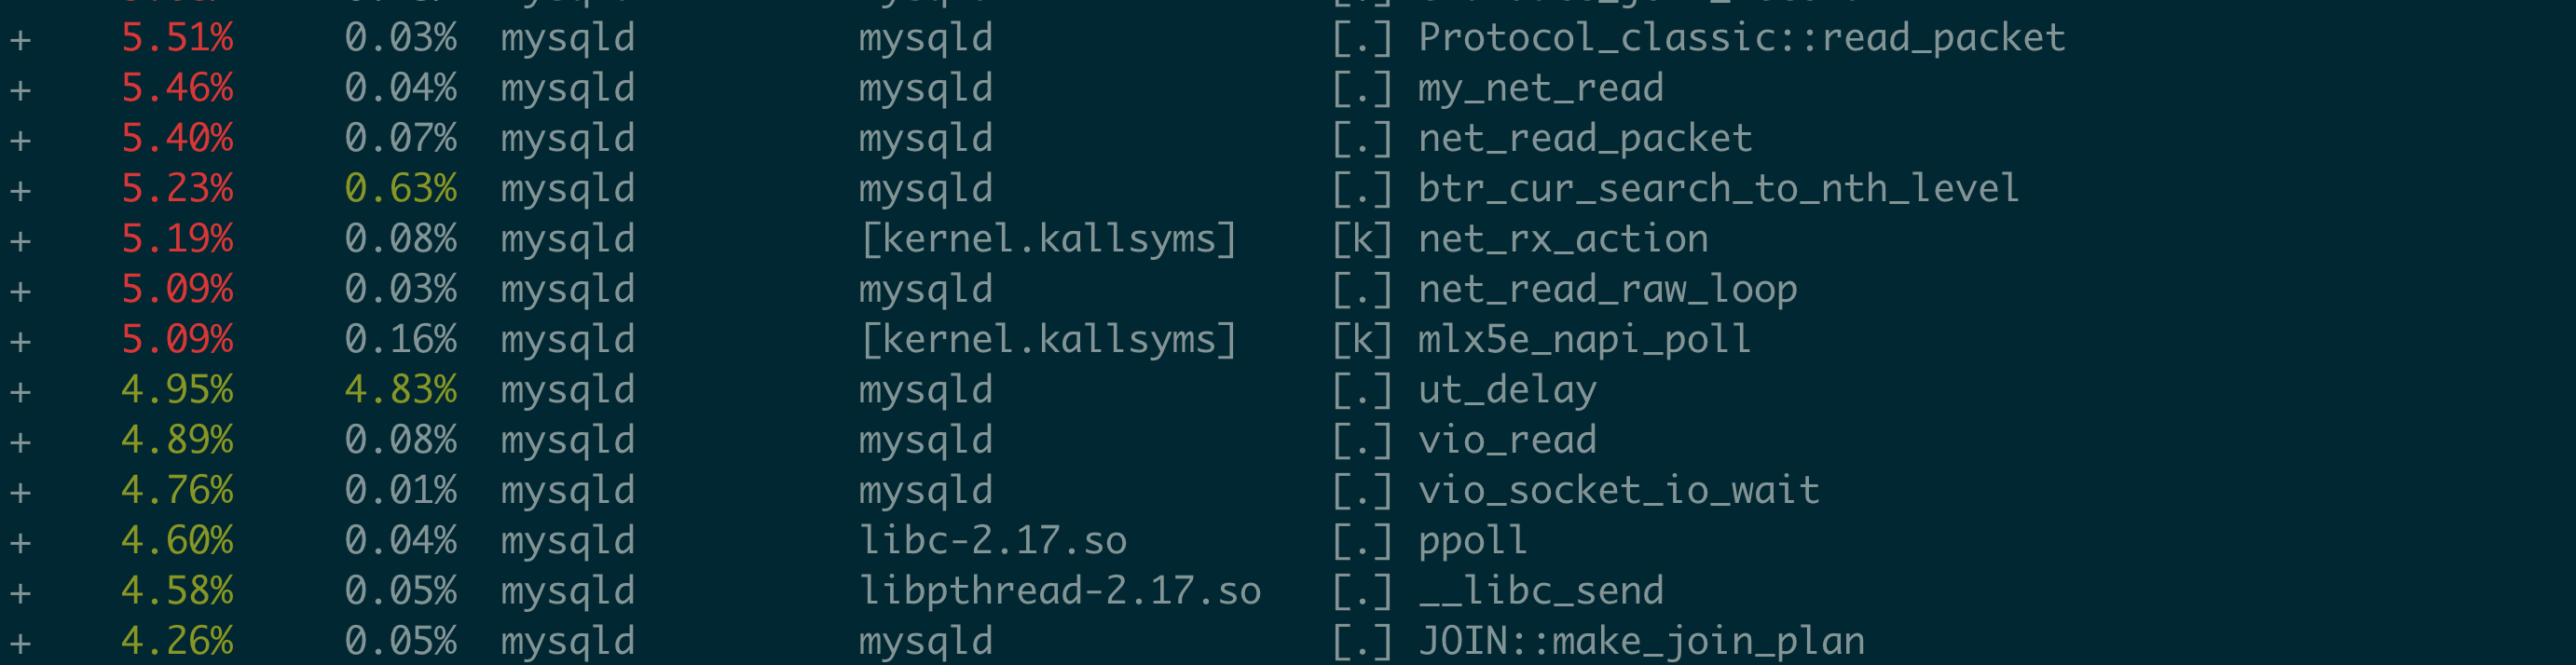
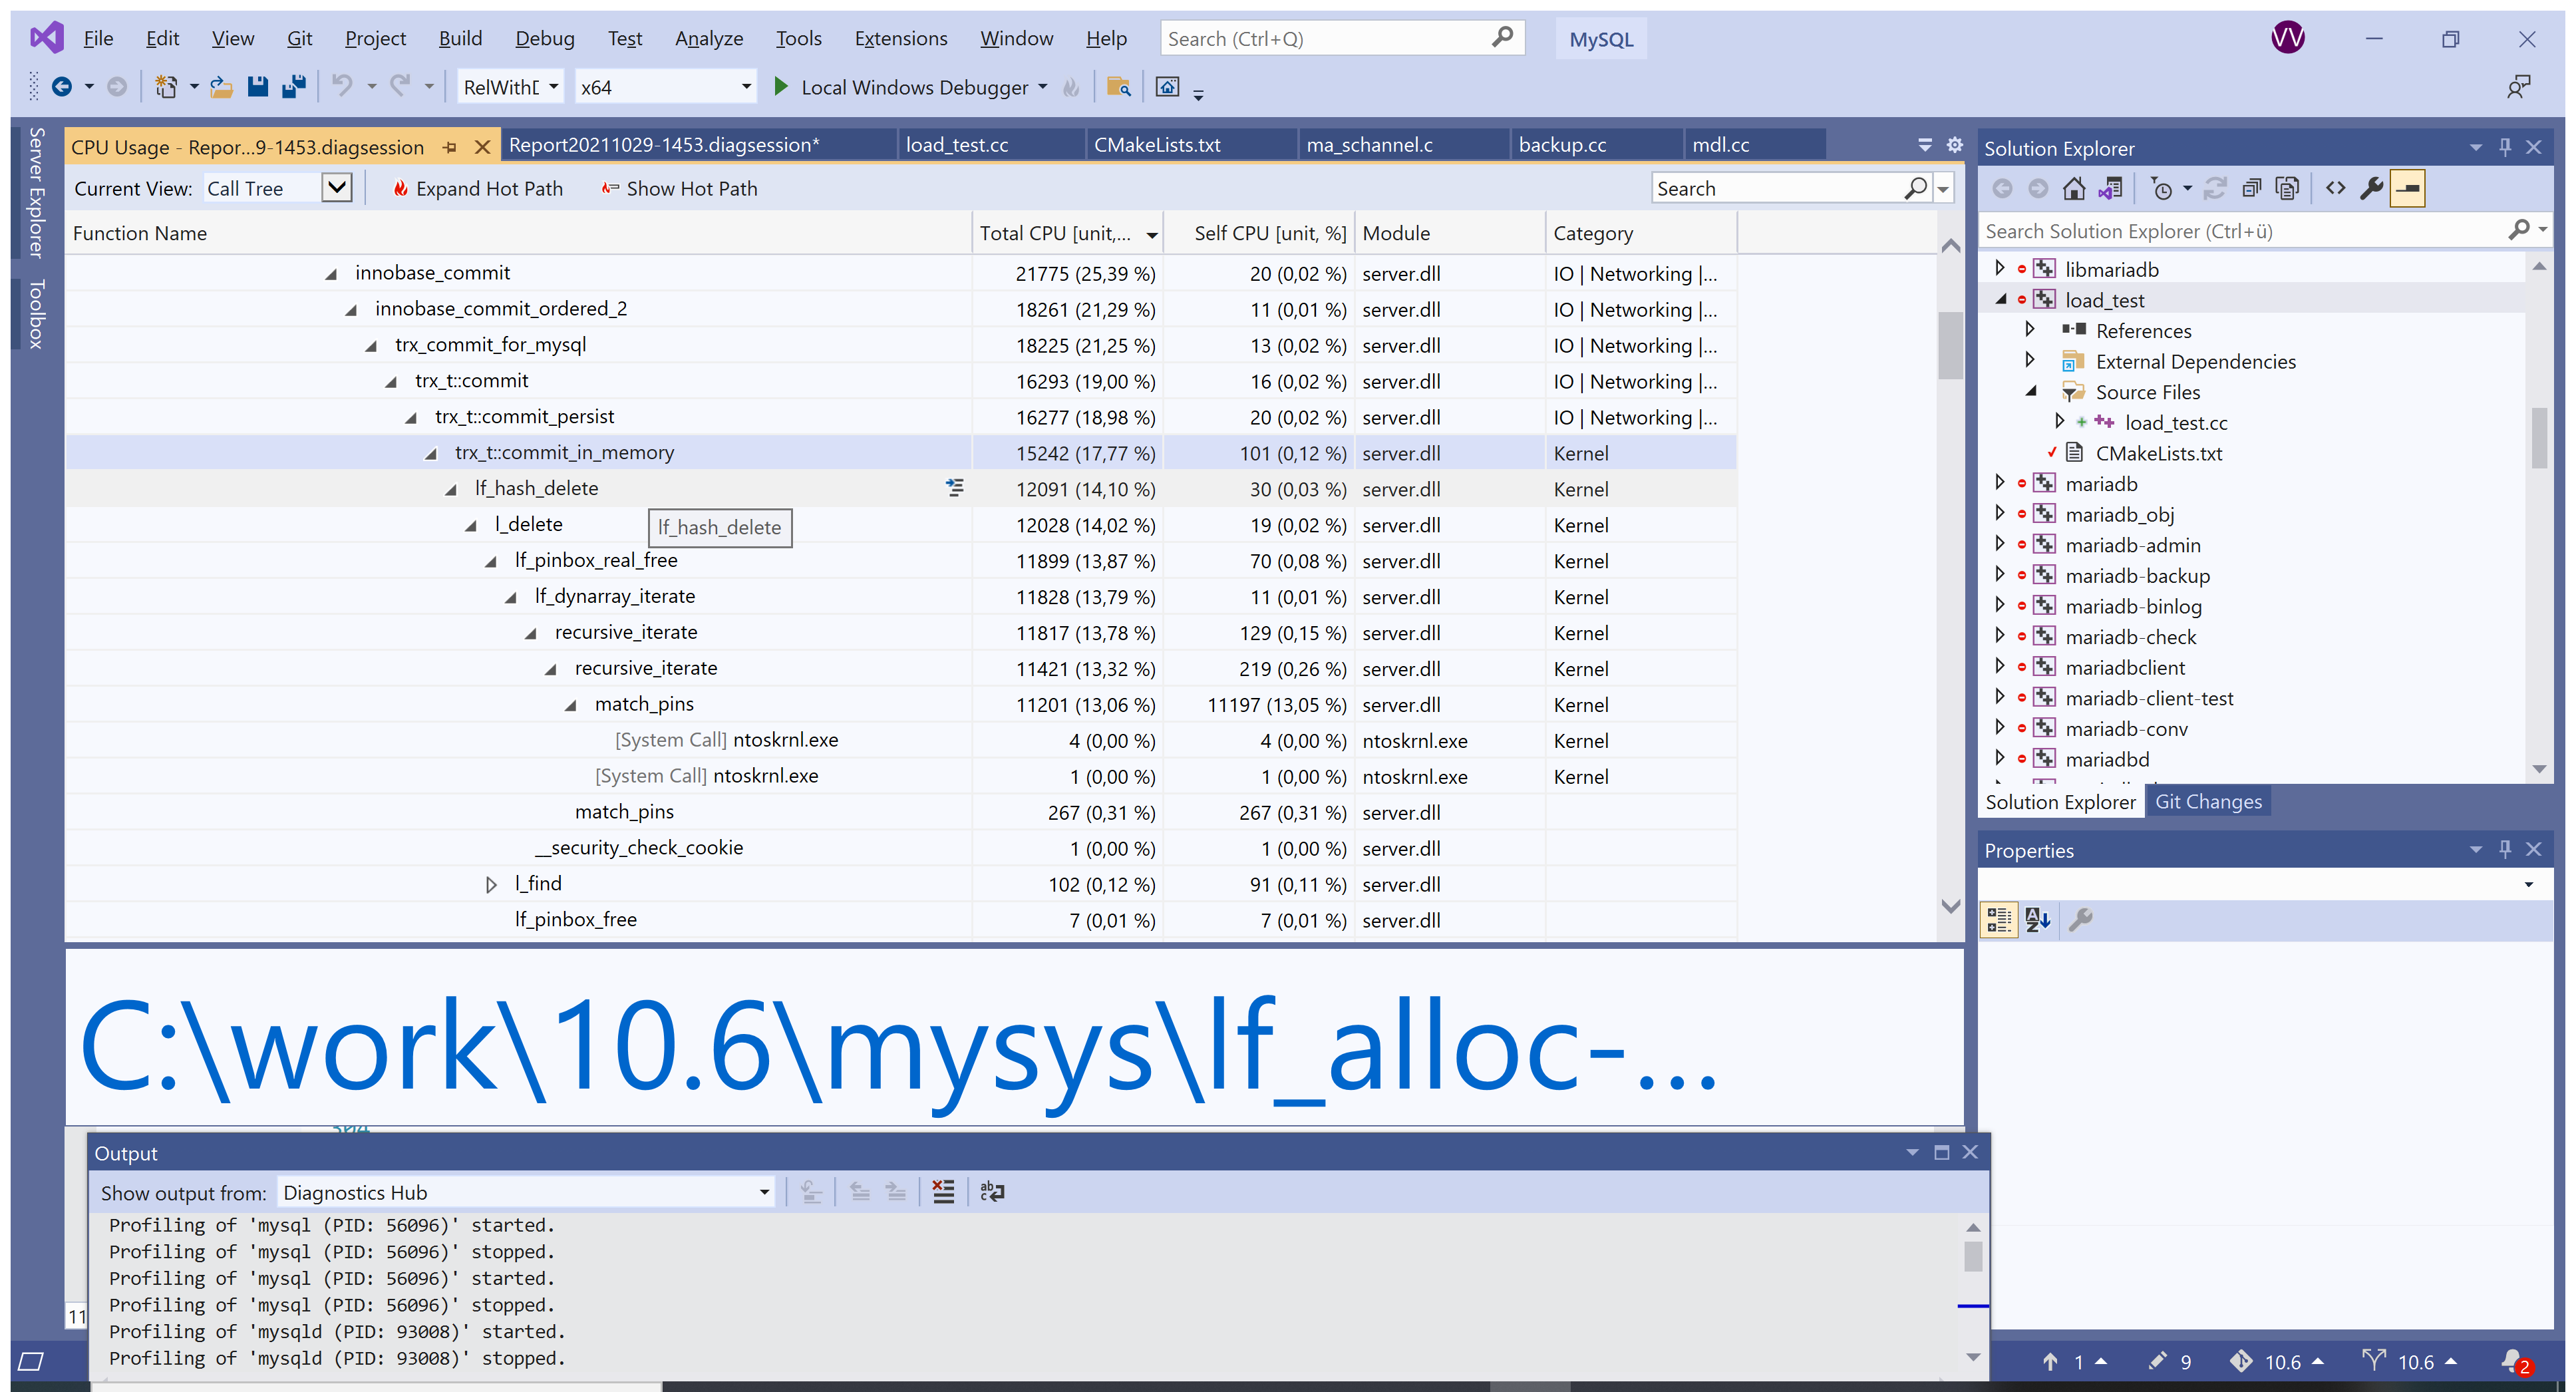
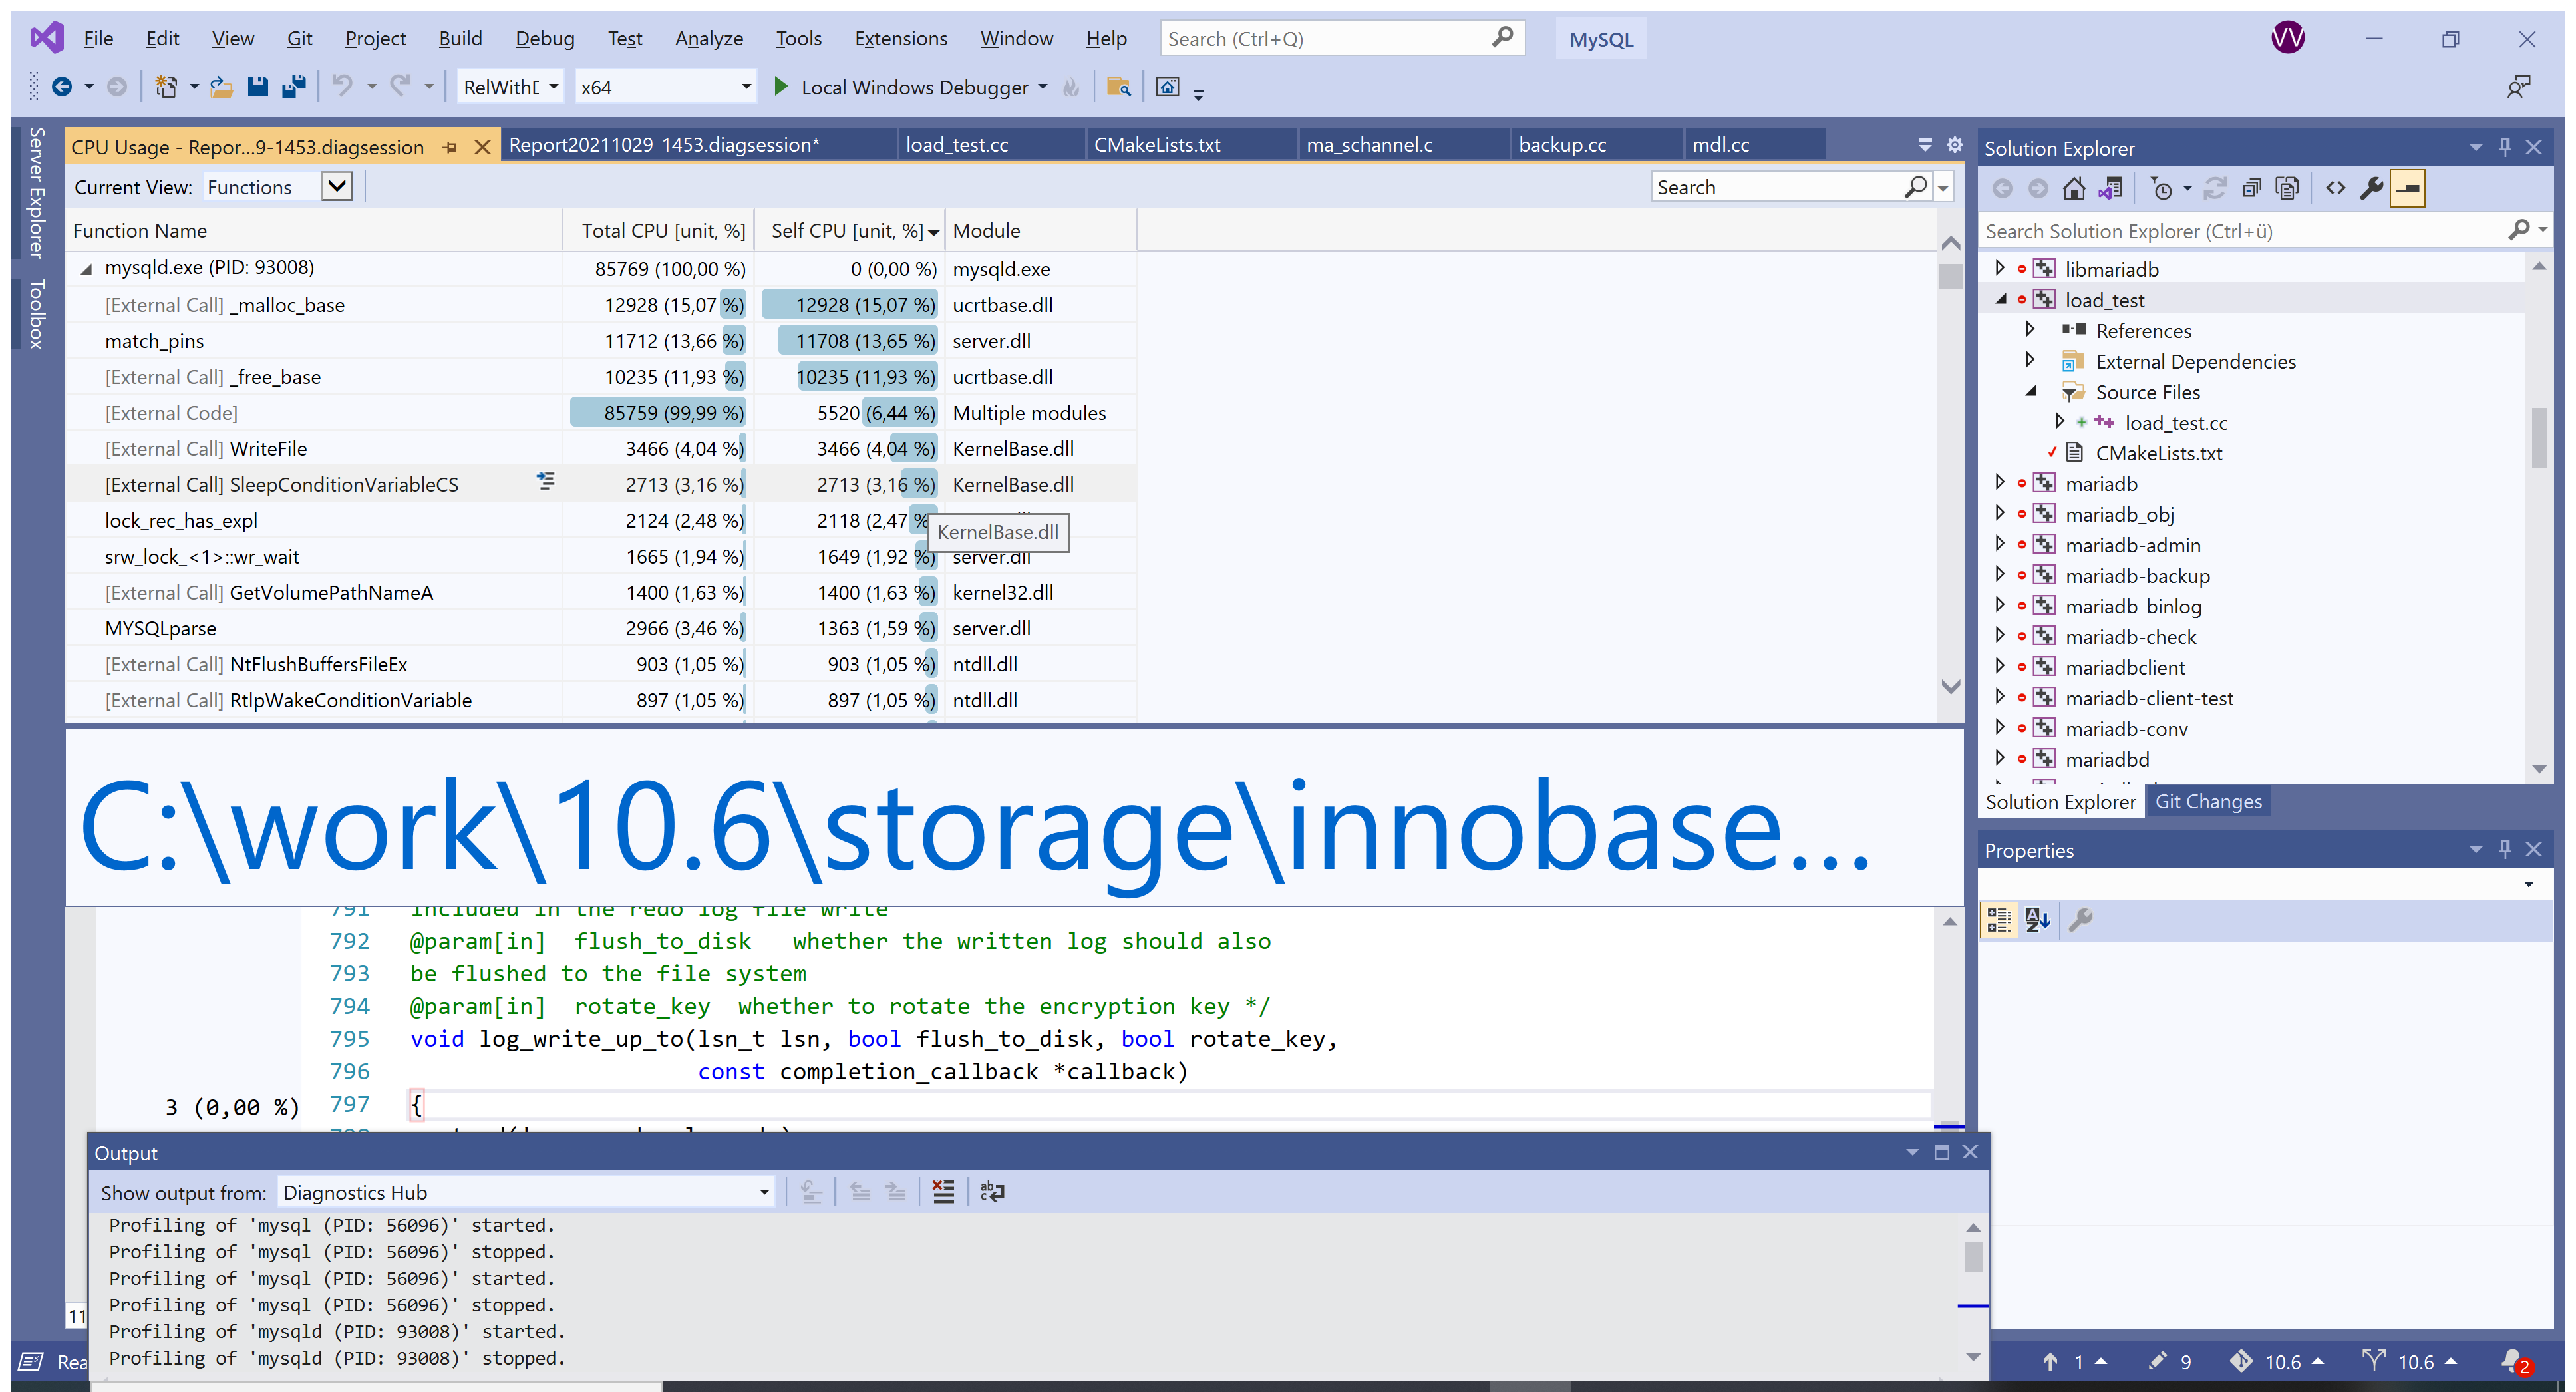
we have port the lock-free trx-sys, however I find that the oltp_read_write case get too much performance regression compare with non-lock-free version..
Especially when the isolation-level is "read-committed", lock-free trx-sys get about 40% performance regression.
I guess Mariadb has the same problem..
This is my sysbench test configure
bench_type=oltp_read_write;
|
threads=560
|
tables=8
|
table_size=500000
|
There is another issue that relate to the lock-free trx_sys: MDEV-20630
Below is the sysbench result:
you can find that the lockfree trx-sys vs non-lockfree trx-sys is
tps 13405.28 vs 20095.02
|
qps 268105.66 vs 401900.40
|
lockfree trx-sys : isolation-level
|
|
|
read-committed
|
|
|
SQL statistics:
|
queries performed:
|
read: 33803098
|
write: 9658028
|
other: 4829014
|
total: 48290140
|
transactions: 2414507 (13405.28 per sec.)
|
queries: 48290140 (268105.66 per sec.)
|
ignored errors: 0 (0.00 per sec.)
|
reconnects: 0 (0.00 per sec.)
|
|
|
General statistics:
|
total time: 180.1141s
|
total number of events: 2414507
|
|
|
Latency (ms):
|
min: 2.96
|
avg: 41.75
|
max: 4487.73
|
95th percentile: 92.42
|
sum: 100805088.64
|
|
|
Threads fairness:
|
events (avg/stddev): 4311.6196/167.34
|
execution time (avg/stddev): 180.0091/0.01
|
|
non-lockfree: read-committed
|
|
|
SQL statistics:
|
queries performed:
|
read: 50672678
|
write: 14477908
|
other: 7238954
|
total: 72389540
|
transactions: 3619477 (20095.02 per sec.)
|
queries: 72389540 (401900.40 per sec.)
|
ignored errors: 0 (0.00 per sec.)
|
reconnects: 0 (0.00 per sec.)
|
|
|
General statistics:
|
total time: 180.1161s
|
total number of events: 3619477
|
|
|
Latency (ms):
|
min: 2.47
|
avg: 27.85
|
max: 198.43
|
95th percentile: 52.89
|
sum: 100798260.68
|
|
|
Threads fairness:
|
events (avg/stddev): 6463.3518/107.19
|
execution time (avg/stddev): 179.9969/0.01
|
Attachments
Issue Links
- relates to
-
-

- Closed
-
-
-
- Closed
-
-
-
- Closed
-
-
-
- Open
-
-
-
- Open
-
-
-
- Closed
-
-
MDEV-33067 SCN(Sequence Commit Number) based MVCC
-
- Stalled
-
-
-
- Open
-
- is duplicated by
-
PERF-476 Loading...
