Details
-
Bug
-
Status: Closed (View Workflow)
-
 Critical
-
Resolution: Not a Bug
-
10.3.12, 10.3.13, 10.3.14, 10.2(EOL)
-
None
-
(Vmware ) Debian 9 , Galera Cluster 10.3.14 . 18 Go memory
Description
Hello,
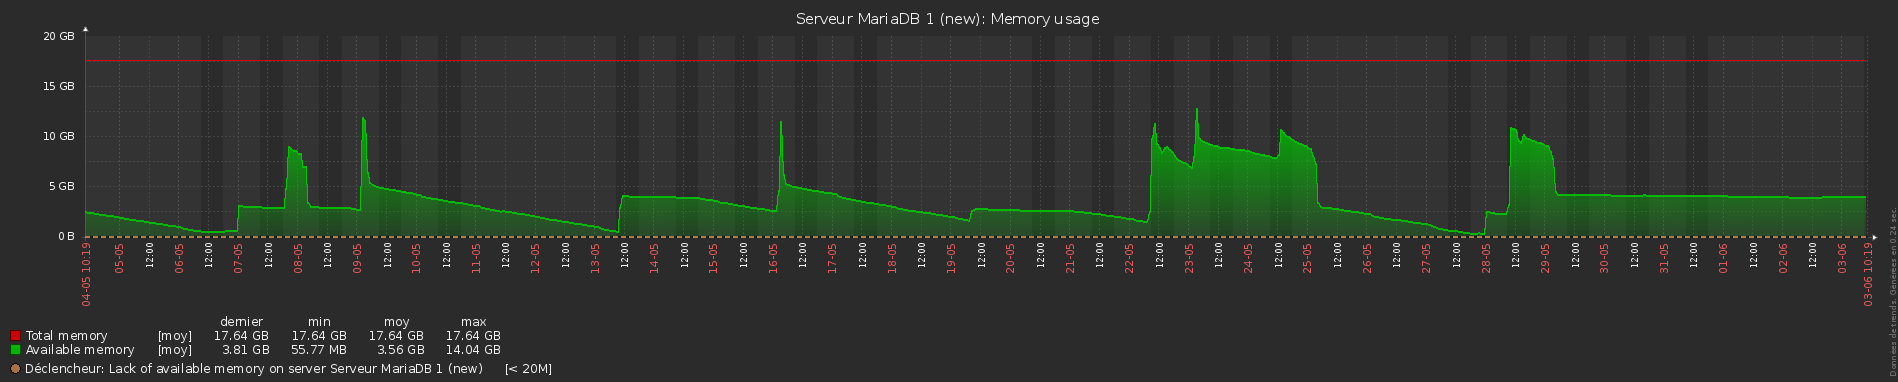
Since 1 month i have a big problem on my servers, the memory decreases slowly but never be released . Fortunatly , a reboot occurs every week when server start to swap ...
I started when ui upgrade my mariadb galera cluster (debian 8 / mariadb 10.2 ) (3 servers) on debian 9 / mariadb 10.3.12 . I upgraded the os and mariadb (now 10.3.14) without result .
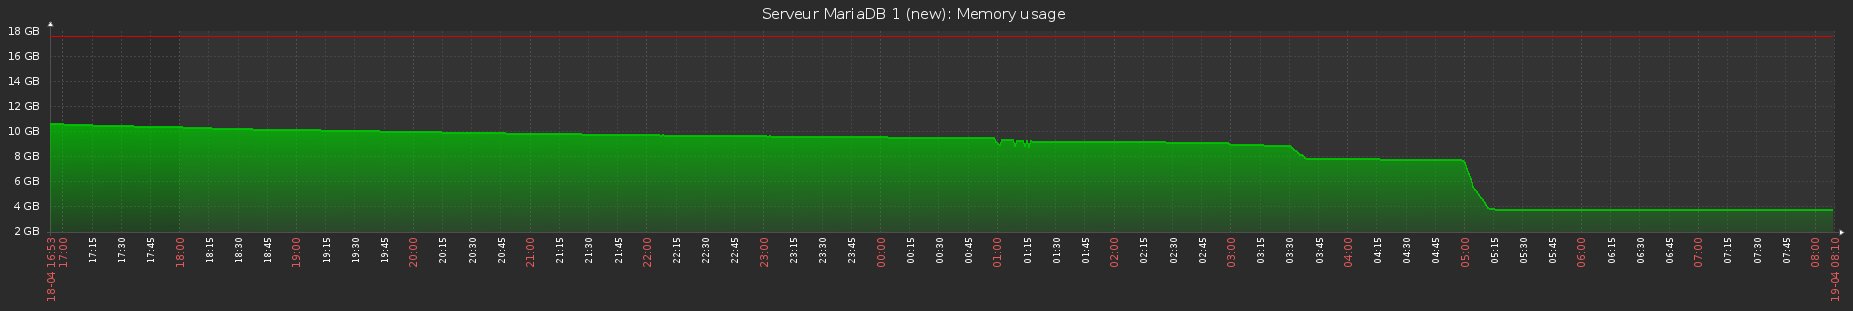
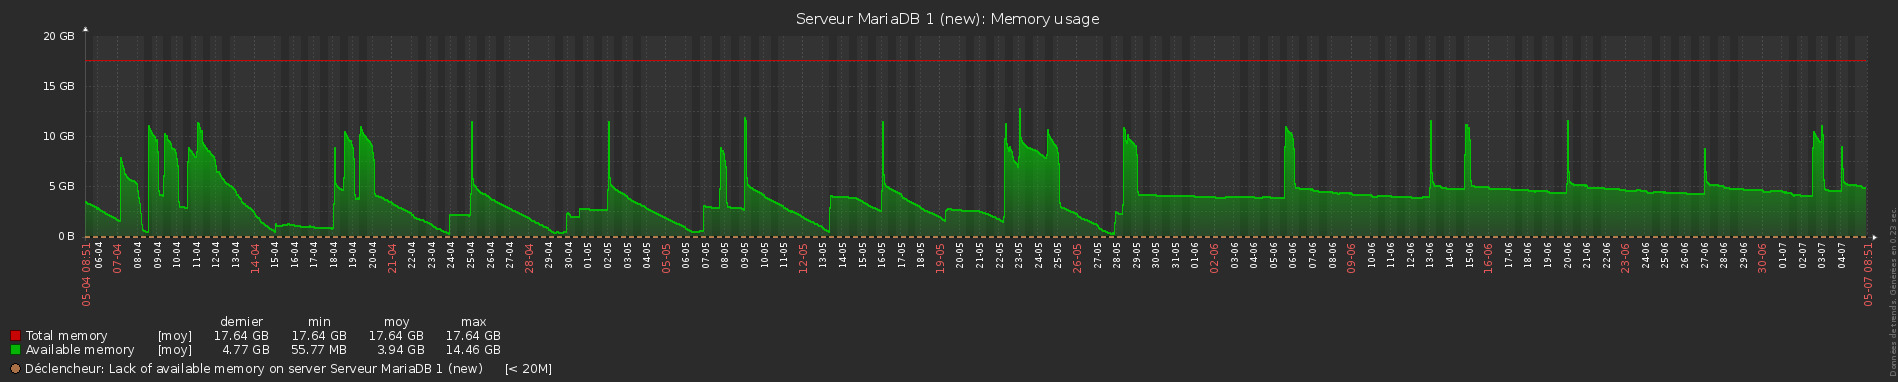
The more significative example is when i have the automysqlbackup script at 5h00 am ( mysqldump ) it uses several go of memory never released ( graph zabbix )
first capture shows backup at 5h00 AM and severe memory leak (server 1 )
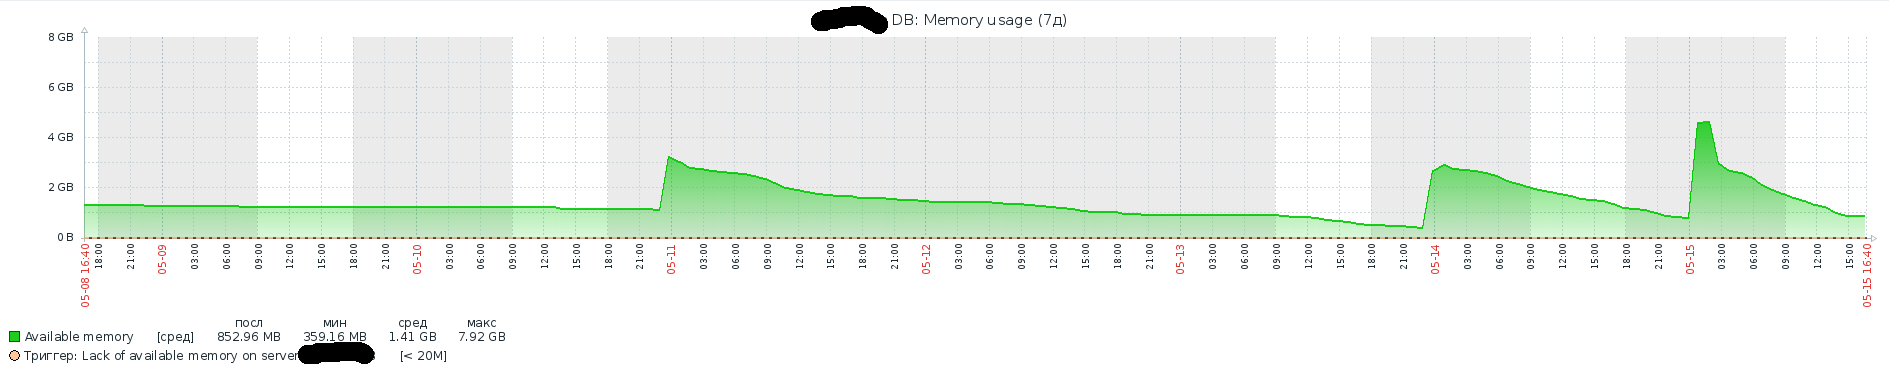
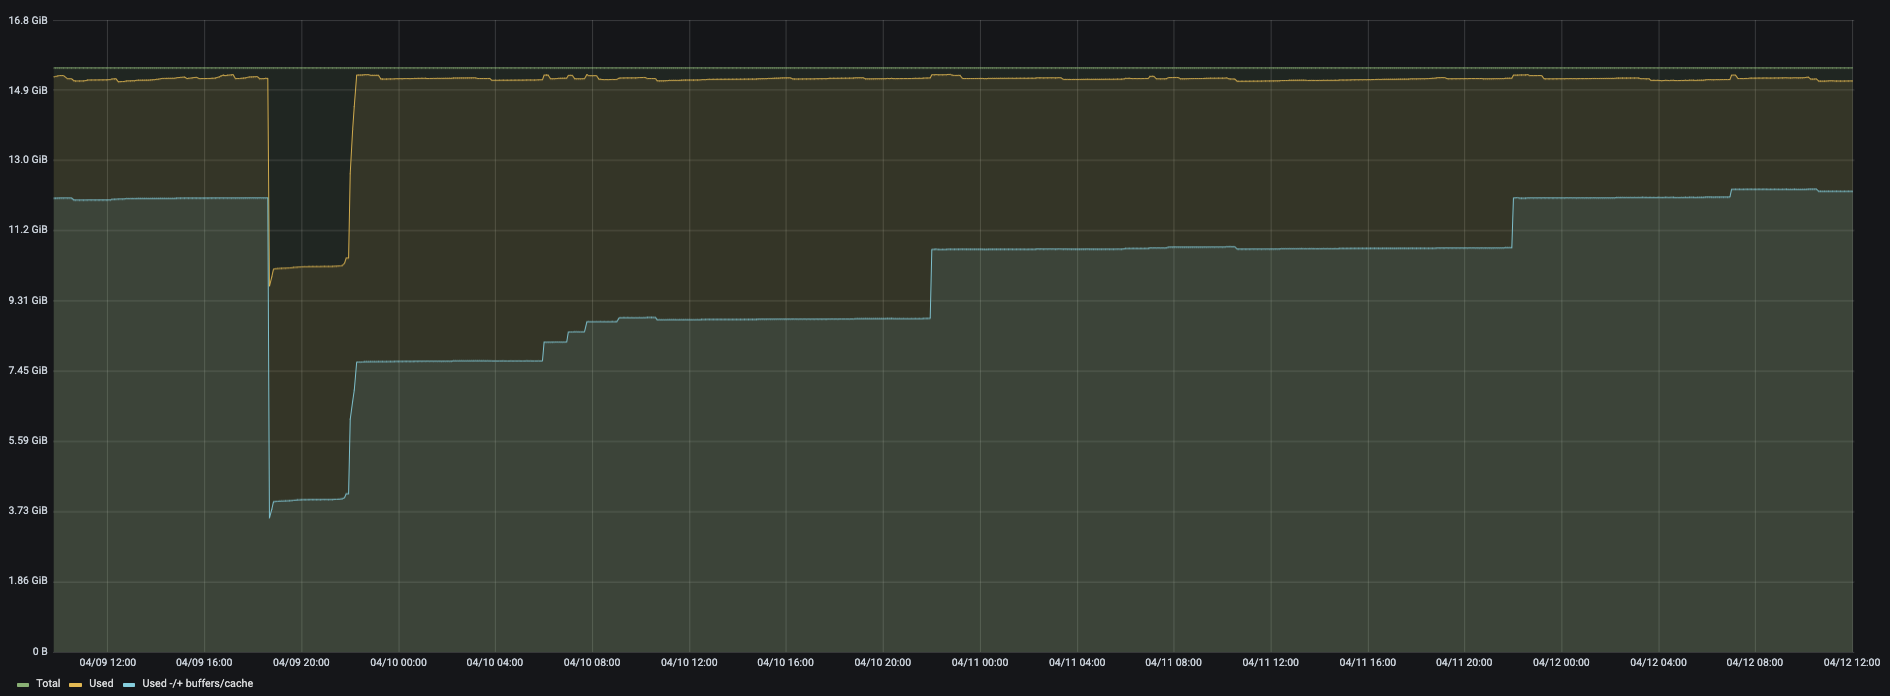
second capture shows ( reboot at 13/04 3h00 am and memory decrease slowly , no backup on this server (mariadb 2 )
i'm not sure at 100% is a mariadb problem but the mysqldump seem the most significant example so ....
Here my my.cnf
# MariaDB database server configuration file.
|
#
|
# You can copy this file to one of:
|
# - "/etc/mysql/my.cnf" to set global options,
|
# - "~/.my.cnf" to set user-specific options.
|
#
|
# One can use all long options that the program supports.
|
# Run program with --help to get a list of available options and with
|
# --print-defaults to see which it would actually understand and use.
|
#
|
# For explanations see
|
# http://dev.mysql.com/doc/mysql/en/server-system-variables.html
|
|
|
# This will be passed to all mysql clients
|
# It has been reported that passwords should be enclosed with ticks/quotes
|
# escpecially if they contain "#" chars...
|
# Remember to edit /etc/mysql/debian.cnf when changing the socket location.
|
[client]
|
port = 3306
|
socket = /var/run/mysqld/mysqld.sock
|
|
|
# Here is entries for some specific programs
|
# The following values assume you have at least 32M ram
|
|
|
# This was formally known as [safe_mysqld]. Both versions are currently parsed.
|
[mysqld_safe]
|
socket = /var/run/mysqld/mysqld.sock
|
nice = 0
|
|
|
[mysqld]
|
#
|
# * Basic Settings
|
#
|
sql_mode = 'ERROR_FOR_DIVISION_BY_ZERO,NO_AUTO_CREATE_USER,NO_ENGINE_SUBSTITUTION'
|
|
|
user = mysql
|
pid-file = /var/run/mysqld/mysqld.pid
|
socket = /var/run/mysqld/mysqld.sock
|
port = 3306
|
basedir = /usr
|
datadir = /var/lib/mysql
|
tmpdir = /tmp
|
lc_messages_dir = /usr/share/mysql
|
lc_messages = en_US
|
skip-external-locking
|
#
|
# Instead of skip-networking the default is now to listen only on
|
# localhost which is more compatible and is not less secure.
|
# bind-address = 127.0.0.1
|
#
|
# * Fine Tuning
|
#
|
thread_concurrency = 8
|
thread_cache_size = 128
|
|
|
|
|
performance_schema=on
|
skip-name-resolve
|
max_connections = 450
|
connect_timeout = 5
|
wait_timeout = 60
|
max_allowed_packet = 256M
|
thread_cache_size = 128
|
sort_buffer_size = 4M
|
bulk_insert_buffer_size = 16M
|
tmp_table_size = 32M
|
max_heap_table_size = 32M
|
key_buffer_size = 64K
|
#
|
# * MyISAM
|
#
|
# This replaces the startup script and checks MyISAM tables if needed
|
# the first time they are touched. On error, make copy and try a repair.
|
myisam_recover_options = BACKUP
|
# open-files-limit = 2000
|
table_open_cache = 2048
|
concurrent_insert = 2
|
#
|
# * Query Cache Configuration
|
#
|
# Cache only tiny result sets, so we can fit more in the query cache.
|
query_cache_limit = 128K
|
query_cache_size = 0
|
query_cache_type = 0
|
# for more write intensive setups, set to DEMAND or OFF
|
#
|
# * Logging and Replication
|
#
|
# Both location gets rotated by the cronjob.
|
# Be aware that this log type is a performance killer.
|
# As of 5.1 you can enable the log at runtime!
|
# general_log_file = /var/log/mysql/mysql.log
|
# general_log = 1
|
#
|
# Error logging goes to syslog due to /etc/mysql/conf.d/mysqld_safe_syslog.cnf.
|
#
|
# we do want to know about network errors and such
|
log_warnings = 2
|
#
|
# Enable the slow query log to see queries with especially long duration
|
#slow_query_log[={0|1}]
|
slow_query_log_file = /var/log/mysql/mariadb-slow.log
|
long_query_time = 2
|
# log_slow_rate_limit = 1000
|
log_slow_verbosity = query_plan
|
log_slow_admin_statements=ON
|
log_queries_not_using_indexes=OFF
|
log_throttle_queries_not_using_indexes=1
|
#
|
# The following can be used as easy to replay backup logs or for replication.
|
# note: if you are setting up a replication slave, see README.Debian about
|
# other settings you may need to change.
|
# server-id = 1
|
# report_host = master1
|
# auto_increment_increment = 2
|
# auto_increment_offset = 1
|
# log_bin = /var/log/mysql/mariadb-bin
|
# log_bin_index = /var/log/mysql/mariadb-bin.index
|
# not fab for performance, but safer
|
# sync_binlog = 1
|
# slaves
|
# relay_log = /var/log/mysql/relay-bin
|
# relay_log_index = /var/log/mysql/relay-bin.index
|
# relay_log_info_file = /var/log/mysql/relay-bin.info
|
#log_slave_updates
|
#read_only
|
#
|
# If applications support it, this stricter sql_mode prevents some
|
# mistakes like inserting invalid dates etc.
|
# sql_mode = NO_ENGINE_SUBSTITUTION,TRADITIONAL
|
#
|
# * InnoDB
|
#
|
# InnoDB is enabled by default with a 10MB datafile in /var/lib/mysql/.
|
# Read the manual for more InnoDB related options. There are many!
|
default_storage_engine = InnoDB
|
# you can't just change log file size, requires special procedure
|
# innodb_log_file_size = 50M
|
innodb_buffer_pool_size = 8G
|
innodb_log_buffer_size = 8M
|
innodb_file_per_table = 1
|
innodb_io_capacity = 400
|
innodb_flush_method = O_DIRECT
|
|
|
|
|
|
|
# InnoDB
|
default-storage-engine = 'InnoDB'
|
innodb-stats-on-metadata = 0
|
innodb-stats-sample-pages = 32
|
table-definition-cache = 2048
|
table-open-cache = 2048
|
# transaction-isolation = READ-COMMITTED
|
# # To be set to 0 if not multi transactional storage engine
|
innodb-buffer-pool-instances = 8
|
innodb_data_file_path = ibdata1:2000M;ibdata2:10M:autoextend
|
#
|
# # -- Set the following to maximum 60/70% of physical RAM.
|
# # innodb_max_dirty_pages_pct should be compute with redo log size in mind: It’s recommended to set the dirty pages smaller than redo log space. The more you have dirty page, the less io will be produced on disk.
|
innodb-max-dirty-pages-pct = 50
|
innodb-file-per-table = 1
|
innodb-flush-log-at-trx-commit = 1
|
# #Save and restore buffer pool to be transparent for user
|
# # innodb_flush_method = O_DIRECT
|
innodb_log_file_size = 1G
|
innodb_flush_log_at_trx_commit = 2
|
innodb_lock_wait_timeout = 50
|
innodb-log-buffer-size = 64M
|
innodb-log-files-in-group = 2
|
# innodb-log-file-size = 1024M
|
# innodb_purge_threads = 1
|
# -- Raid1: 200. Raid10: 200 x write arrays. SSD: 5000. FusionIO: 20000.
|
# innodb_io_capacity = 200
|
# -- SSD & FusionIO can flush pages in random disk order, keep default for spinning disks
|
# innodb_flush_neighbors = 0
|
# -- Increase these numbers to increase global throughput on SAN (16,32,64)
|
innodb-read-io-threads = 8
|
innodb-write-io-threads = 8
|
# -- Set this to 2-4 times # of Cpus, maximum recommended is 64.
|
# -- iostat report io service time: io_capacity / service_time is a good starting point for innodb_write_io_threads
|
# -- innodb_read_io_threads starting point monitoring status # read ahead per second
|
innodb-thread-concurrency = 8
|
#
|
innodb-open-files = 2048
|
#
|
|
|
|
|
#
|
# * Security Features
|
#
|
# Read the manual, too, if you want chroot!
|
# chroot = /var/lib/mysql/
|
#
|
# For generating SSL certificates I recommend the OpenSSL GUI "tinyca".
|
#
|
# ssl-ca = /etc/mysql/cacert.pem
|
# ssl-cert = /etc/mysql/server-cert.pem
|
# ssl-key = /etc/mysql/server-key.pem
|
|
|
#
|
# * Galera-related settings
|
#
|
|
|
log_error=/var/log/mysql/mariadb-error.log
|
[galera]
|
# Mandatory settings
|
# wsrep_on = ON
|
#wsrep_provider=
|
#wsrep_cluster_address=
|
# binlog_format = row
|
# default_storage_engine = InnoDB
|
# innodb_autoinc_lock_mode = 2
|
#
|
# Allow server to accept connections on all interfaces.
|
#
|
# bind-address = 0.0.0.0
|
binlog_format=ROW
|
|
|
expire-logs-days = 7
|
max-binlog-size = 1024M
|
sync-binlog = 1
|
binlog-stmt-cache-size = 128K
|
binlog-cache-size = 256K
|
|
|
|
|
|
|
|
|
default-storage-engine=innodb
|
innodb_autoinc_lock_mode=2
|
wsrep_on=ON
|
wsrep_cluster_name='mariadb_cluster'
|
wsrep_node_name=node4
|
wsrep_node_address=10.253.253.93
|
wsrep_provider = /usr/lib/galera/libgalera_smm.so
|
# wsrep_provider_options = ""
|
wsrep_retry_autocommit = 0
|
# # wsrep_sst_method = rsync
|
wsrep_sst_method = mariabackup
|
wsrep_sst_auth = root:extra27frz
|
wsrep_slave_threads=16
|
wsrep_certify_nonPK=1
|
wsrep_max_ws_rows=0
|
wsrep_max_ws_size=1073741824
|
wsrep_debug=0
|
wsrep_log_conflicts = 1
|
wsrep_provider_options="gcache.size = 1G; gcache.name = /var/lib/mysql/galera.cache"
|
wsrep_cluster_address=gcomm://10.253.253.93,10.253.253.94,10.253.253.95
|
# wsrep_cluster_address = gcomm://
|
wsrep_forced_binlog_format=ROW
|
enforce_storage_engine = "InnoDB"
|
#
|
server-id = 4
|
#
|
|
|
|
|
|
|
|
|
[mysqldump]
|
quick
|
quote-names
|
max_allowed_packet = 16M
|
|
|
[mysql]
|
#no-auto-rehash # faster start of mysql but no tab completion
|
|
|
[isamchk]
|
key_buffer = 16M
|
|
|
#
|
# * IMPORTANT: Additional settings that can override those from this file!
|
# The files must end with '.cnf', otherwise they'll be ignored.
|
#
|
!include /etc/mysql/mariadb.cnf
|
!includedir /etc/mysql/conf.d/
|
!include /etc/mysql/secrets-backup.cnf
|
|
|
[xtrabackup]
|
databases-exclude=lost+found
|
ssl=0
|
Attachments

Issue Links
- relates to
-
-
- Open
-
-
-

- Stalled
-
