Details
-
Bug
-
Status: Open (View Workflow)
-
 Major
Major
-
Resolution: Unresolved
-
10.1.25, 10.1.26, 10.1.28
-
None
-
linux x86_64
Description
Since upgrading to 10.1.25 we've had major problems with memory usage on our mariadb server. Unfortunately this is hard to debug and I'm not sure what causes this. Mysql will get killed by our OOM killer (which never happened before this version):
Killed process 1404 (mysqld) total-vm:7122540kB, anon-rss:1915704kB, file-rss:0kB, shmem-rss:0kB
|
my.cnf |
[mysql]
|
port = 3306
|
socket = /var/run/mysqld/mysqld.sock
|
no_auto_rehash
|
|
|
[mysqld]
|
server_id = 1
|
auto_increment_increment = 5
|
auto_increment_offset = 1
|
user = mysql
|
default_storage_engine = InnoDB
|
socket = /var/run/mysqld/mysqld.sock
|
pid_file = /var/lib/mysql/mysql.pid
|
tmpdir = /var/tmp
|
bind_address = ::
|
|
|
# SSL #
|
ssl_ca = /etc/mysql/.pem
|
ssl_cert = /etc/mysql/.pem
|
ssl_key = /etc/mysql/.key
|
|
|
# MyISAM #
|
key_buffer_size = 16M
|
myisam_recover_options = FORCE,BACKUP
|
myisam_use_mmap = 1
|
|
|
# SAFETY #
|
max_allowed_packet = 16M
|
max_connect_errors = 1000000
|
skip_name_resolve
|
innodb_strict_mode = 1
|
#log_slave_updates = 1
|
#gtid_ignore_duplicates = 1
|
|
|
# DATA STORAGE #
|
datadir = /var/lib/mysql/
|
|
|
# BINARY LOGGING #
|
log_bin = /var/lib/mysql/mysql-bin
|
relay_log = mysql-relay-bin
|
expire_logs_days = 7
|
sync_binlog = 1
|
binlog_format = MIXED
|
report_host = db1
|
gtid_strict_mode = 1
|
gtid_domain_id = 1
|
|
|
# CACHES AND LIMITS #
|
tmp_table_size = 128M
|
max_heap_table_size = 32M
|
query_cache_type = 1
|
query_cache_size = 64M
|
max_connections = 100
|
max_user_connections = 25
|
thread_cache_size = 50
|
open_files_limit = 8192
|
table_definition_cache = 4096
|
table_open_cache = 350
|
join_buffer_size = 256K
|
|
|
sort_buffer_size = 4M
|
read_buffer_size = 128K
|
read_rnd_buffer_size = 1M
|
tmp_table_size = 128M
|
max_heap_table_size = 128M
|
|
|
# INNODB #
|
innodb_flush_method = O_DIRECT
|
innodb_log_files_in_group = 2
|
innodb_log_file_size = 128M
|
innodb_flush_log_at_trx_commit = 1
|
innodb_file_per_table = 1
|
innodb_buffer_pool_size = 256M
|
innodb_file_format = Barracuda
|
While using this large amounts of memory, kill -HUP reports:
|
kill -HUP output |
Status information:
|
Current dir: /var/lib/mysql/
|
Running threads: 7 Stack size: 295936
|
Current locks:
|
lock: 0x..... x 310 (not sure why as it wasn't used for at least 5 minutes)
|
Key caches:
|
default
|
Buffer_size: 16777216
|
Block_size: 1024
|
Division_limit: 100
|
Age_threshold: 300
|
Partitions: 0
|
blocks used: 2343
|
not flushed: 0
|
w_requests: 0
|
writes: 0
|
r_requests: 2419
|
reads: 2373
|
handler status:
|
read_key: 978837919
|
read_next: 16508505368
|
read_rnd 5907627
|
read_first: 161861
|
write: 4646891
|
delete 19459252
|
update: 3334376
|
Table status:
|
Opened tables: 5672
|
Open tables: 350
|
Open files: 80
|
Open streams: 0
|
Alarm status:
|
Active alarms: 0
|
Max used alarms: 0
|
Next alarm time: 0
|
Memory status:
|
Non-mmapped space allocated from system: 0
|
Number of free chunks: 1
|
Number of fastbin blocks: 0
|
Number of mmapped regions: 0
|
Space in mmapped regions: 0
|
Maximum total allocated space: 0
|
Space available in freed fastbin blocks: 0
|
Total allocated space: 0
|
Total free space: 0
|
Top-most, releasable space: 0
|
Estimated memory (with thread stack): 2071552
|
Events status:
|
LLA = Last Locked At LUA = Last Unlocked At
|
WOC = Waiting On Condition DL = Data Locked
|
Event scheduler status:
|
State : INITIALIZED
|
Thread id : 0
|
LLA : n/a:0
|
LUA : n/a:0
|
WOC : NO
|
Workers : 0
|
Executed : 0
|
Data locked: NO
|
Event queue status:
|
Element count : 0
|
Data locked : NO
|
Attempting lock : NO
|
LLA : init_queue:140
|
LUA : init_queue:150
|
WOC : NO
|
Next activation : never
|
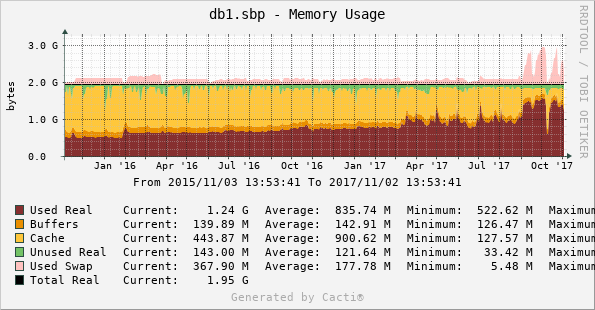
I'm attaching our cacti-graph to illustrate the issue - you can clearly see the various releases mixed with restarts and OOM kills. Mysql itself doesn't report the usage so I think it is leaking somewhere.