Details
-
Bug
-
Status: Closed (View Workflow)
-
 Critical
-
Resolution: Fixed
-
23.02.18, 23.08.14, 24.02.9, 25.01.7, 25.10.3
-
None
-
MXS-SPRINT-275
Description
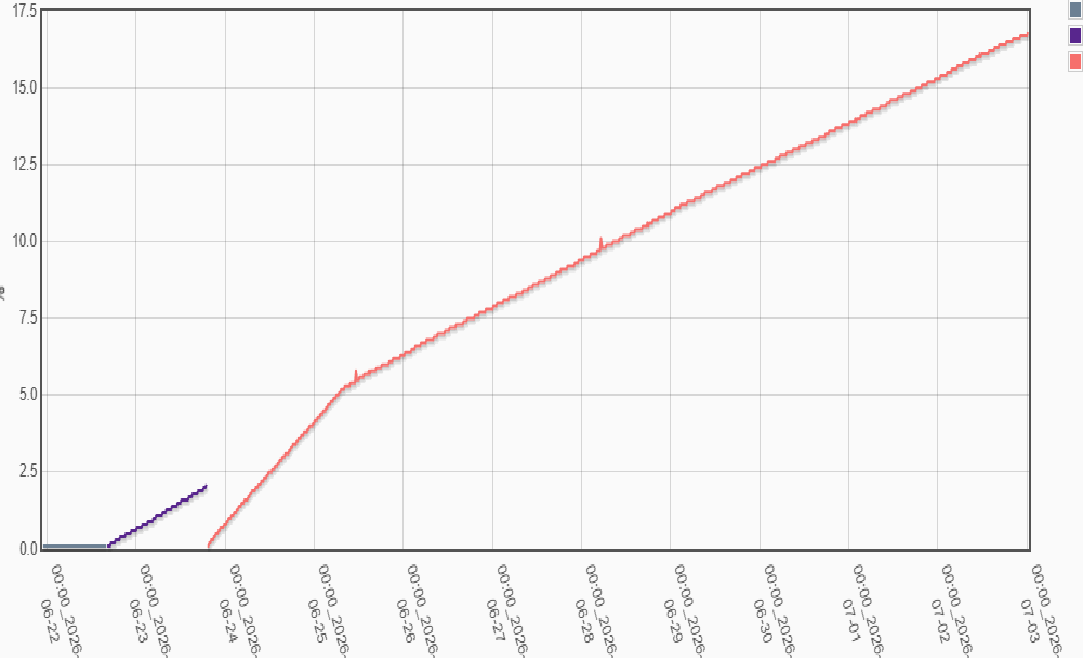
We are using maxscale for its cdc functionality with avrorouter. In this setup was running for almost a week with multiple insert / delete operations happening in the setup. The memory utilization on this setup for maxscale has been growing gradually and now it is almost 1.4G. In this state, the container will surely see a OOM in sometime.
This is the configuration:
[maxscale]
|
threads=4 |
log_debug=yes
|
|
|
[dbserver]
|
type=server
|
address=dbmariadb.database.svc.cluster.local
|
port=3306 |
protocol=MariaDBBackend
|
monitoruser=maxscale
|
monitorpw=dummy_pwd
|
|
|
# Monitor for the servers |
[MariaDB-Monitor]
|
type=monitor
|
module=mariadbmon
|
servers=dbserver
|
user=maxscale
|
password=dummy_pwd
|
monitor_interval=1m
|
|
|
[cdc-service]
|
type=service
|
router=avrorouter
|
servers=dbserver
|
server_id=01 |
user=maxscale
|
password=dummy_pwd
|
block_size=6M
|
group_rows=20 |
gtid_start_pos=newest
|
wait_timeout=0s
|
|
|
[cdc-listener]
|
type=listener
|
service=cdc-service
|
protocol=CDC
|
port=4001 |
|
On this mariadb instance there are insert / delete operations for which cdc-client is getting the events. There are not errors in the maxscale logs :
2026-06-24 00:01:47 notice : MaxScale is running in process 47 |
2026-06-24 00:01:47 notice : MariaDB MaxScale 24.02.9 started (Commit: c1d0b4c0bac614cf761568407801fee6f4a7b506) |
2026-06-24 00:01:47 notice : Configuration file: /tmp/maxscale/maxscale.cnf |
2026-06-24 00:01:47 notice : Log directory: /var/log/maxscale |
2026-06-24 00:01:47 notice : Data directory: /tmp/maxscale |
2026-06-24 00:01:47 notice : Module directory: /usr/lib64/maxscale |
|
|
2026-06-24 00:01:47 notice : Service cache: /tmp/maxscale |
Configuration file : /tmp/maxscale/maxscale.cnf
|
Log directory : /var/log/maxscale
|
Data directory : /tmp/maxscale
|
Module directory : /usr/lib64/maxscale
|
Service cache : /tmp/maxscale
|
|
|
2026-06-24 00:01:47 notice : Query classification results are cached and reused. Memory used per thread: 18.85GiB |
2026-06-24 00:01:47 notice : Using encrypted passwords. Encryption key read from '/tmp/maxscale/.secrets'. |
2026-06-24 00:01:47 notice : Module 'pp_sqlite' loaded from '/usr/lib64/maxscale/libpp_sqlite.so'. |
2026-06-24 00:01:47 notice : [MariaDBProtocol] Parser plugin loaded. |
2026-06-24 00:01:47 notice : [avrorouter] (cdc-service); Replicating directly from a primary server |
2026-06-24 00:01:47 notice : [avrorouter] (cdc-service); Avro files stored at: /tmp/maxscale |
2026-06-24 00:01:47 notice : (cdc-listener); Module 'CDC' loaded from '/usr/lib64/maxscale/libcdc.so'. |
2026-06-24 00:01:47 notice : Using HS256 for JWT signatures |
2026-06-24 00:01:47 notice : Server dbserver hostname 'nrd-db-mariadb.nrd.svc.cluster.local' resolved to 10.254.89.223. |
2026-06-24 00:01:47 warning: The MaxScale GUI is enabled but encryption for the REST API is not enabled, the GUI will not be enabled. Configure `admin_ssl_key` and `admin_ssl_cert` to enable HTTPS or add `admin_secure_gui=false` to allow use of the GUI without encryption. |
2026-06-24 00:01:47 notice : Started REST API on [127.0.0.1]:8989 |
2026-06-24 00:01:47 notice : dbserver sent version string '11.4.9-MariaDB-log'. Detected type: MariaDB, version: 11.4.9. |
2026-06-24 00:01:47 notice : Server 'dbserver' charset: utf8mb3_unicode_ci |
2026-06-24 00:01:47 notice : Starting a total of 1 services... |
2026-06-24 00:01:47 notice : (cdc-listener); Listening for connections at [::]:4001 |
2026-06-24 00:01:47 notice : Service 'cdc-service' started (1/1) |
2026-06-24 00:01:47 notice : MaxScale started with 4 worker threads. |
2026-06-24 00:01:47 notice : Continuing from GTID '0-1-2657547,1-1-3' |
2026-06-24 00:01:47 notice : Started replicating from 'dbserver' at GTID '0-1-2657547,1-1-3' |
2026-06-24 00:01:52 error : Failed to read replicated event: 4052, A slave with the same server_uuid/server_id is already connected; the first event '.' at 0, the last event read from 'mysql-bin.000015' at 133639877, the last byte read from 'mysql-bin.000015' at 133639908. |
2026-06-24 00:01:57 notice : Started replicating from 'dbserver' at GTID '0-1-2658568,1-1-3' |
2026-06-24 00:02:02 error : Failed to read replicated event: 4052, A slave with the same server_uuid/server_id is already connected; the first event '.' at 0, the last event read from 'mysql-bin.000015' at 137140249, the last byte read from 'mysql-bin.000015' at 137140280. |
2026-06-24 00:02:07 notice : Started replicating from 'dbserver' at GTID '0-1-2660761,1-1-3' |
|
# kubectl top pod -n testing--containers --sort-by=memory
|
POD NAME CPU(cores) MEMORY(bytes)
|
testdb-v1-79c5d55d55-vxjph maxscale 25m 1324Mi
|
testdb-v1-79c5d55d55-vxjph cdc-client 8m 9Mi
|
|