Uploaded image for project: 'MariaDB MaxScale'
  1. MariaDB MaxScale
  2. MXS-4059

Make query editor visualization feature easier to use

    XMLWordPrintable

Details

    • Bug
    • Status: Closed (View Workflow)
    • Major
    • Resolution: Fixed
    • 6.2.1
    • 6.3.1
    • maxgui
    • None
    • MXS-SPRINT-154, MXS-SPRINT-155

    Description

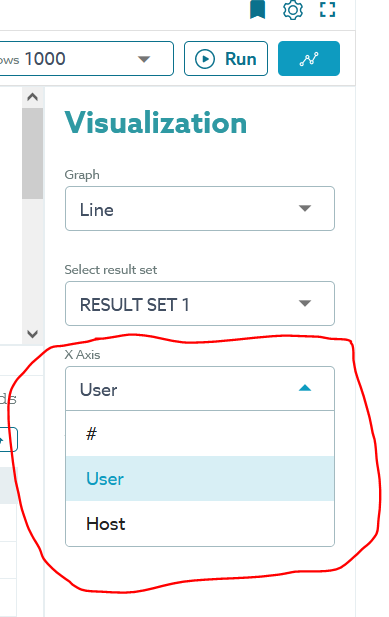
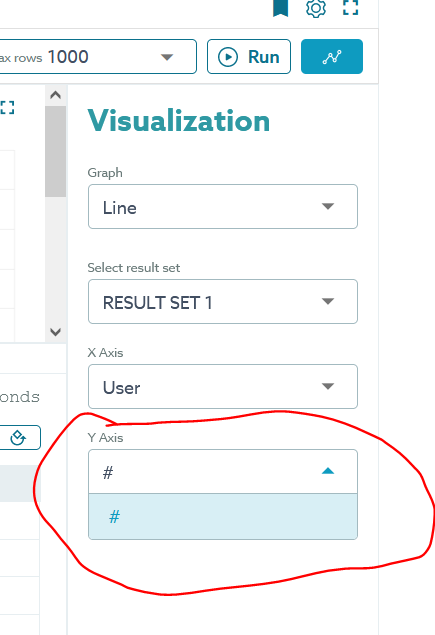
      In the query editor, if we try to visualize the data, when we select the y-axis list, but we don't see all the columns list in the y-axis but we can able to see all the columns in the x-axis list.

      Actual Result set columns Are:

      X-Axis:

      Y-Axis:

      If the X-Axis value is a number and the Y-Axis value is a string, the graph should recognize and auto-revert the graph accordingly if it's possible.
      If the X-Axis value is a string and the Y-Axis value is a number or if both X-Axis and Y-Axis values are numbers, draw the graph normally.
      If both axes' values are strings, the graph would still be drawn but the value for the X-axis will be the index value.

      Attachments

        1. image-2022-03-24-12-23-01-517.png
          26 kB
          Naresh Chandra
        2. image-2022-03-24-12-23-36-528.png
          28 kB
          Naresh Chandra
        3. image-2022-03-24-12-24-18-010.png
          4 kB
          Naresh Chandra

        Issue Links

          Activity

            People

              thien.ly Duong Thien Ly
              naresh.chandra@copart.com Naresh Chandra
              Votes:
              0 Vote for this issue
              Watchers:
              2 Start watching this issue

              Dates

                Created:
                Updated:
                Resolved:

                Git Integration

                  Error rendering 'com.xiplink.jira.git.jira_git_plugin:git-issue-webpanel'. Please contact your Jira administrators.