Uploaded image for project: 'MariaDB MaxScale'
  1. MariaDB MaxScale
  2. MXS-4031

Show query execution time separately and total execution time separately

Details

    • Task
    • Status: Closed (View Workflow)
    • Major
    • Resolution: Fixed
    • None
    • 23.08.1
    • maxgui
    • None
    • MXS-SPRINT-190

    Description

      Show query execution time separately and total execution time separately. Other wise developers thinking that its total query execution time. so please implement them separate tab.

      Development team actually checking the slow query stats, so they want know how much time its actually taking, so they need actual query execution time.

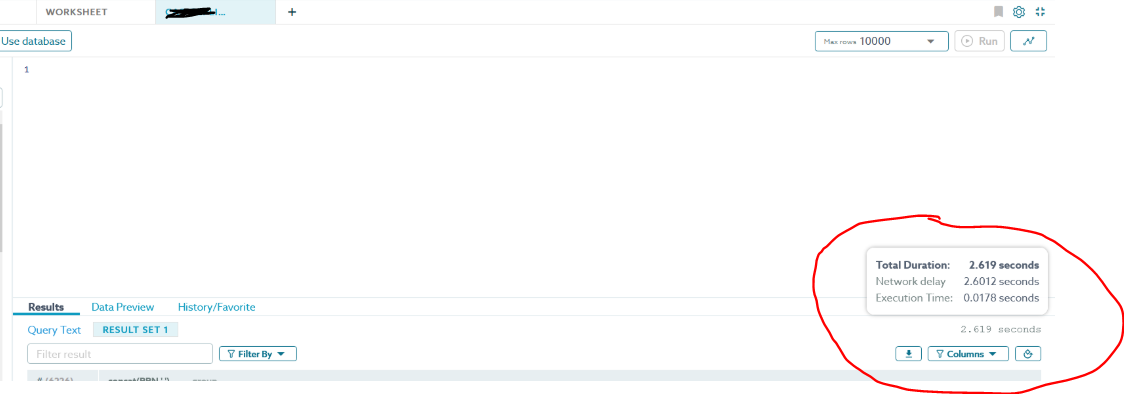
      Current Query Editor:

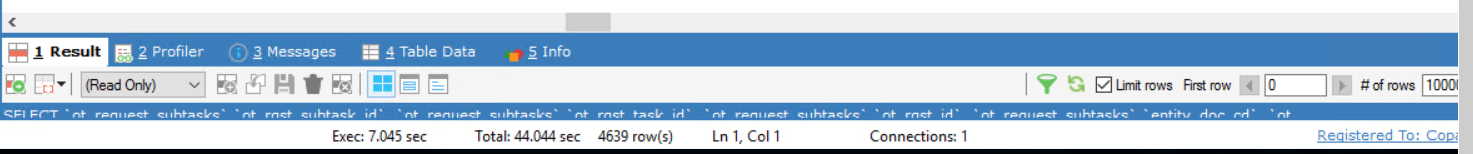
      Expecting Results Like SQLyog Below:

      Attachments

        Activity

          Hi Todd,

          Can we take up this feature in the 22 version as the developers are getting confused the actual execution time and n/w delay time, actually the are expecting like SQL yog.

          naresh.chandra@copart.com Naresh Chandra added a comment - Hi Todd, Can we take up this feature in the 22 version as the developers are getting confused the actual execution time and n/w delay time, actually the are expecting like SQL yog.

          People

            thien.ly Thien Ly
            naresh.chandra@copart.com Naresh Chandra
            Votes:
            0 Vote for this issue
            Watchers:
            1 Start watching this issue

            Dates

              Created:
              Updated:
              Resolved:

              Git Integration

                Error rendering 'com.xiplink.jira.git.jira_git_plugin:git-issue-webpanel'. Please contact your Jira administrators.