Details
-
Bug
-
Status: Open (View Workflow)
-
 Minor
Minor
-
Resolution: Unresolved
-
5.2.14
-
None
-
None
Description
Hi there
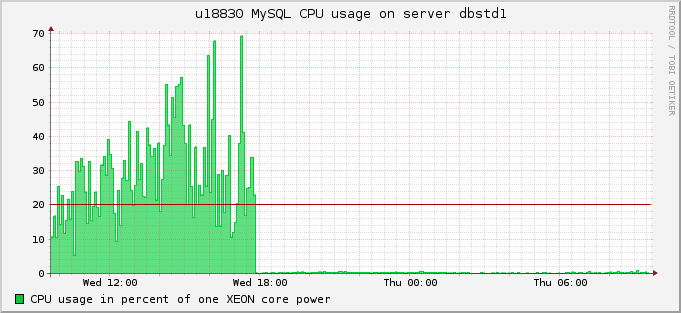
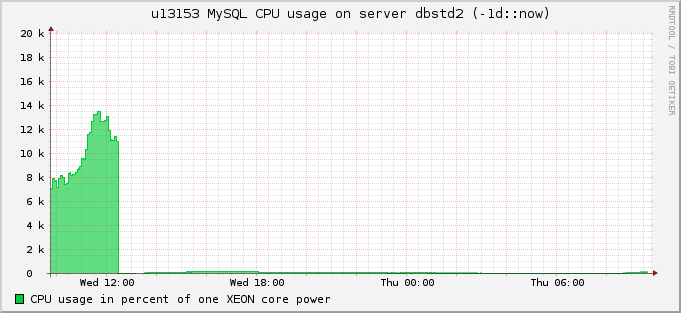
We collect user statistics and run "SELECT * FROM INFORMATION_SCHEMA.USER_STATISTICS; FLUSH USER_STATISTICS" every 5 minutes and then put received values to rrd databases. We noticed that after some uptime CPU_TIME counter goes mad and starts to show incredibly high usage values. After restarting MariaDB process it goes back to normal for some time. Please see attached graphs as examples. One can notice a huge drop down of CPU_TIME counter on both graphs. These are graphs for a random customer from two different MariaDB servers.
Platform used: Debian Squeeze amd64, MariaDB 5.2.12-MariaDB-mariadb115~squeeze-log from official package.