Details
-
Bug
-
Status: Needs Feedback (View Workflow)
-
 Critical
-
Resolution: Unresolved
-
12.0.1
-
None
-
None
-
* CPU: 2 x Intel Xeon Gold 6430; server and its threads pinned to CPU 17, client pinned to CPU 15.
* OS: Ubuntu 22.04.2 LTS, Linux 5.15.130-0515130-generic; glibc 2.35.
* Build: GCC 11.4, RelWithDebInfo (-O2 -g -DNDEBUG), identical build settings for both unmodified commits. Both binaries identify as MariaDB 12.0.1.
* Server: --no-defaults, UNIX socket only, UTC time zone; InnoDB with a 128 MiB buffer pool, innodb_flush_log_at_trx_commit=1, O_DIRECT, and a 96 MiB redo log. Binary logging and the query cache were disabled.* CPU: 2 x Intel Xeon Gold 6430; server and its threads pinned to CPU 17, client pinned to CPU 15. * OS: Ubuntu 22.04.2 LTS, Linux 5.15.130-0515130-generic; glibc 2.35. * Build: GCC 11.4, RelWithDebInfo (-O2 -g -DNDEBUG), identical build settings for both unmodified commits. Both binaries identify as MariaDB 12.0.1. * Server: --no-defaults, UNIX socket only, UTC time zone; InnoDB with a 128 MiB buffer pool, innodb_flush_log_at_trx_commit=1, O_DIRECT, and a 96 MiB redo log. Binary logging and the query cache were disabled.
-
Related to performance
-
Performance regression in SELECT queries with joins, GROUP BY, and ORDER BY after commit ecb7c9b6.
Description
After commit ecb7c9b6 (MDEV-10164), MariaDB takes approximately 4.1% longer to execute the following SELECT workload:
SELECT DISTINCT u.username, COUNT(p.id) AS post_count |
FROM users u, posts p |
WHERE u.id = p.user_id |
AND p.created_at BETWEEN '2025-01-01' AND '2025-12-31' |
GROUP BY u.username |
ORDER BY post_count DESC |
LIMIT 5;
|
We compared the commit itself with its immediate predecessor:
Before: 86ec20189abaf0b07150a0d73c6d6e0f2a3f4780
|
After: ecb7c9b692811f96cfa54add61012a701c47523d
|
We tested it using mariadb-slap (mysqlslap), with the SQL above assigned to mariaDB_inst and SOCKET set to the test server's UNIX socket:
taskset -c 15 mariadb-slap --no-defaults \
|
--concurrency=1 --iterations=1 --create-schema=test \ |
--query="$mariaDB_inst" -uroot --socket="$SOCKET" \ |
--number-of-queries=10000 --no-drop
|
Before each run, we restored the same clean dataset, verified its checksums, and executed 100 warm-up queries. We used the same client binary for both server versions. The following is the original output from the first pair of runs; these measurements were taken without perf attached.
Before ecb7c9b6:
Benchmark
|
Average number of seconds to run all queries: 24.149 seconds
|
Minimum number of seconds to run all queries: 24.149 seconds
|
Maximum number of seconds to run all queries: 24.149 seconds
|
Number of clients running queries: 1
|
Average number of queries per client: 10000
|
After ecb7c9b6:
Benchmark
|
Average number of seconds to run all queries: 25.057 seconds
|
Minimum number of seconds to run all queries: 25.057 seconds
|
Maximum number of seconds to run all queries: 25.057 seconds
|
Number of clients running queries: 1
|
Average number of queries per client: 10000
|
We repeated the comparison for eight pairs, alternating the execution order between before/after and after/before. The elapsed times for 10,000 queries were:
Pair Before (seconds) After (seconds)
|
1 24.149 25.057
|
2 24.028 25.081
|
3 24.044 25.125
|
4 24.044 25.080
|
5 24.037 25.010
|
6 24.051 25.097
|
7 24.076 25.054
|
8 24.169 25.017
|
Mean 24.07475 25.065125
|
The new version was slower in all eight pairs. The geometric mean of the paired elapsed-time ratios indicates a 4.114% increase, with a 95% confidence interval of 3.830% to 4.399% (Student's t interval on the log ratios). This corresponds to a 3.951% throughput decrease.
Both versions produced identical EXPLAIN FORMAT=JSON plans in every pair: a scan of posts, an eq_ref lookup using users.PRIMARY, and a temporary table with filesort for aggregation and ordering. Each measured run executed exactly 10,000 SELECT statements, left the dataset unchanged, and incurred no additional InnoDB buffer-pool disk reads.
The test environment was:
- CPU: 2 x Intel Xeon Gold 6430; server and its threads pinned to CPU 17, client pinned to CPU 15.
- OS: Ubuntu 22.04.2 LTS, Linux 5.15.130-0515130-generic; glibc 2.35.
- Build: GCC 11.4, RelWithDebInfo (-O2 -g -DNDEBUG), identical build settings for both unmodified commits. Both binaries identify as MariaDB 12.0.1.
- Server: --no-defaults, UNIX socket only, UTC time zone; InnoDB with a 128 MiB buffer pool, innodb_flush_log_at_trx_commit=1, O_DIRECT, and a 96 MiB redo log. Binary logging and the query cache were disabled.
The database can be pre-populated by creating the test schema and importing the accompanying init.sql followed by insert.sql. We imported both files in full, using UTF-8 (utf8mb4), UTC, and SET timestamp=1735689600 for each import session to make the trigger's NOW() value reproducible. The dataset contains 42,500 rows across eight tables, including 2,500 users and 5,000 posts. No indexes or query conditions were added or changed.
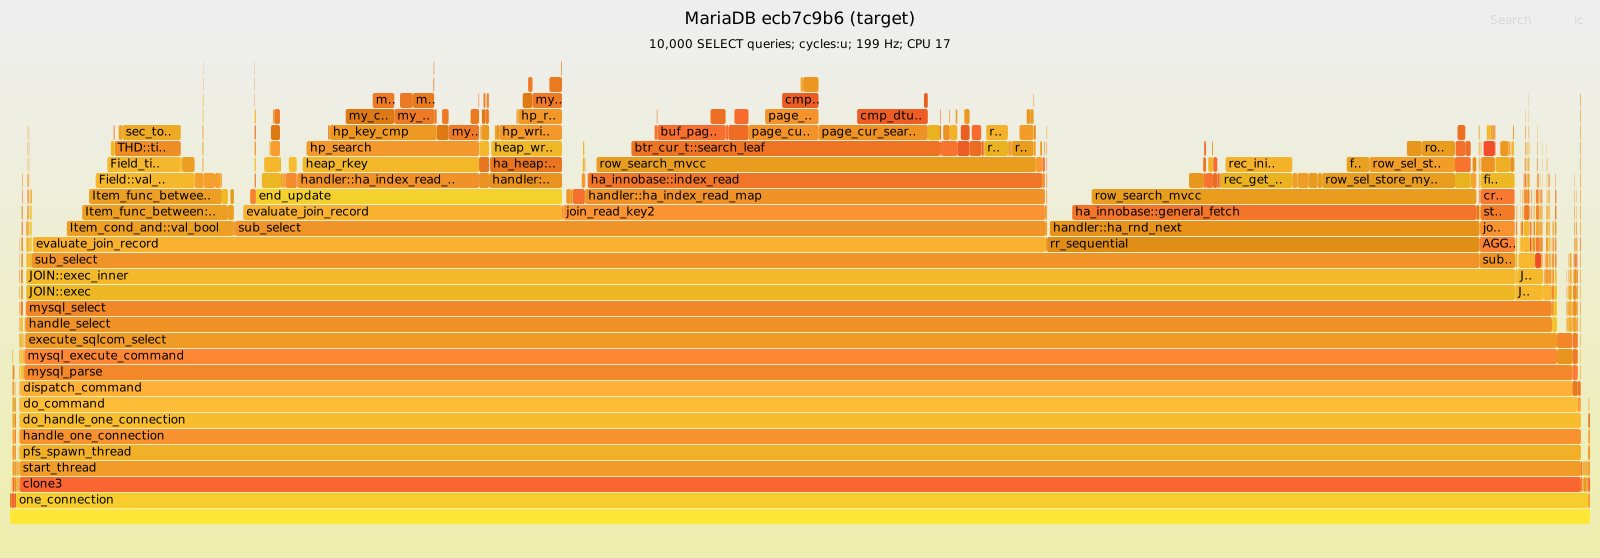
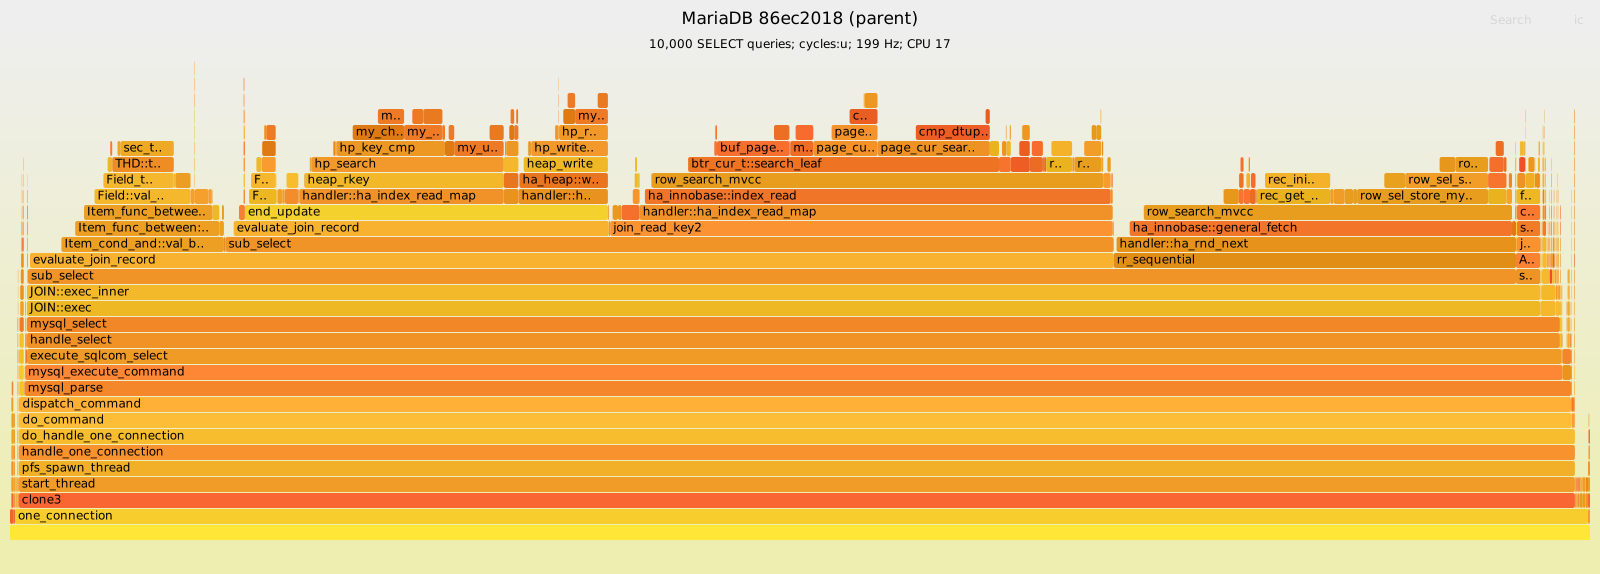
We also collected perf call stacks in separate runs of 10,000 queries per version using:
perf record -g --call-graph dwarf,16384 -e cycles:u -F 199 \
|
-p "$SERVER_PID" -o perf.data |
perf report --stdio --no-inline --children -i perf.data
|
The before/after recordings contain 4,823 and 5,032 samples respectively, with no lost samples reported. The accompanying perf-before.txt and perf-after.txt contain the call-tree reports; issue-2-old.svg and issue-2-new.svg are the corresponding flamegraphs. Reports were generated with --no-inline because inline symbol resolution stalled in addr2line. We have confirmed the end-to-end regression in this configuration, but have not yet isolated its source-level cause.