Details
-
Task
-
Status: Open (View Workflow)
-
 Minor
Minor
-
Resolution: Unresolved
-
None
-
None
Description
This ticket tracks the set of MariaDB server options to be tested for performance impact across OLTP workloads (HammerDB TPROC-C).
The goal is to establish a baseline and measure overhead introduced by durability, replication, charset, flushing, and concurrency-related settings.
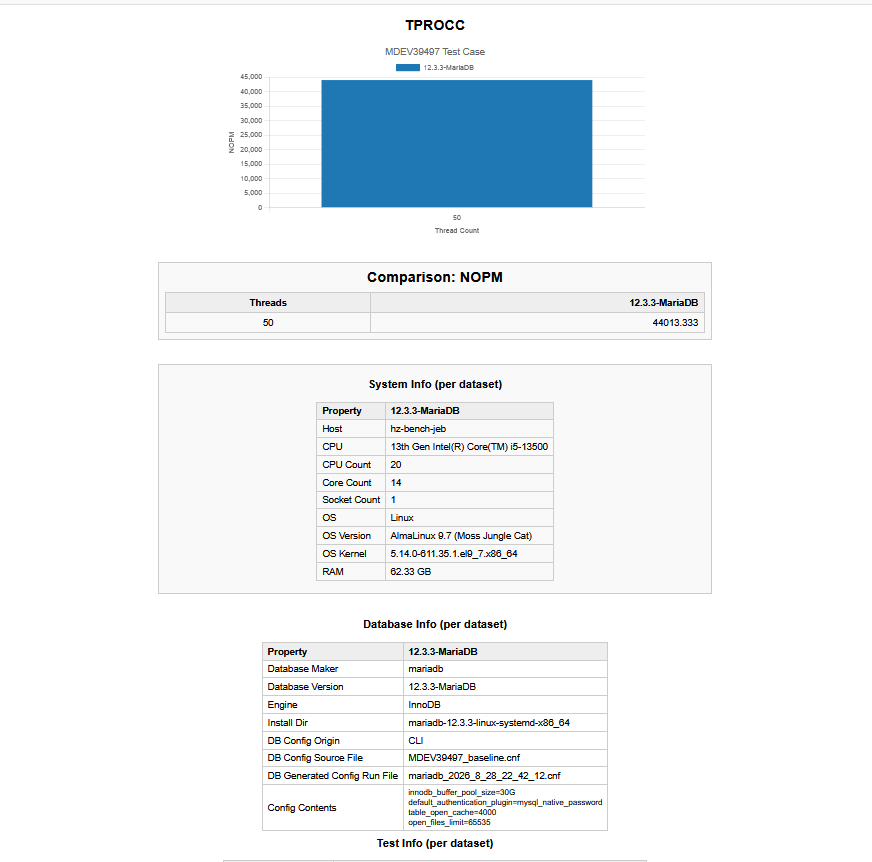
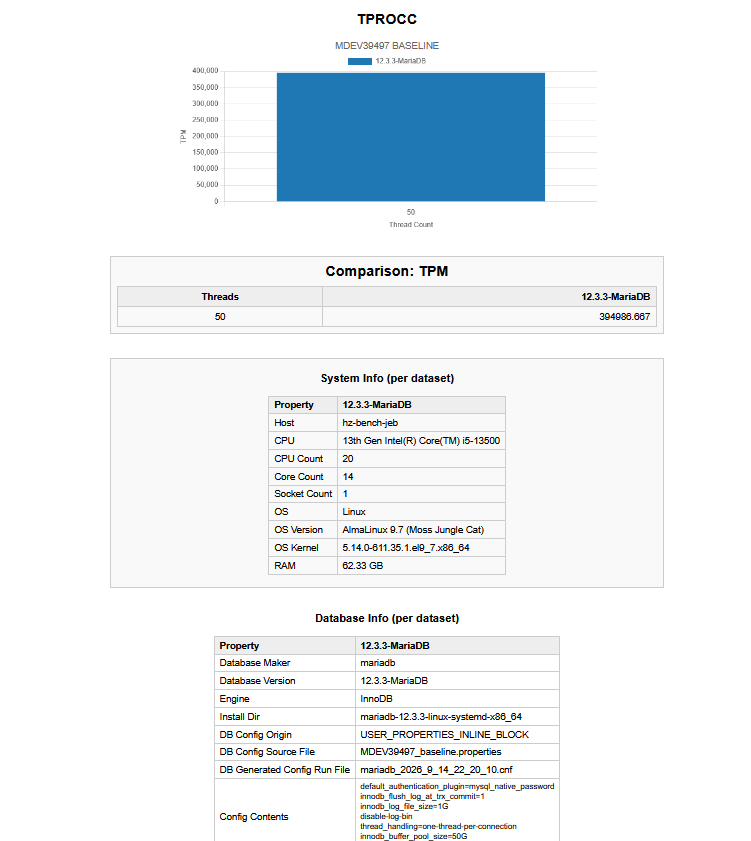
All tests will be compared to a baseline using:
- MariaDB default/recommended options
- crash-safe configuration
- log-bin=0
- innodb_flush_log_at_trx_commit=1
- large buffer pool so all data fits in memory
- One thread per connection
- No ssl
Test workload:
- Suite: HammerDB TPROC-C
- Load: Cached
- Threads: 50
- Warmup: 4 minutes
- Duration: 15 minutes
- Iterations: 3
===============================================================
OPTIONS TO TEST (WITH RATIONALE)
===============================================================
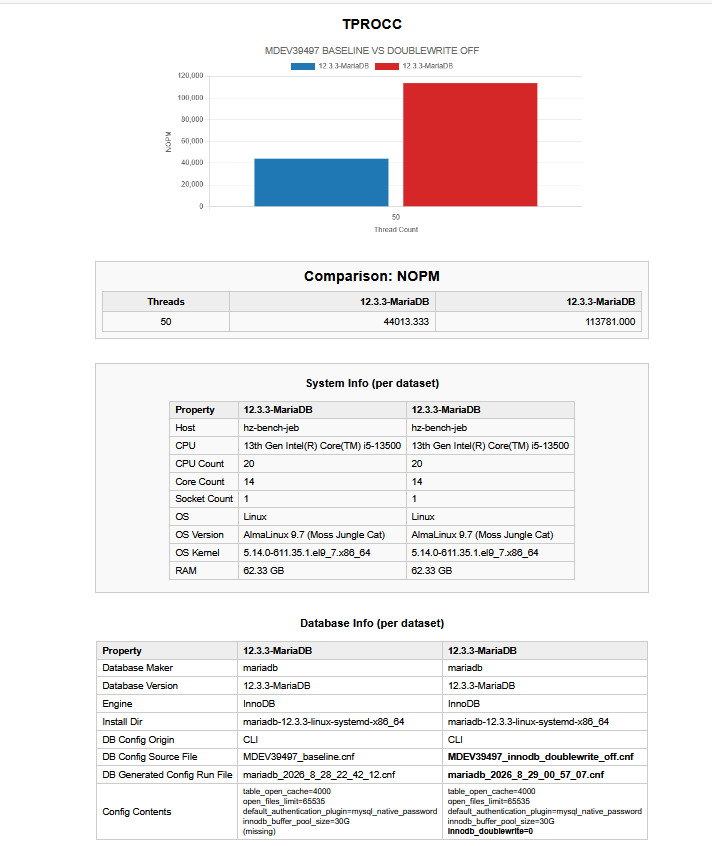
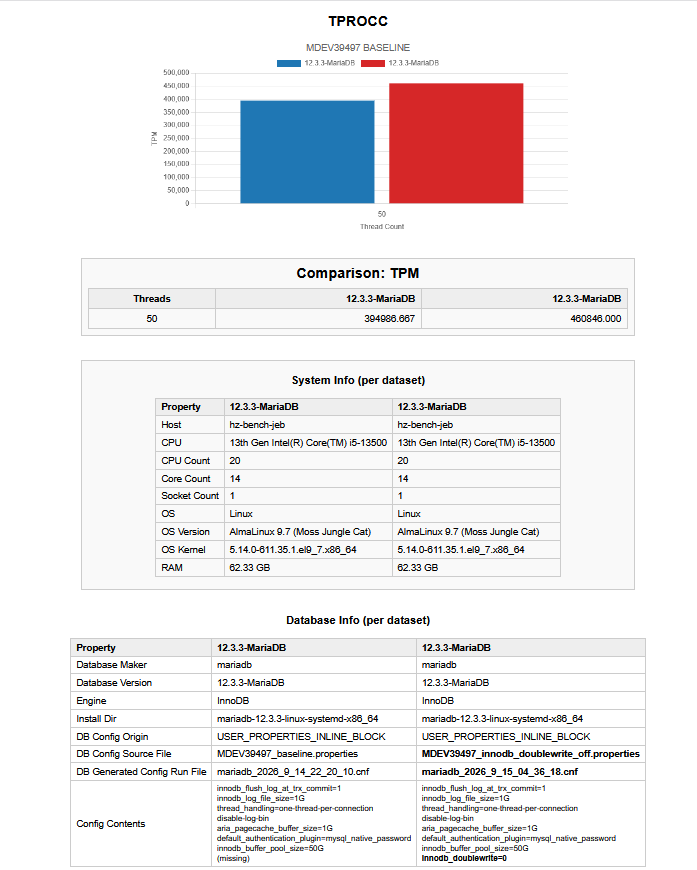
1. innodb_doublewrite
WHY: Crash-safety vs performance. Note double_write is only relevant if server crashes. If MariaDB server crashes there should be no data corruption. A bit safer than innodb_flush_log_at_trx_commit=0 but not recommended.
EXPECTED: OFF is faster, ON is safer.
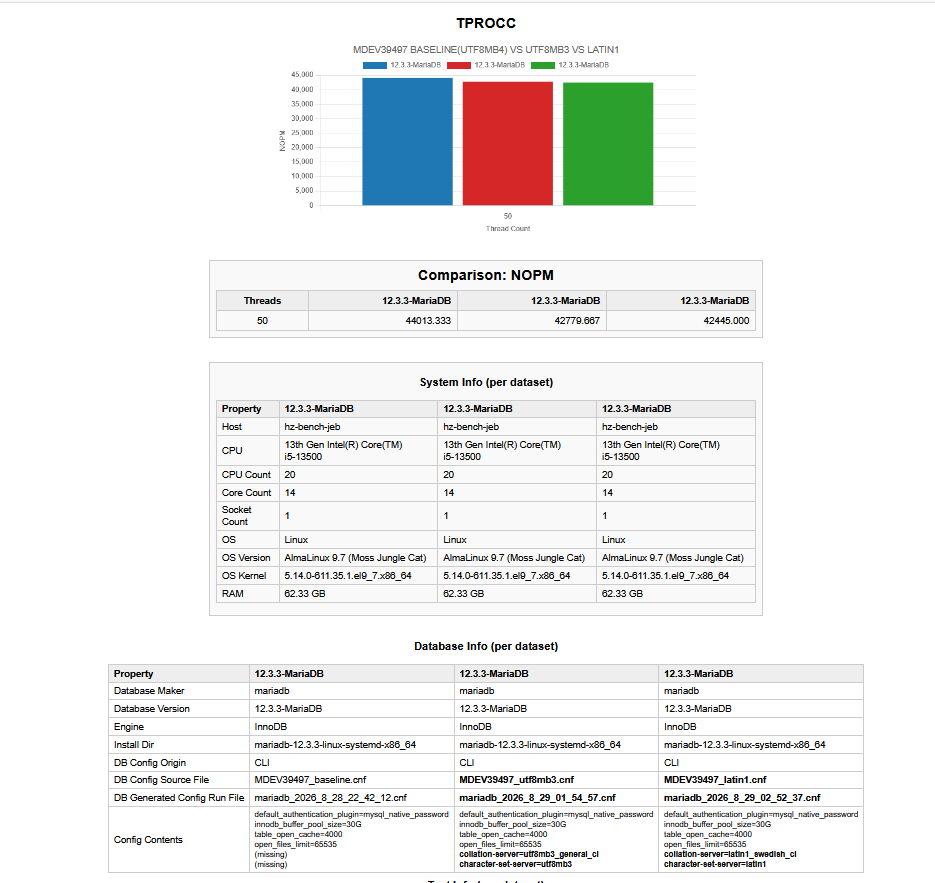
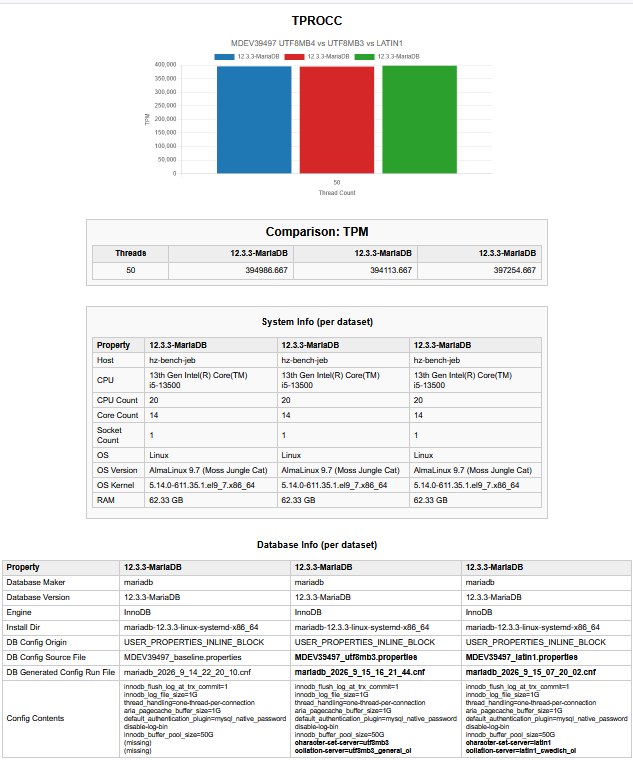
2. character_set_server (latin1 | utf8mb3| utf8mb4)
WHY: Charset affects CPU and index width.
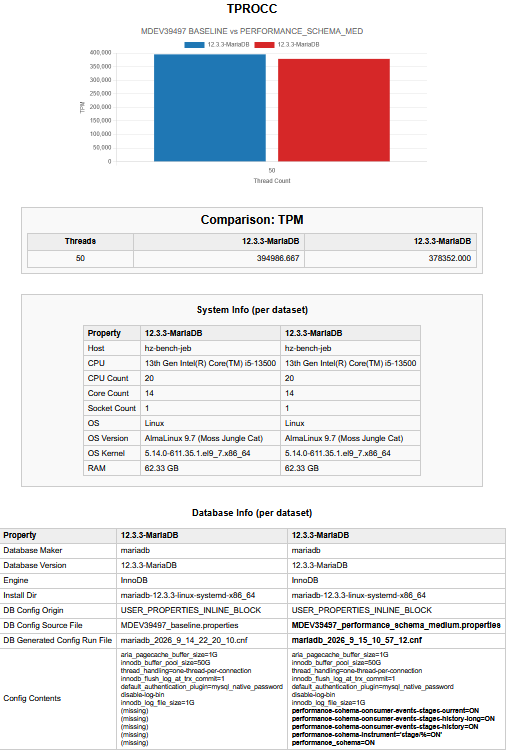
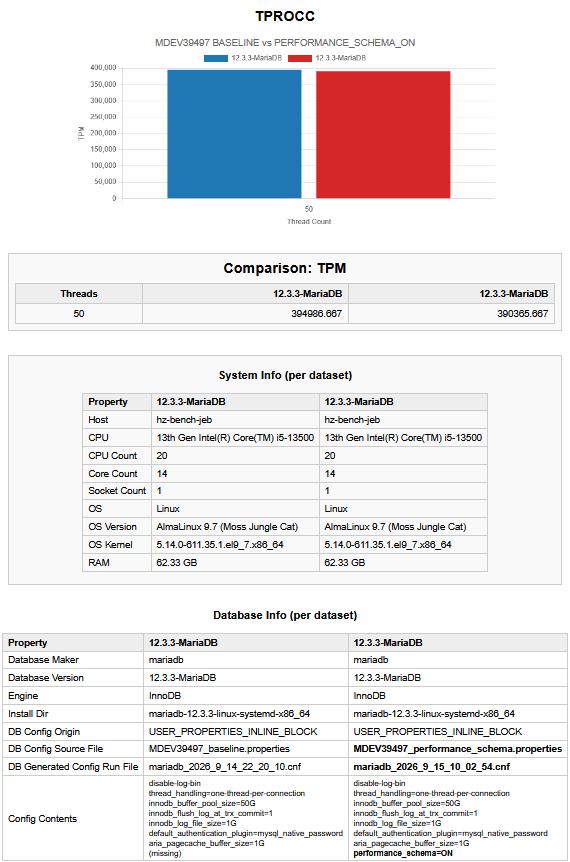
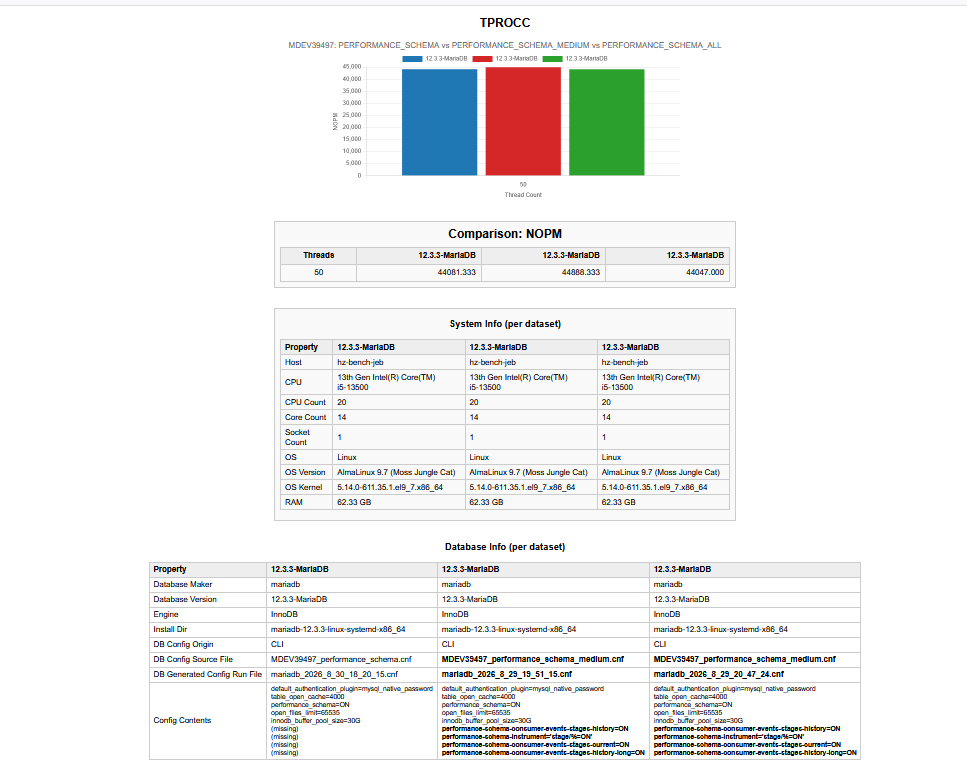
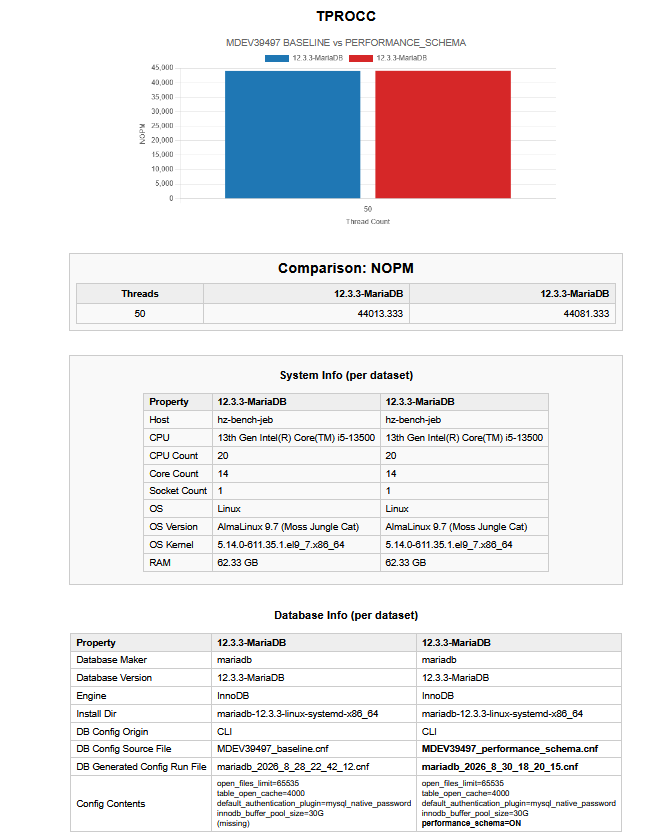
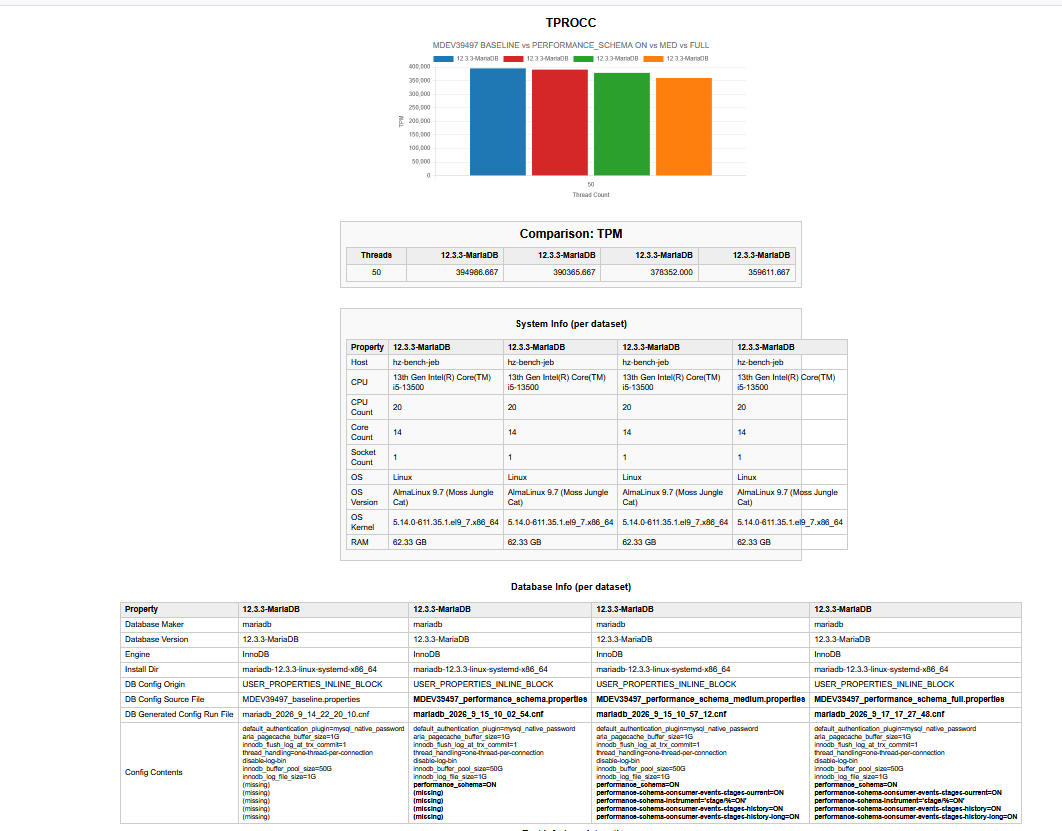
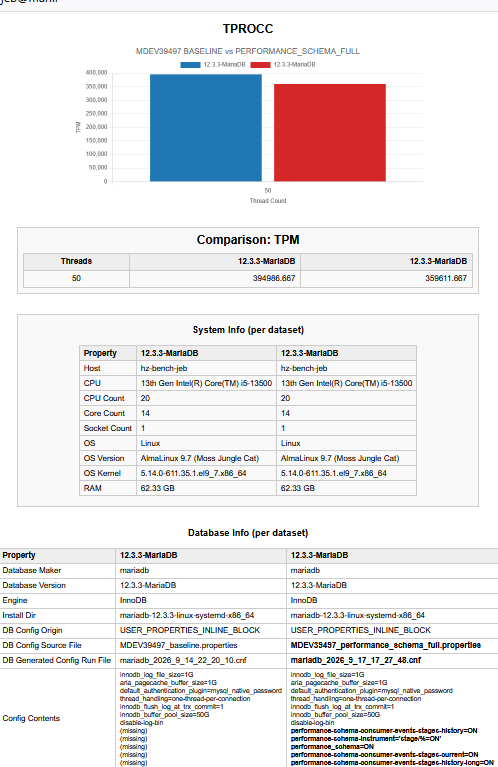
3. performance_schema (ON | OFF)
WHY: Instrumentation overhead.
3a) With default performance schema options:
performance_schema=ON
3b) "Recommended" medium performance schema
performance_schema=ON
performance-schema-instrument='stage/%=ON'
performance-schema-consumer-events-stages-current=ON
performance-schema-consumer-events-stages-history=ON
performance-schema-consumer-events-stages-history-long=ON
3c) All performance schema options enabled
performance_schema=ON
performance-schema-instrument='stage/%=ON'
performance-schema-consumer-events-stages-current=ON
performance-schema-consumer-events-stages-history=ON
performance-schema-consumer-events-stages-history-long=ON
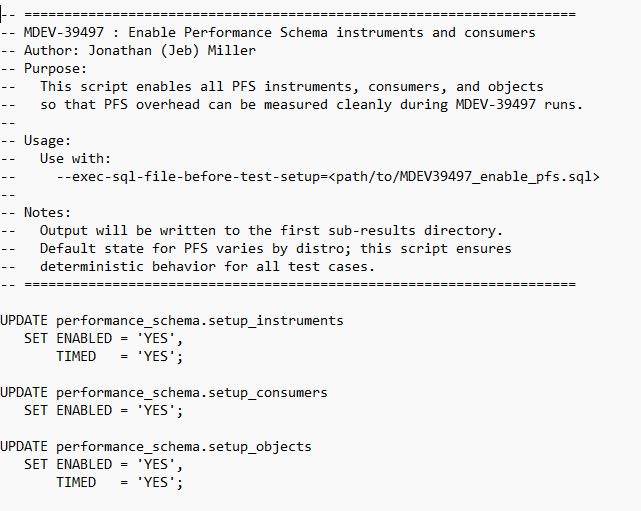
Execute on startup:
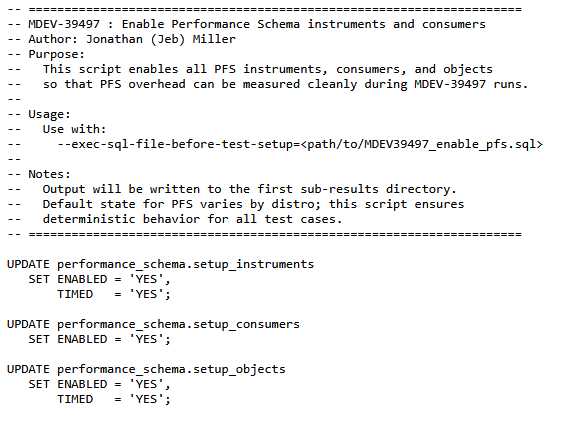
UPDATE performance_schema.setup_instruments SET ENABLED="YES", TIMED="YES";
UPDATE performance_schema.setup_consumers SET ENABLED="YES";
UPDATE performance_schema.setup_objects SET ENABLED="YES", TIMED="YES";
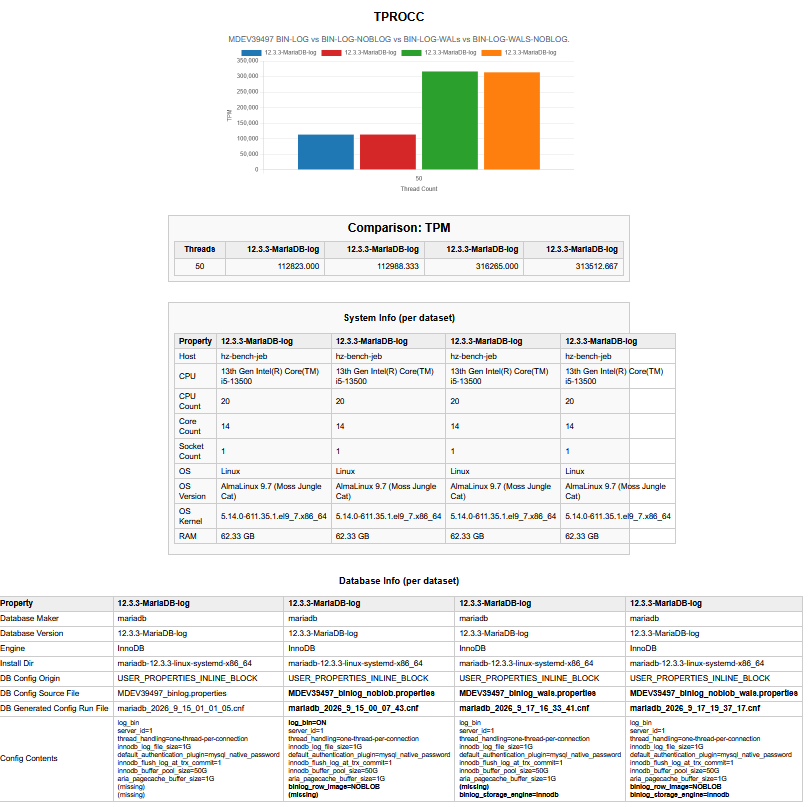
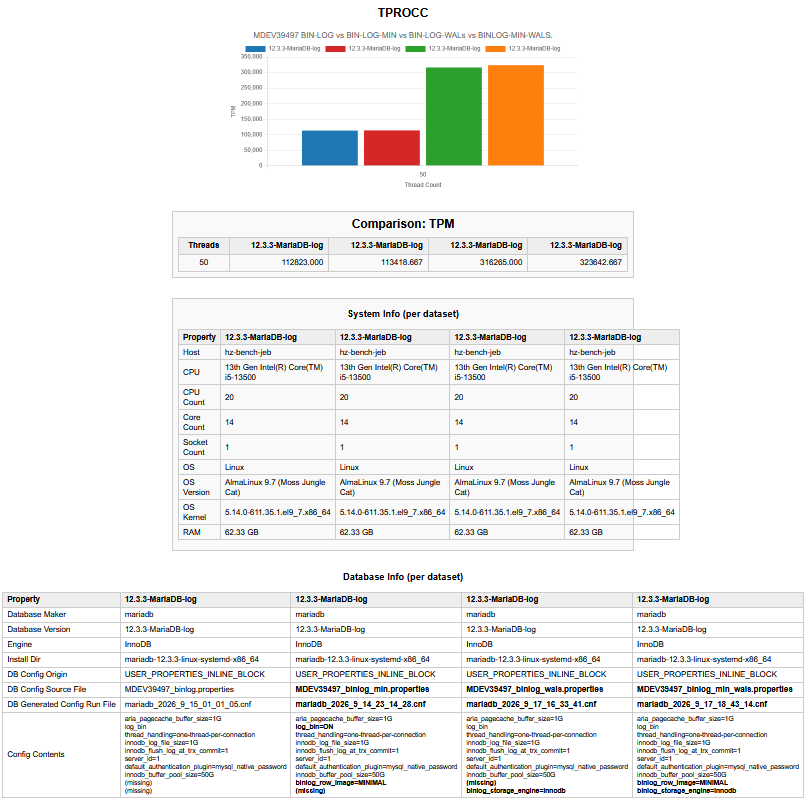
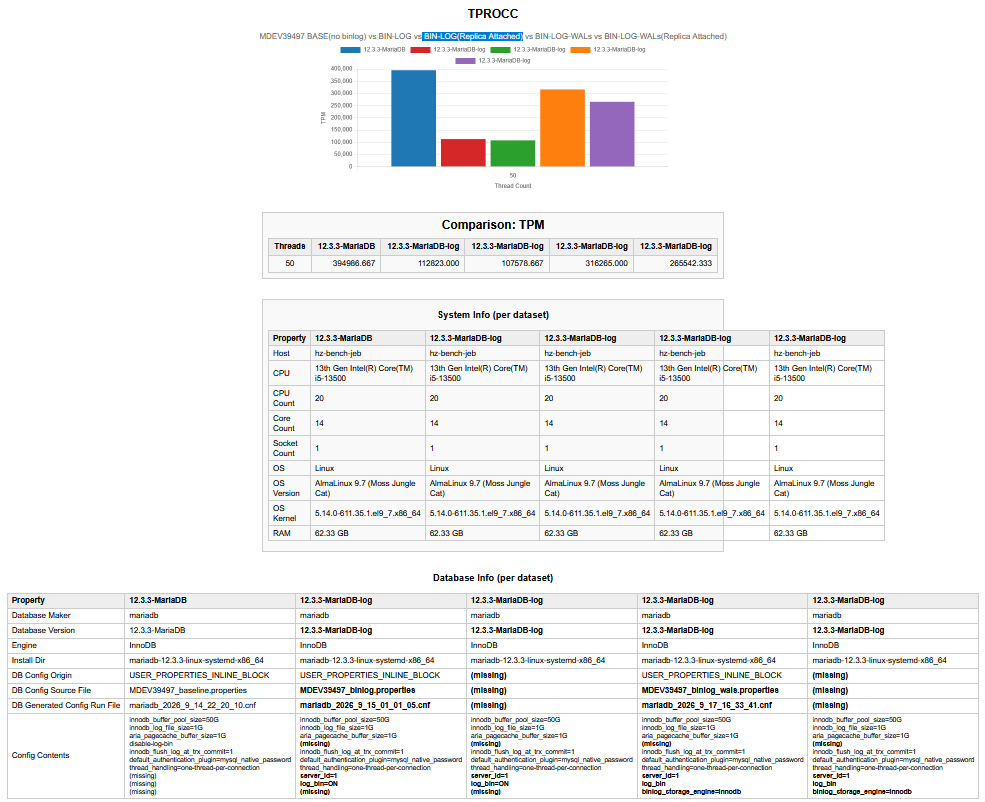
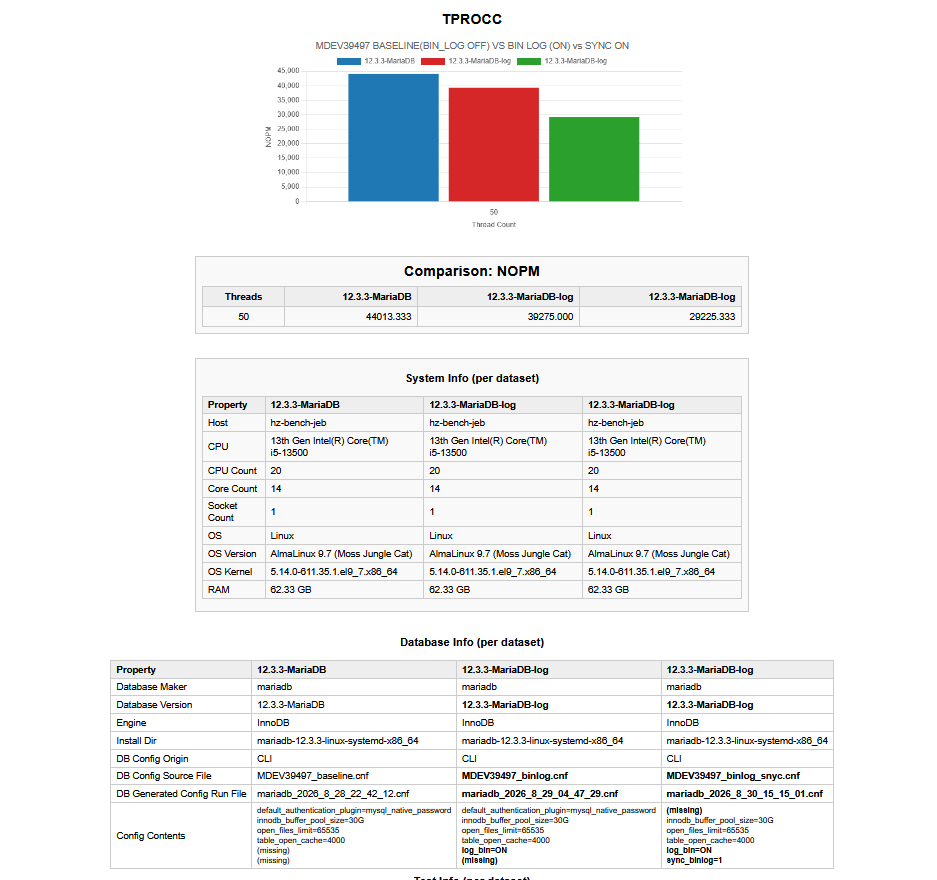
4) Bin Logging
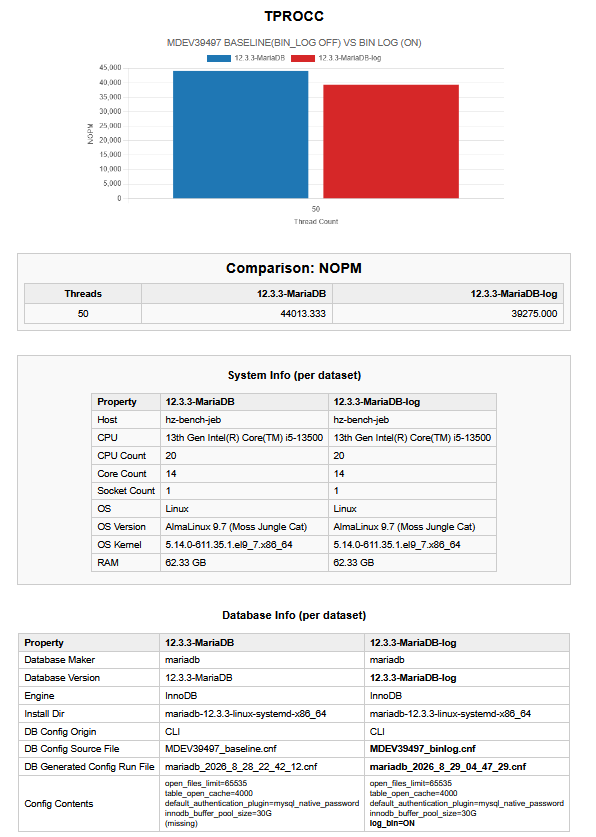
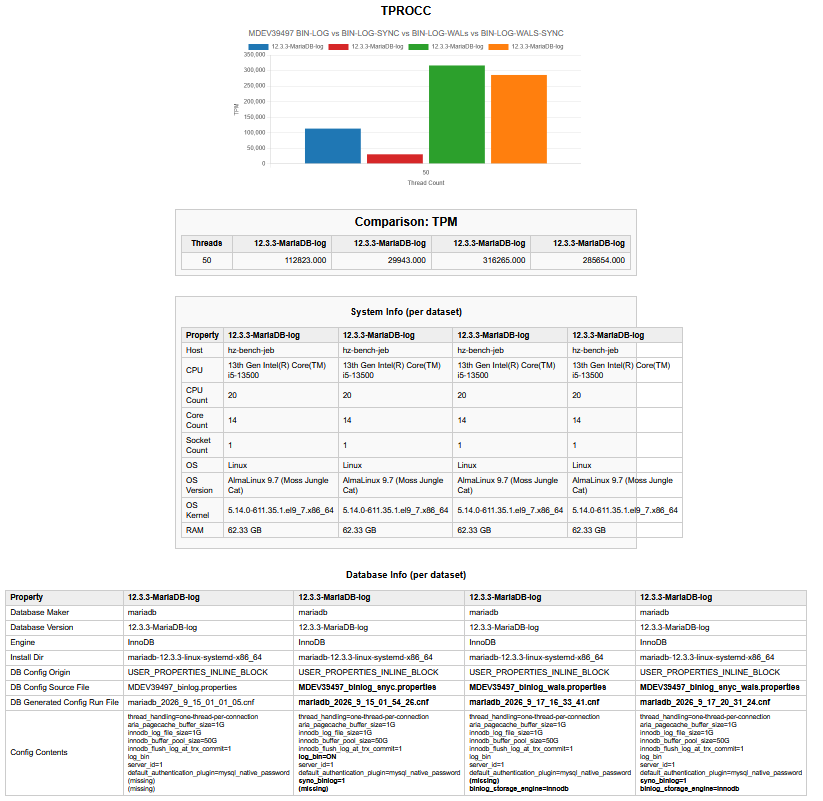
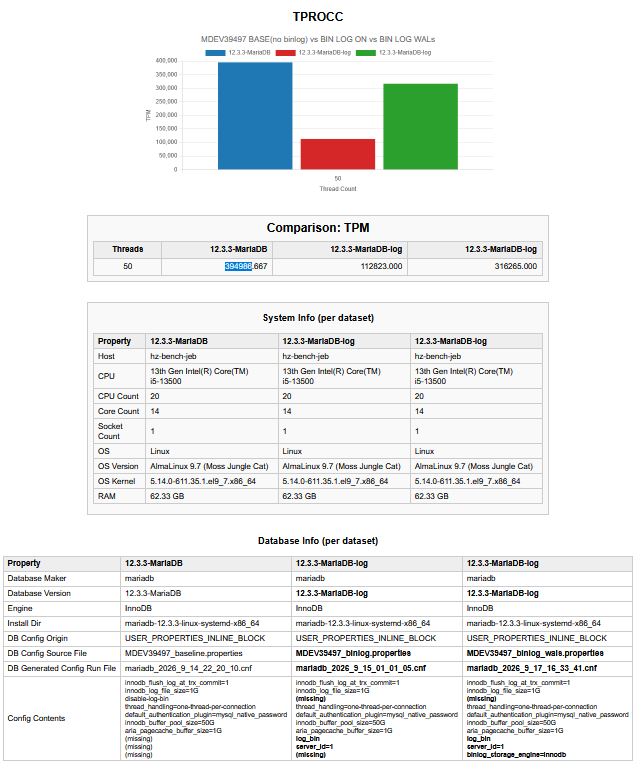
4a) log-bin (1)
WHY: Baseline cost of enabling replication/PITR.
Note that for this test we do not need to have a slave (The impact of having a slave should be neglectable. Should be proven with a separate replication test)
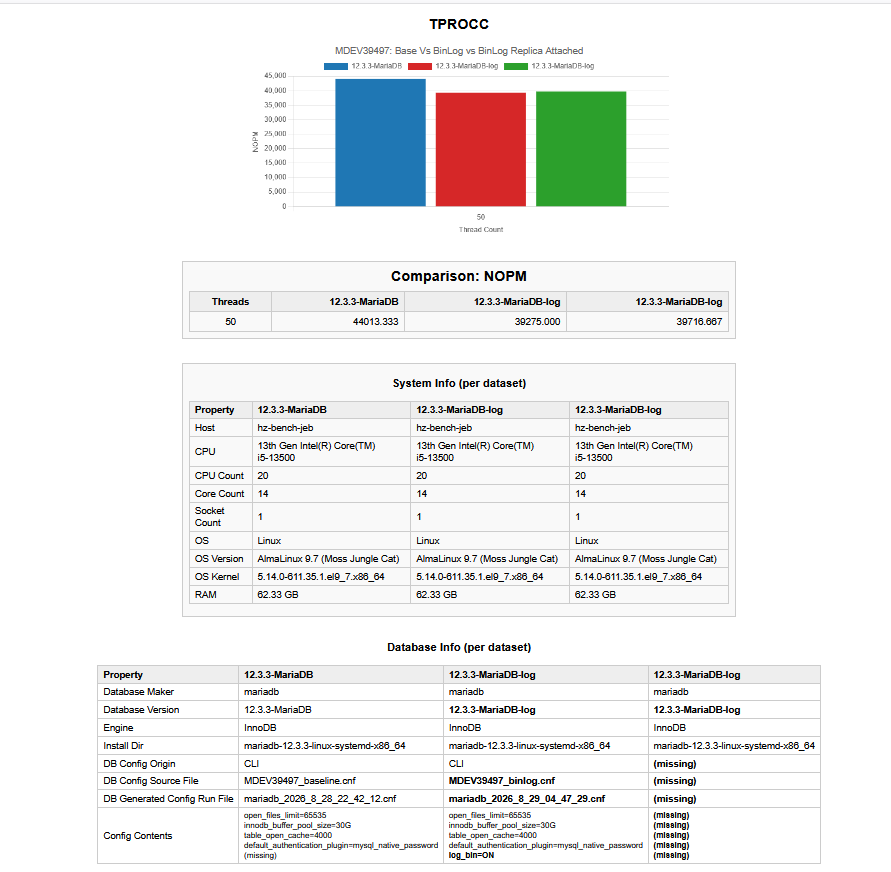
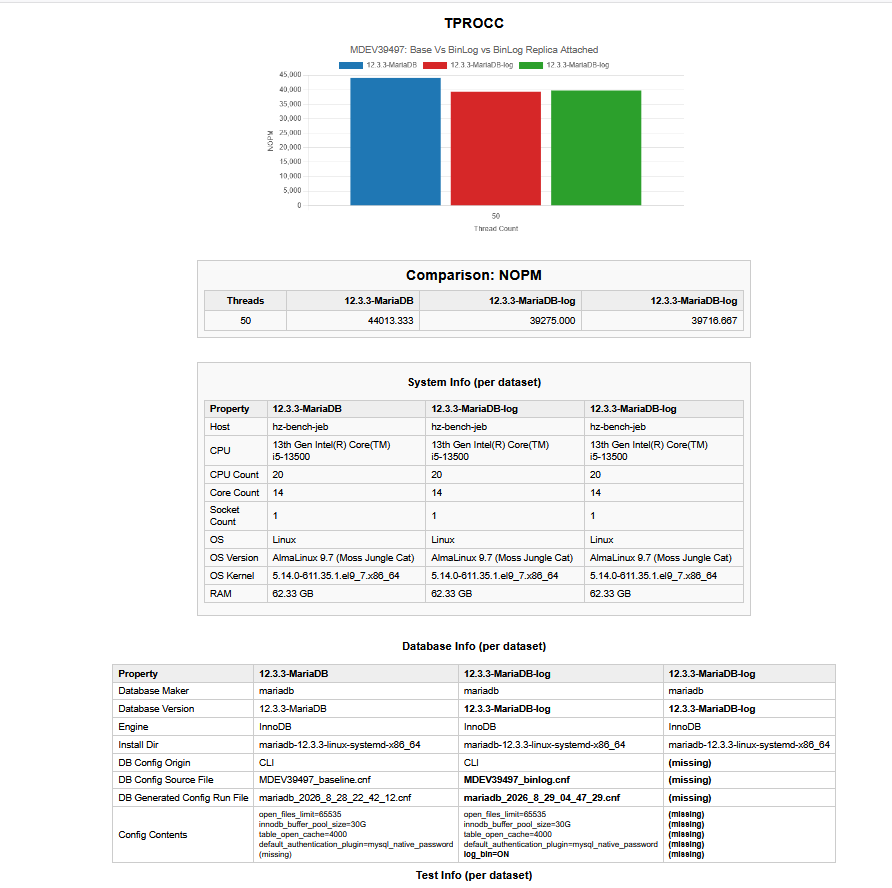
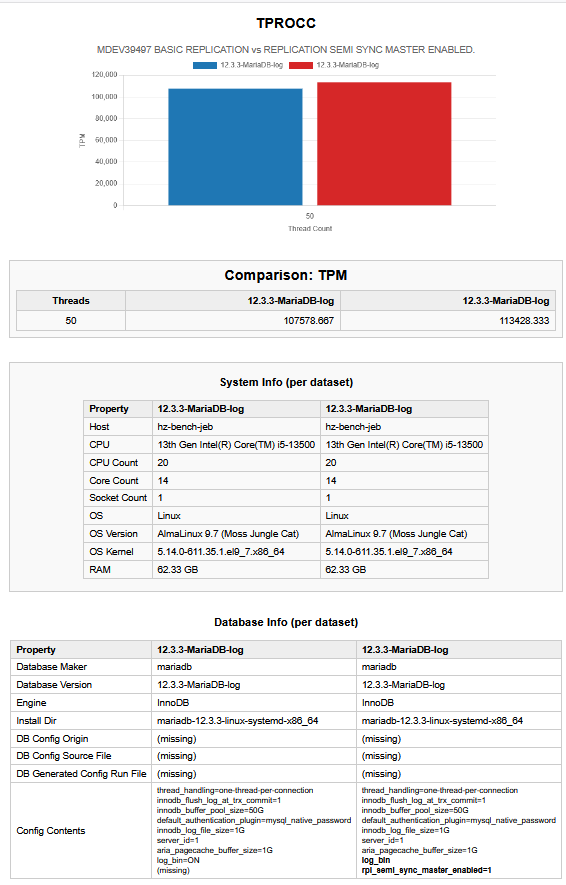
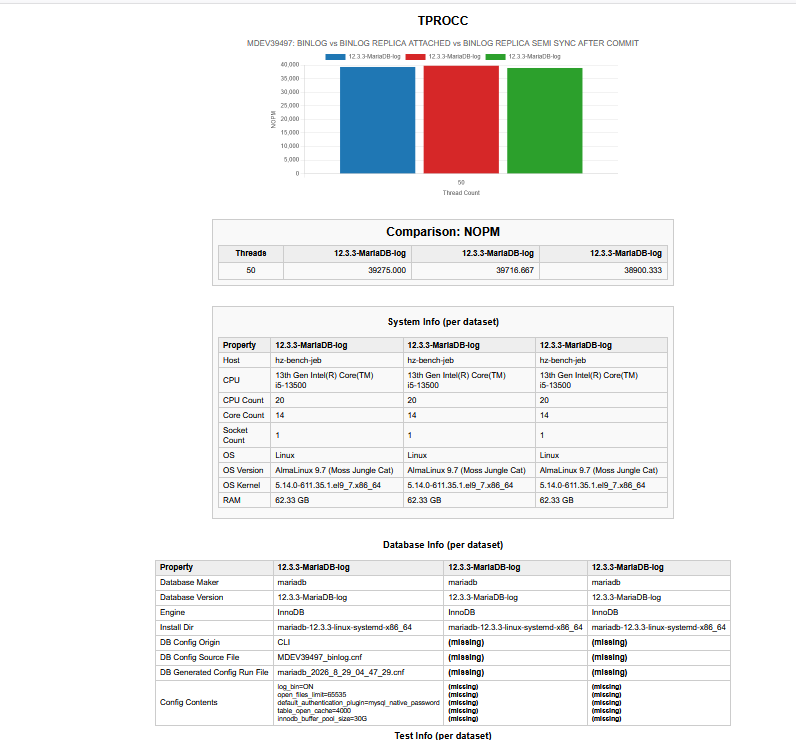
4b) With a slave attached
- The assumption is that the slave should have no noticeable impact on the master.
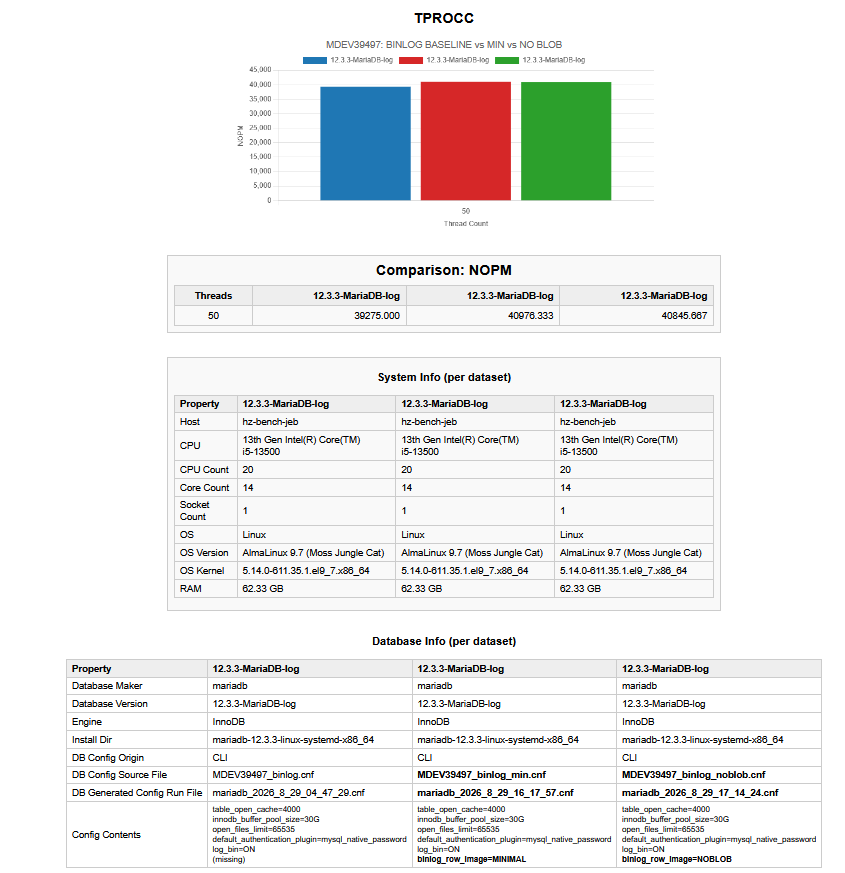
4c). binlog_row_image (FULL | MINIMAL | NOBLOB) (requires log-bin=1)
WHY: Controls binlog volume.
Note that for this test we do not need to have a slave (The impact of having a slave should be neglectable. Should be proven with a separate replication test)
4d). sync_binlog (0 | 1) (requires log-bin=1)
WHY: Binlog durability cost.
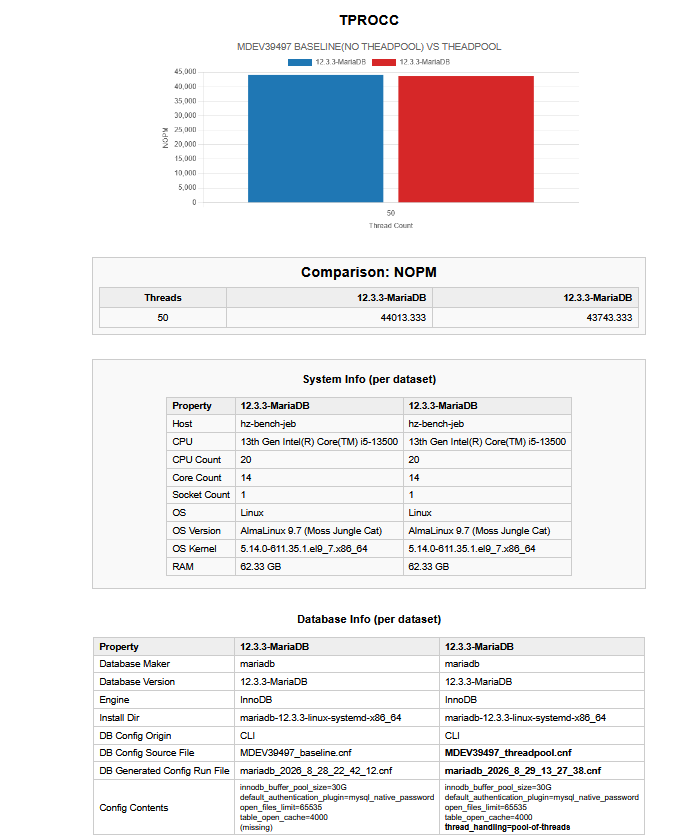
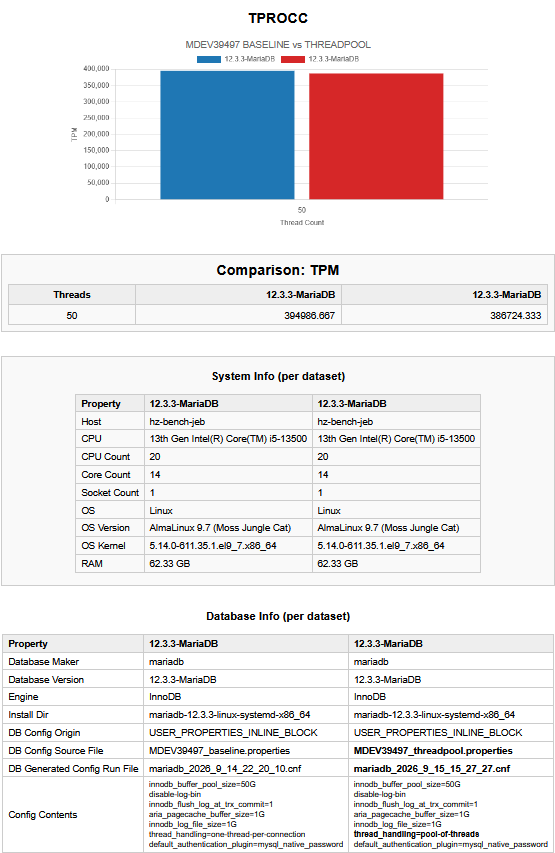
5. thread_handling (one-thread-per-connection | pool-of-threads)
WHY: Thread model scalability.
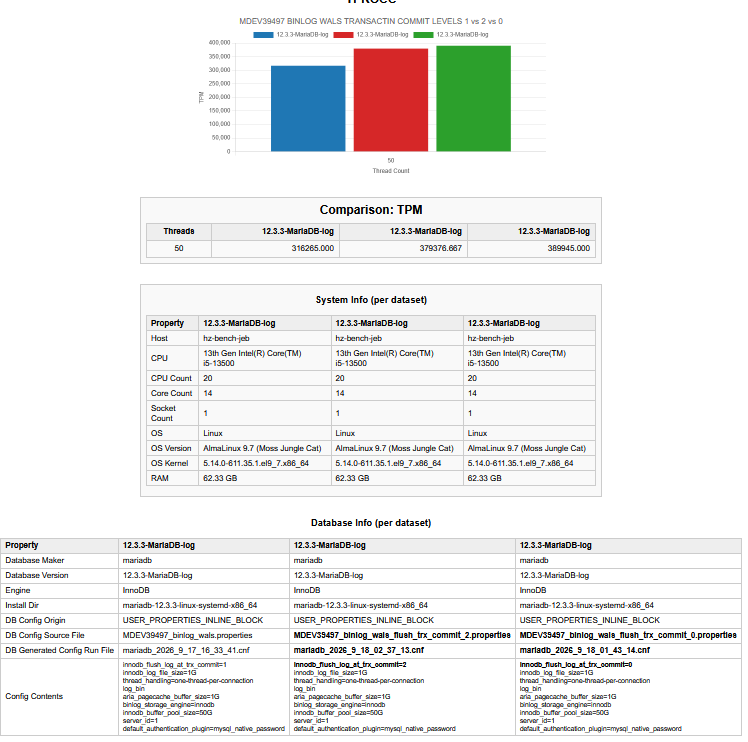
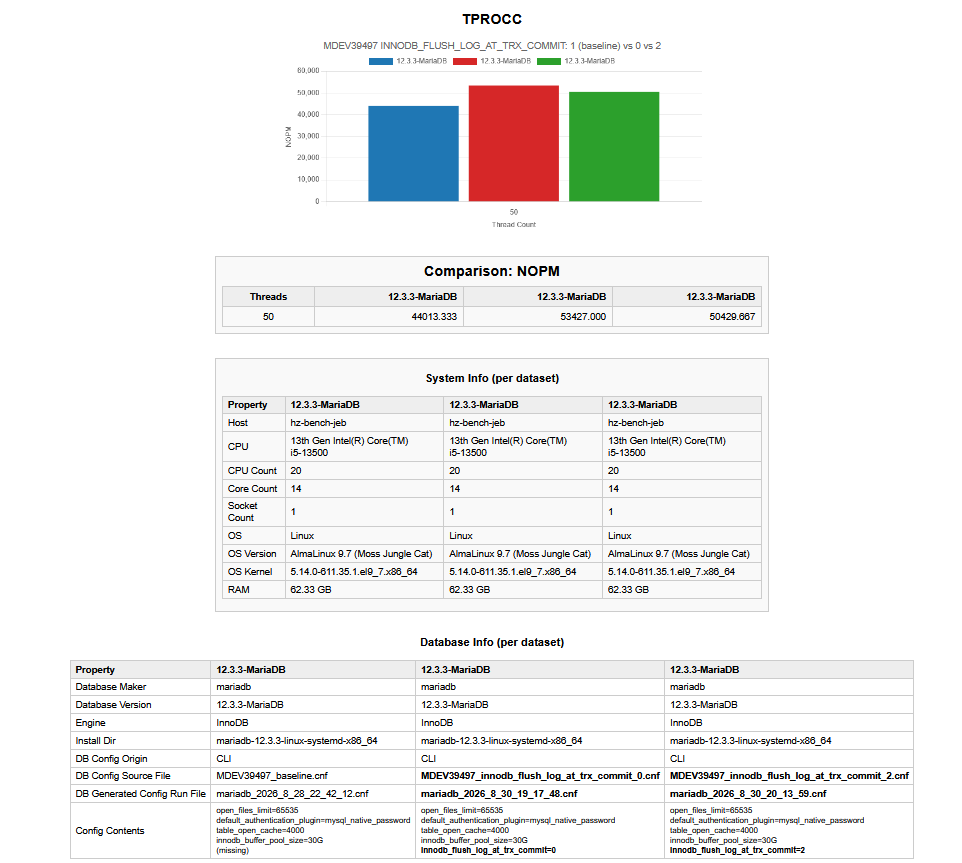
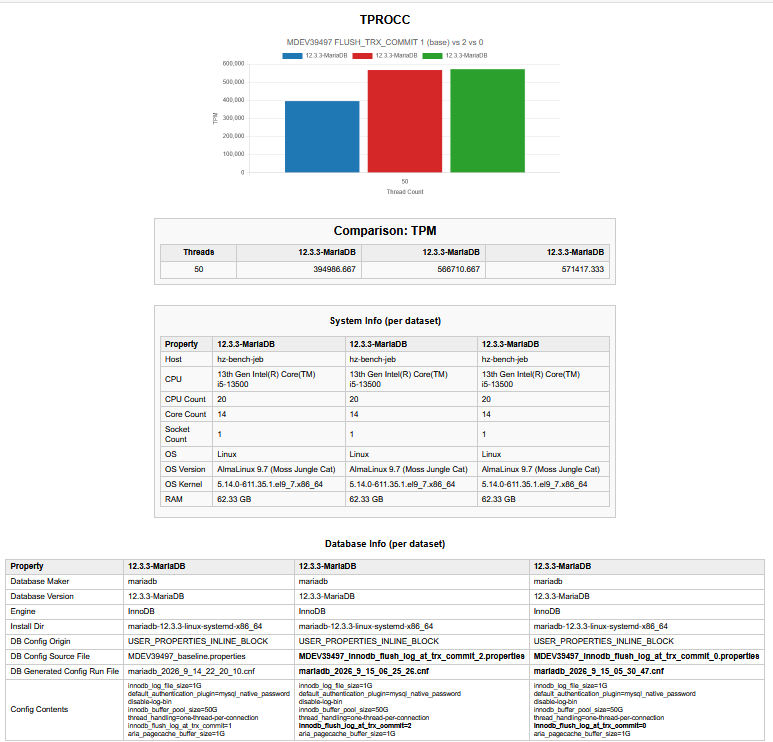
6. innodb_flush_log_at_trx_commit (0 | 1 | 2 )
WHY: Durability vs performance.
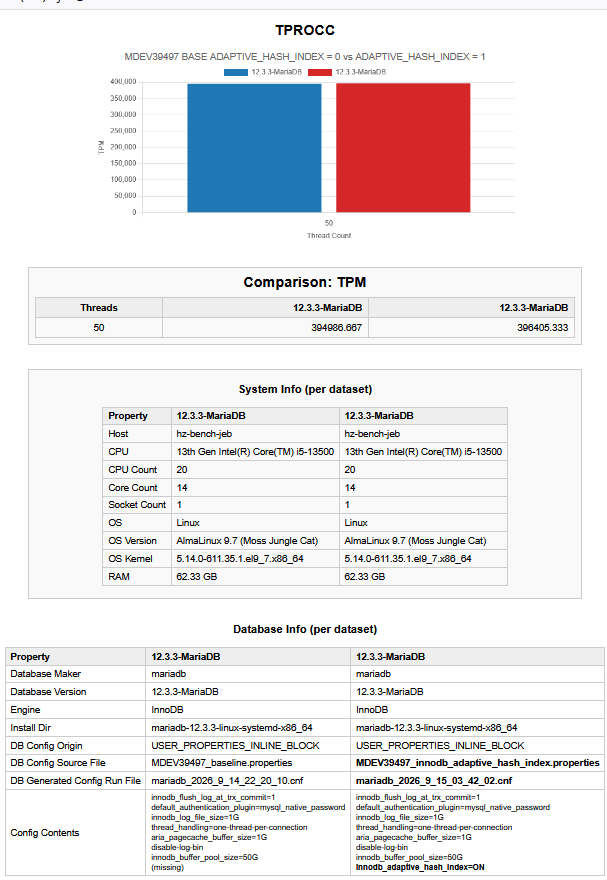
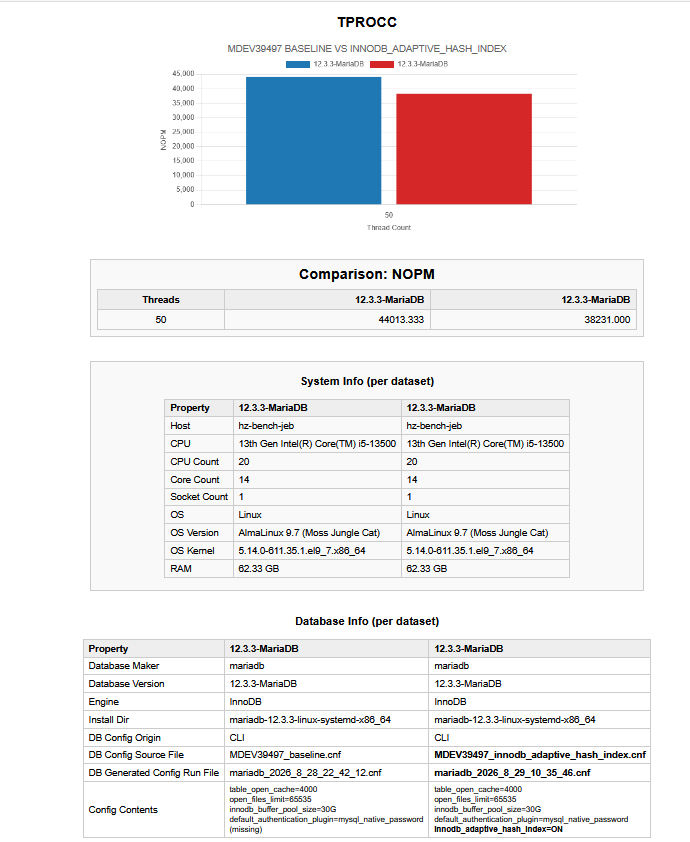
7. innodb_adaptive_hash_index (0 | 1)
WHY: Lookup speed vs contention.
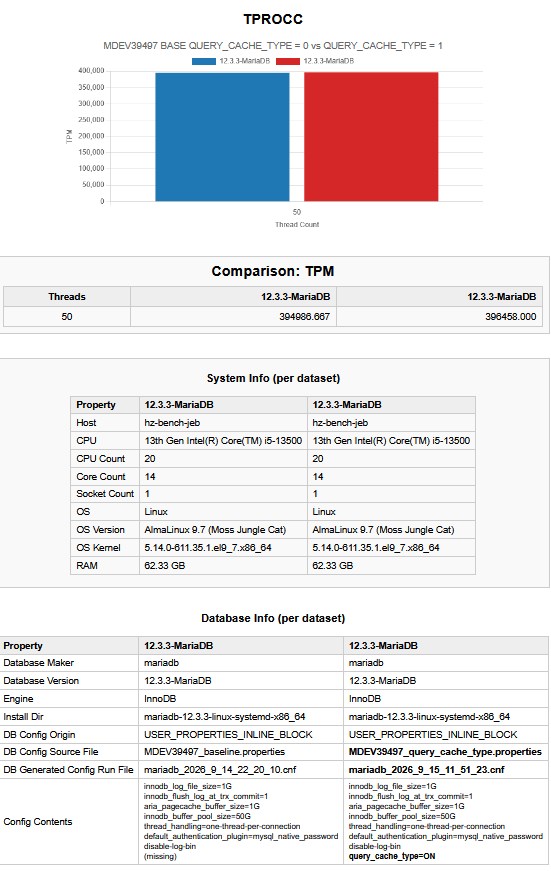
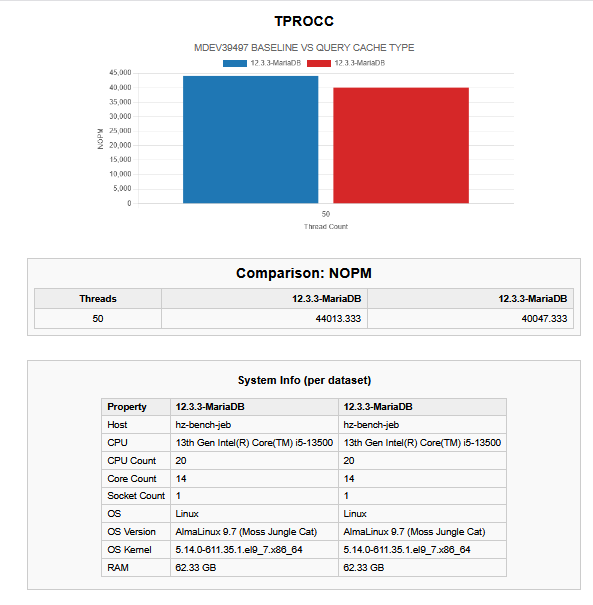
8 query_cache_type (ON | OFF)
WHY: QC mutex contention vs repeated SELECT speed.
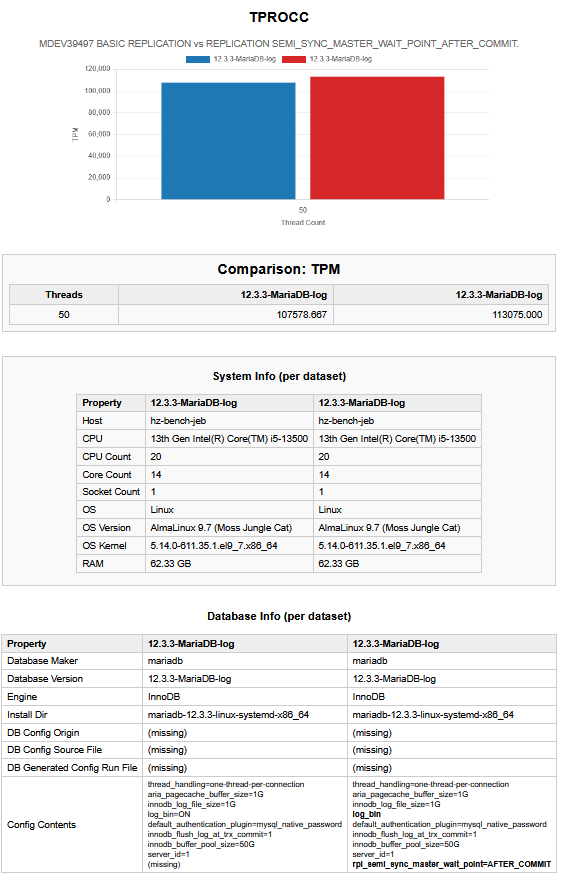
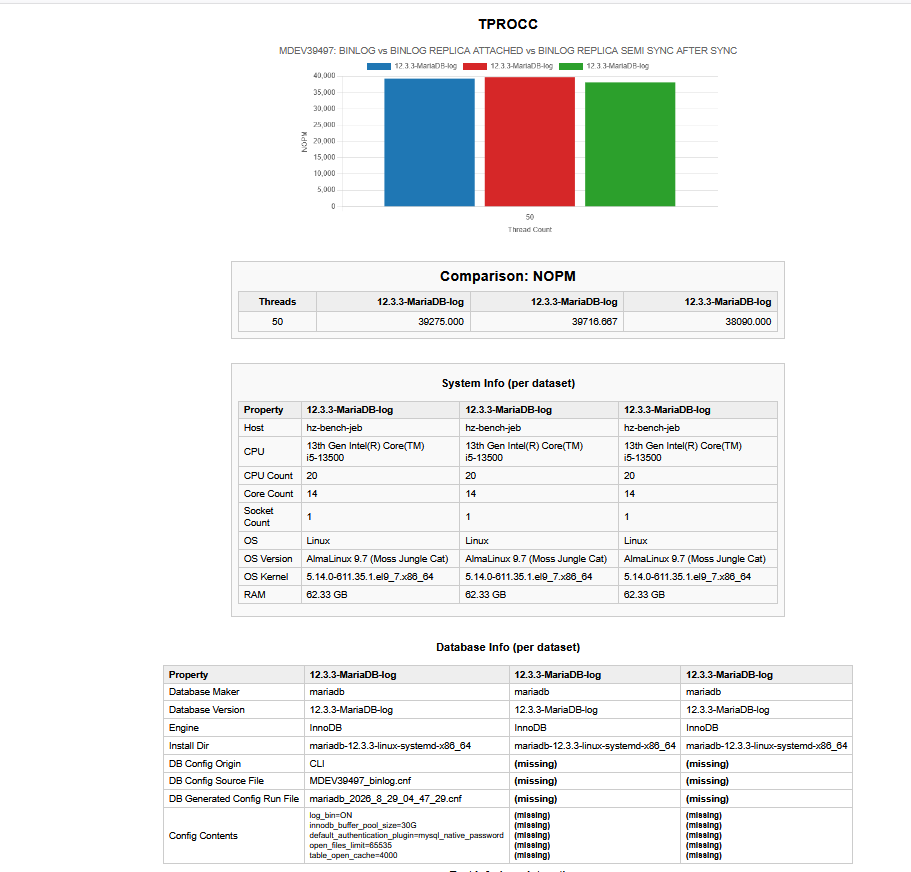
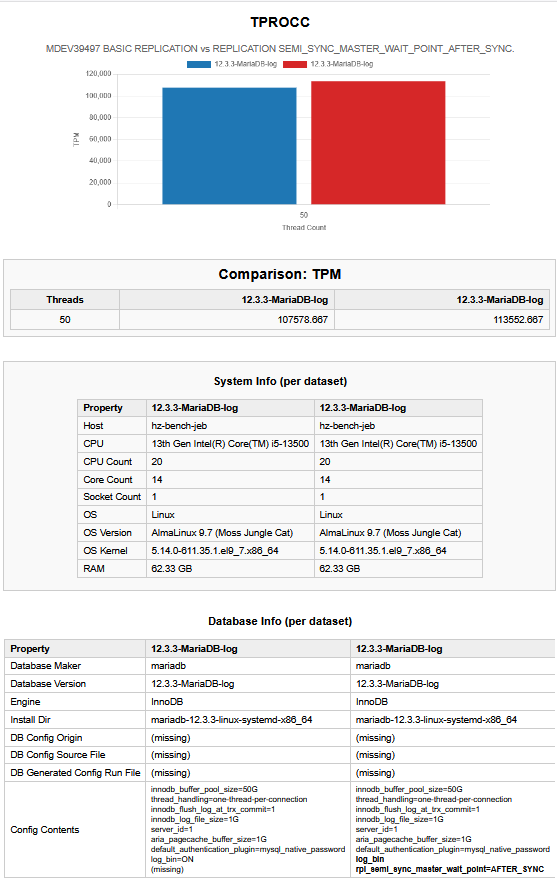
9. rpl_semi_sync_master_enable (0 | 1)
WHY: Commit latency vs replication safety.
10. rpl_semi_sync_master_wait_point (AFTER_SYNC | AFTER_COMMIT)
WHY: Different semi-sync wait semantics.
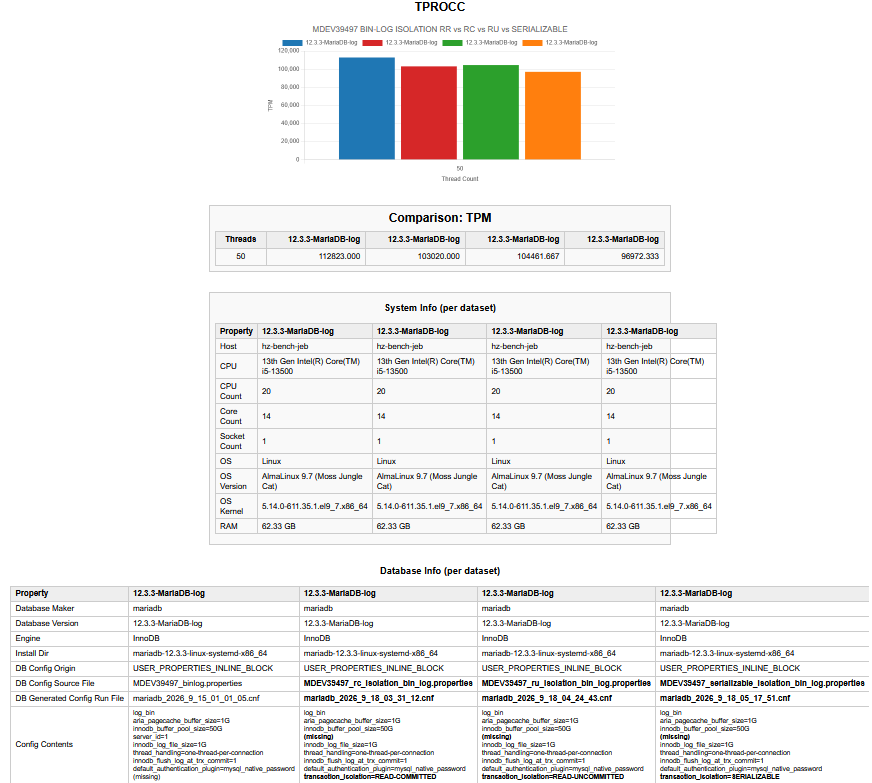
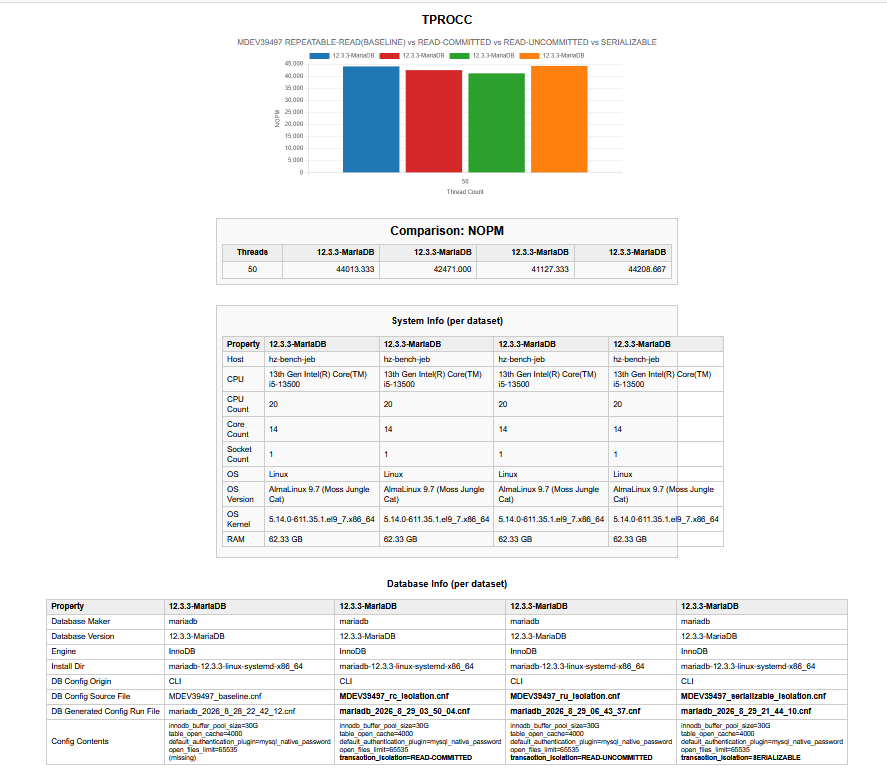
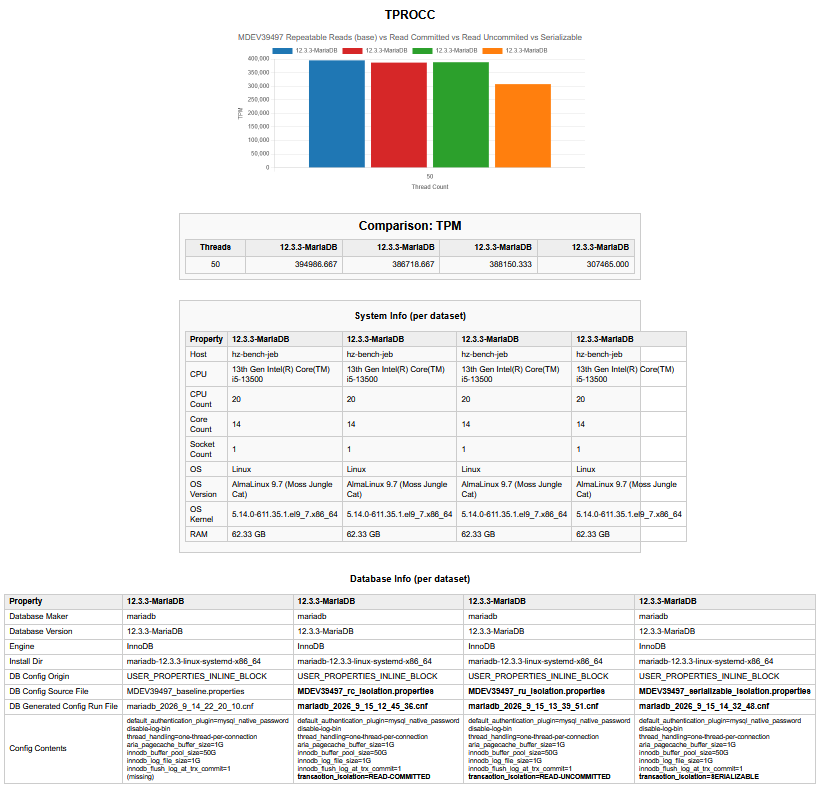
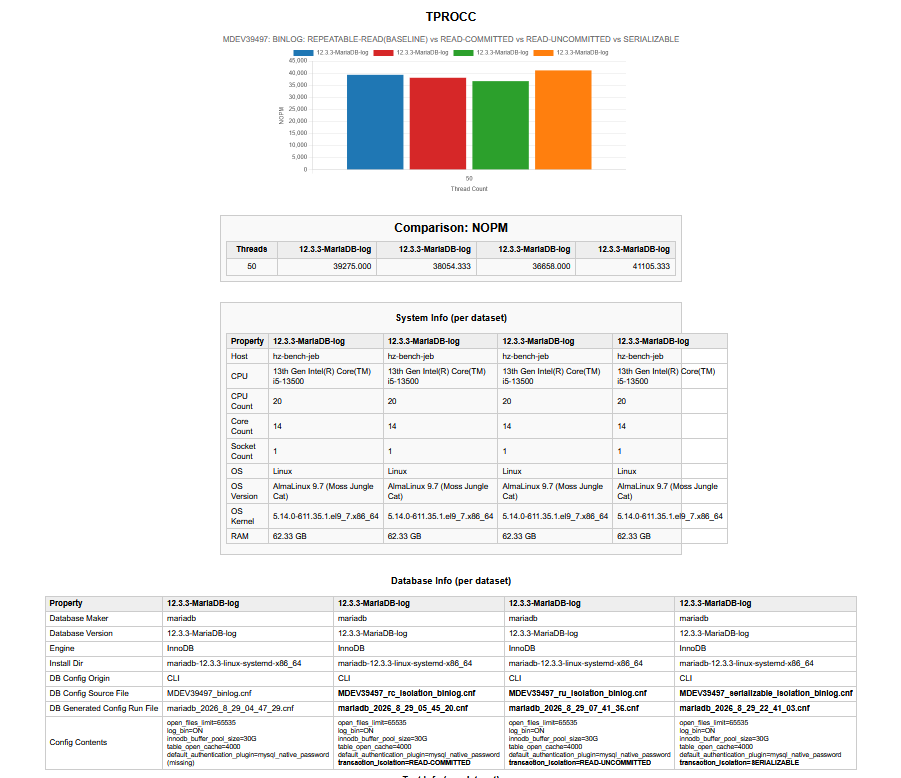
11. transaction_isolation (RU | RC | RR | SERIALIZABLE)
WHY: Locking/MVCC overhead.
NOTE: Must test with log-bin=0 and log-bin=1.
Monty: Binlog performance should be independent of transaction isolation (no common code path). Performance drop should be identical to case 5) for all isolation modes. Needs to be proven.
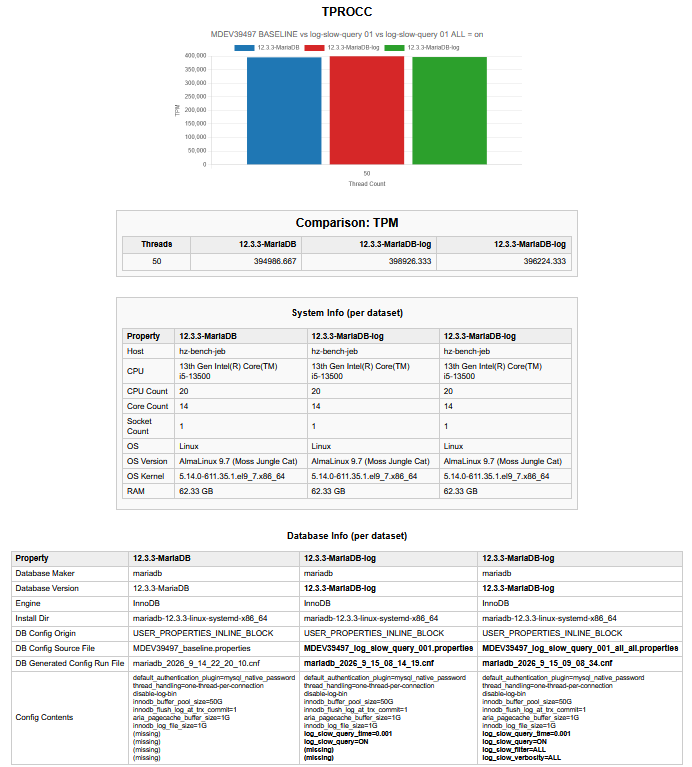
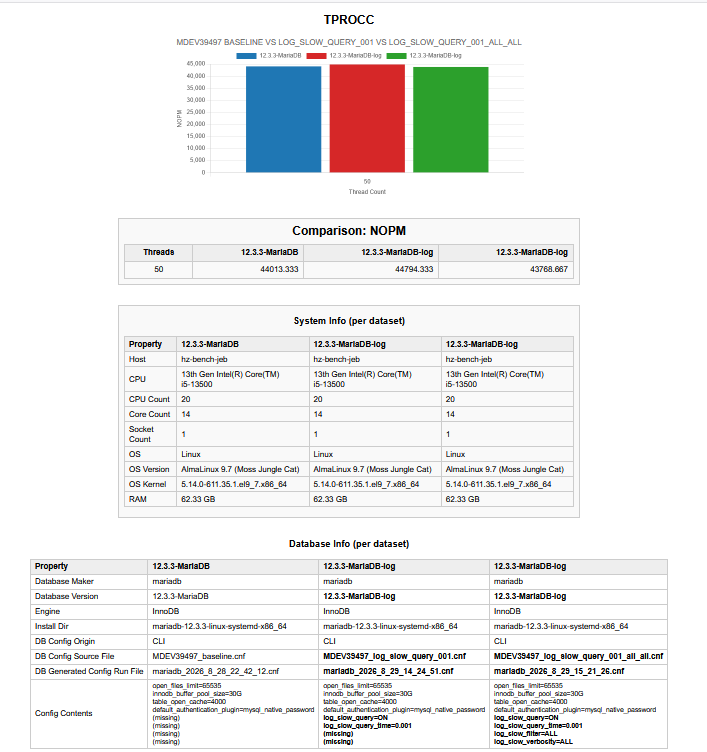
12. --log-slow-query=ON --log
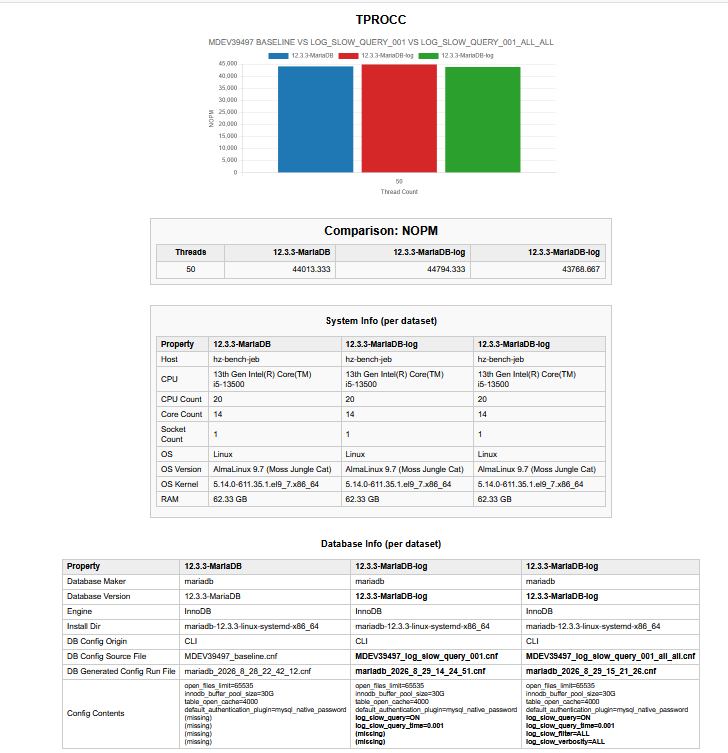
12a) --log-slow-query=ON --log-slow-query-time=0.001
12b) --log-slow-query=ON --log-slow-query-time=0.001 --log-slow-filter="all" --log-slow-verbosity=all
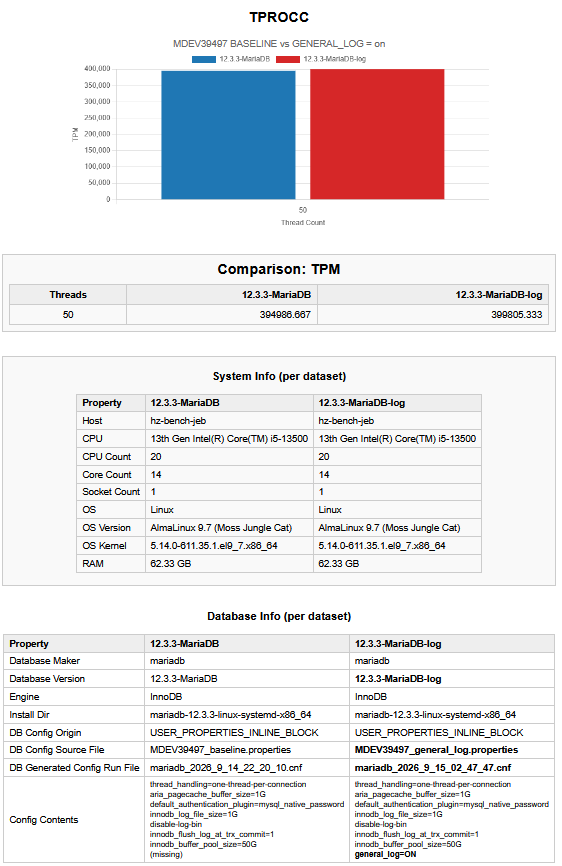
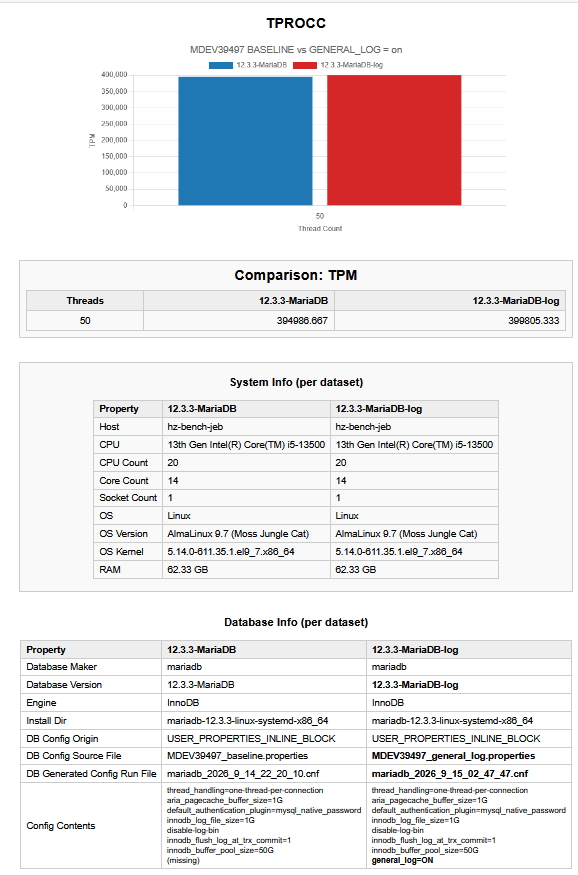
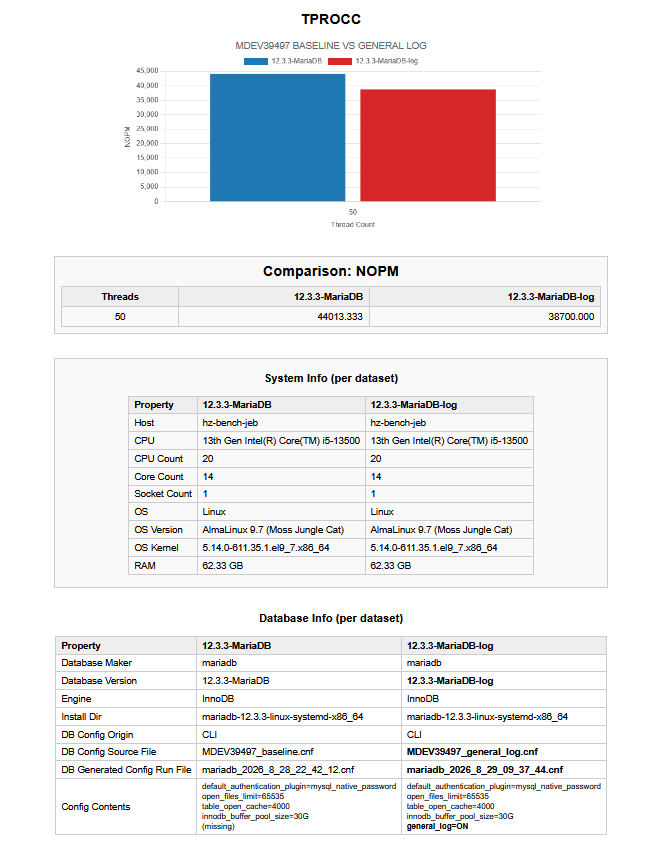
13) --general-log=ON
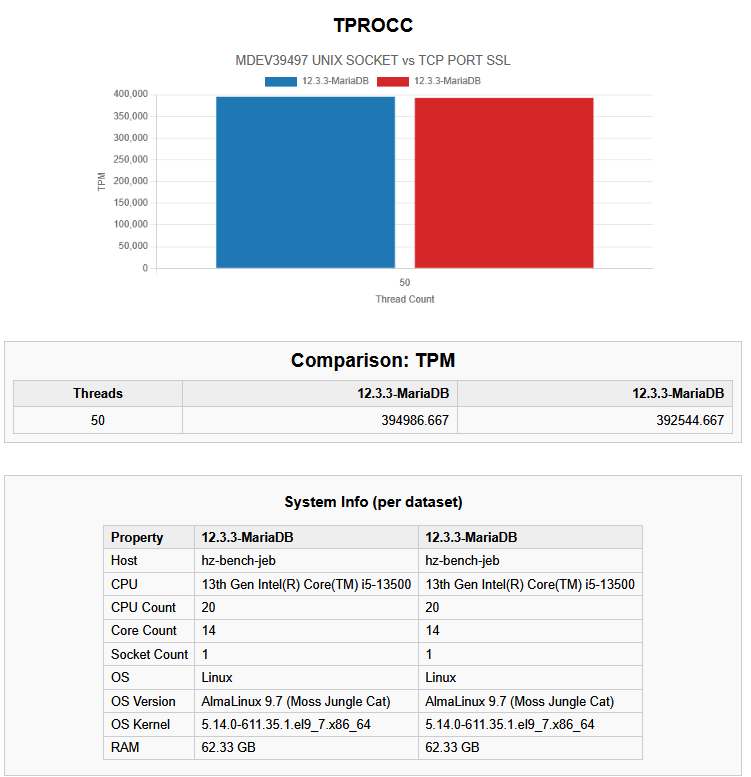
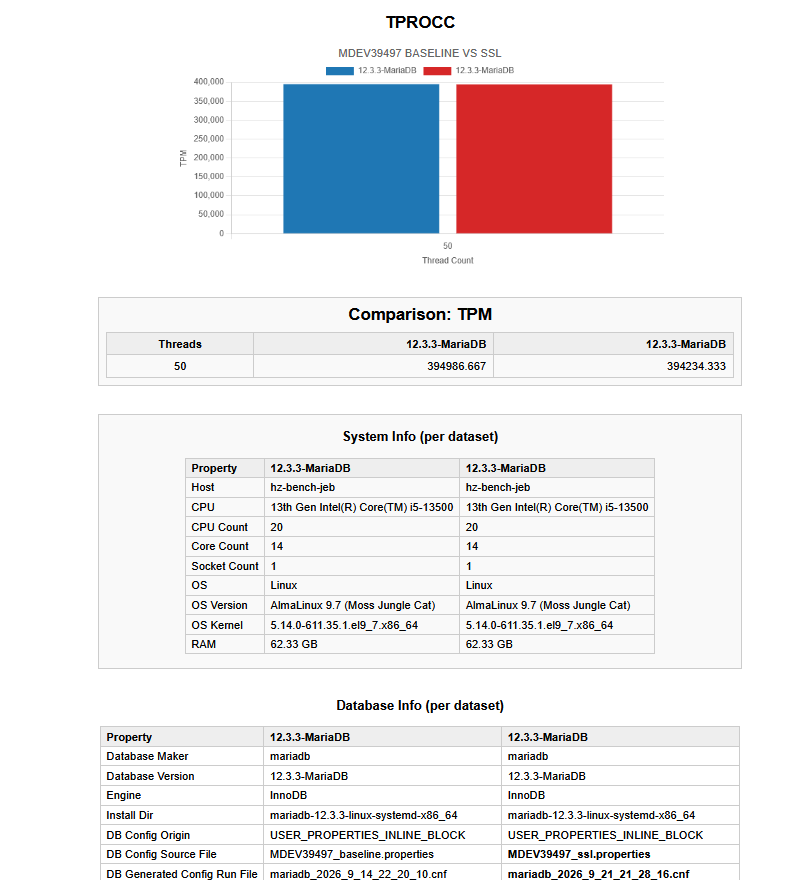
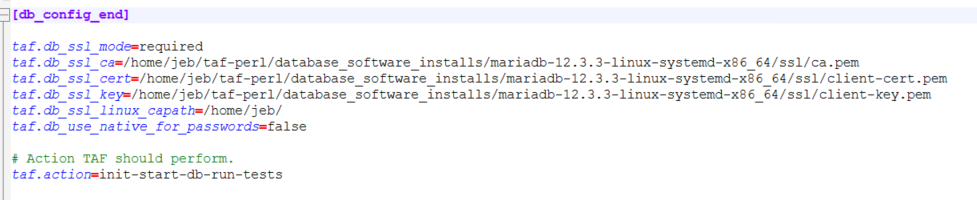
14) Run test without ssl/tsl
WHY: To understand the cost of ssl. It is quite normal that in secure datacenters users don't enable ssl
15) Run the test with TidesDB with similar options as we use for InnoDB
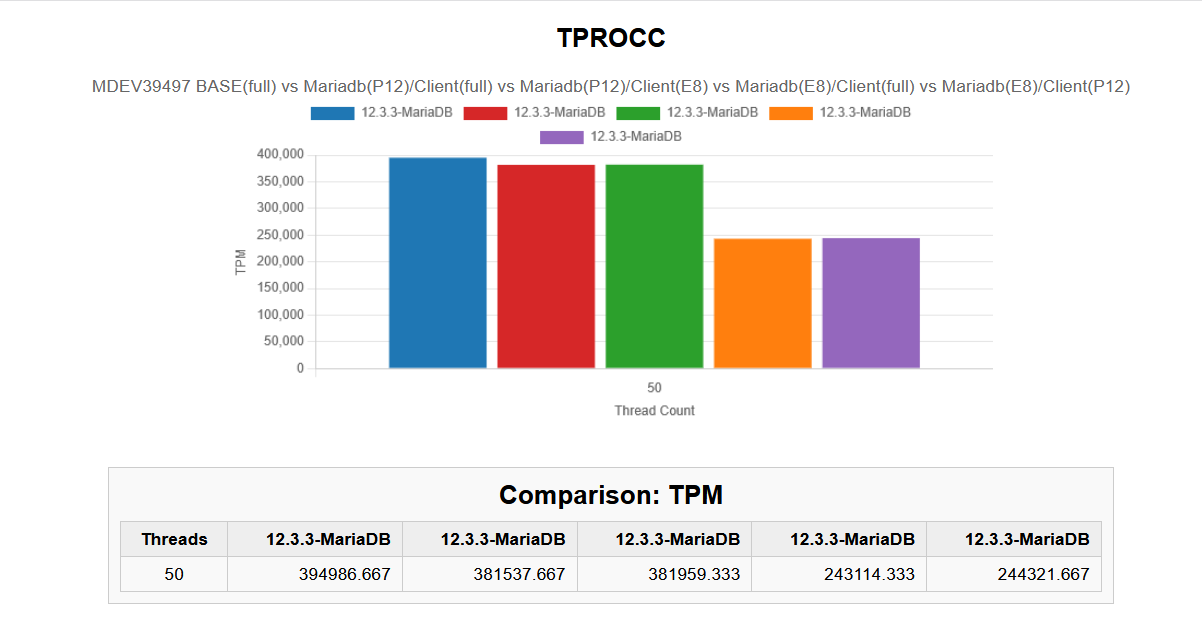
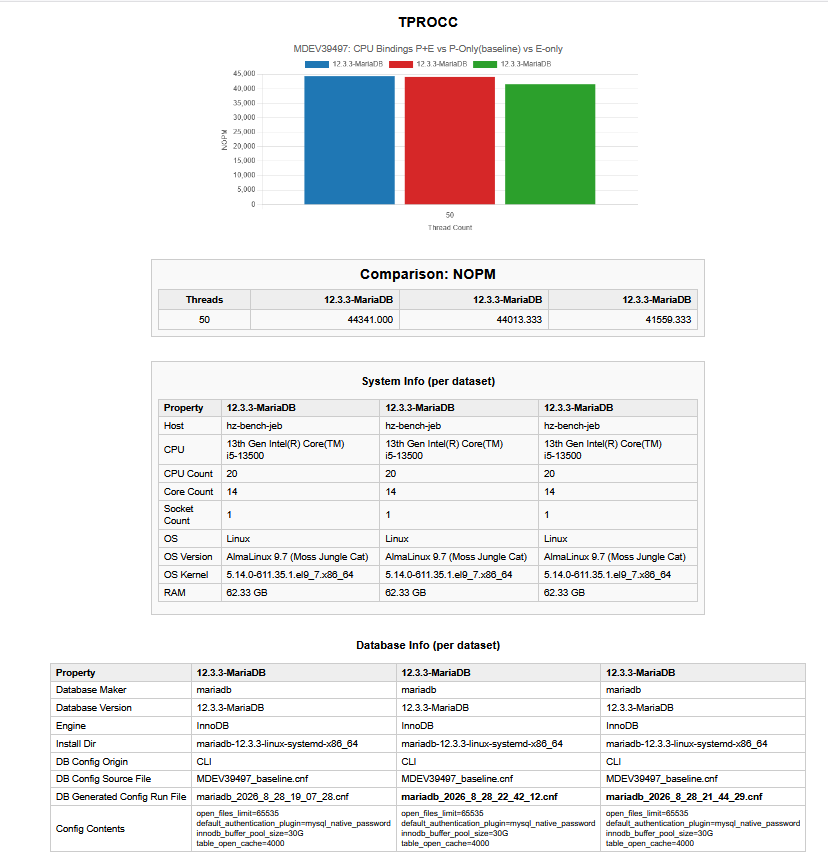
16) Run baseline with with P-cores, P+E cores and E-cores.
Extra:
1) When using another benchmark, also run with the Aria engine. Note Aria engine is not great for concurrency so better to use tests that are read intensive or each user uses different tables. In this case it is important use --aria_pagecache_segments=16 --aria-pagecache-size=16G
===============================================================
Purpose:
Provide a comprehensive performance map of MariaDB under different durability, replication, charset, flushing, and concurrency configurations. Others may add additional options or combinations here.
===============================================================
Testing is being conducted on Hetzner Sponsor Hosts
Hetzner Sponsor Host (hz-bench)
CPU: 13th Gen Intel(R) Core(TM) i5-13500
CPU Count: 20
Core Count: 14
Socket Count: 1
RAM: 62.33 GB
OS: AlmaLinux 9.7 (Moss Jungle Cat)
Kernel: 5.14.0-811.35.1.el9_7.x86_64
Hetzner Sponsor Host (hz-bench2)
CPU: AMD EPYC 9454 48-Core Processor
CPU Count: 96
Core Count: 48
Socket Count: 1
RAM: 124.98 GB
OS: AlmaLinux 9.8 (Olive Jaguar)
Kernel: 5.14.0-687.29.1.el9_8.x86_64
These systems provided the horsepower required to full fill request.
We appreciate the outstanding support and the quality of the systems Hetzner.com provided throughout development.
If you need hosting that’s reliable, affordable, and capable of handling serious engineering workloads, Hetzner.com delivers.