Details
-
Task
-
Status: Closed (View Workflow)
-
 Major
Major
-
Resolution: Fixed
-
Q2/2026 Server Development, Q3/2026 Server Maintenance
Description
Under windows allocation more than 16KB could be expensive.
Benchmark stop growing memory blocks more than 16KB in MEM_ROOT.
There is an alternative system allocator on Windows, called Segment heap, which in my tests always beat the default "low fragmentation" heap, which also does not have problems with larger 16K blocks. It is relatively easy to enable via application manifest (which we already use for some purposes, e.g enabling utf8 codepage by default).
This should be investigated, and benchmarked, to compare to alternative( to reducing some default MEM_ROOT sizes)
The motivation for this research is a very noticeable collapse of throughput with many clients on performance benchmarks. Profiling suggested
Benchmark setup
3 alternatives were tested
- main baseline with standard allocator (called in following, possible incorrectly LFH, LFH is actually a heap frontend used for small blocks)
- main baseline with SegmentHeap allocator
- patch that changes sql/sql_const.h to use smaller values for preallocated blocks (QUERY_ALLOC_BLOCK_SIZE, QUERY_ALLOC_PREALLOC_SIZE, TMP_TABLE_BLOCK_SIZE, TMP_TABLE_PREALLOC_SIZE,SHOW_ALLOC_BLOCK_SIZE all set to 8K, rather than 16K or 32K, to provide for space overhead for my_malloc allocations)
The test setup was an Alder Lake machine i9-12900K. The machine uses heterogenous cores with different performance characteristics, so the server was CPU affinitized on 8 faster P-cores, and the client to 8 slower E-cores.
Sysbench tests
The sysbench tests ran via runner script, for N threads where N is 1,2,4,8,16,32,64,128,256,512,1024, for OLTP tests oltp_read_only,oltp_read_write,oltp_point_select.
Sysbench invocation
sysbench.exe --db-driver=mysql --mysql-host=. --mysql-user=root --mysql-db=mysql --tables=10 --table-size=100000 --rand-type=uniform <test> --threads=<N> --time=60 --events=0 --percentile=99 --report-interval=1 --db-ps-mode=auto run
|
for each OLTP test, restart and "sysbench prepare" is done, and 11 tests with increasing client count are run back-to-back.
Note, that host="."
Server parameters
--innodb-buffer-pool-size=10G
--innodb-log-file-size=20G
--innodb-flush-log-at-trx-commit=2
--console --enable-named-pipe
--max-connection=10000
--max-prepared-stmt-count=1000000
Benchmark Results
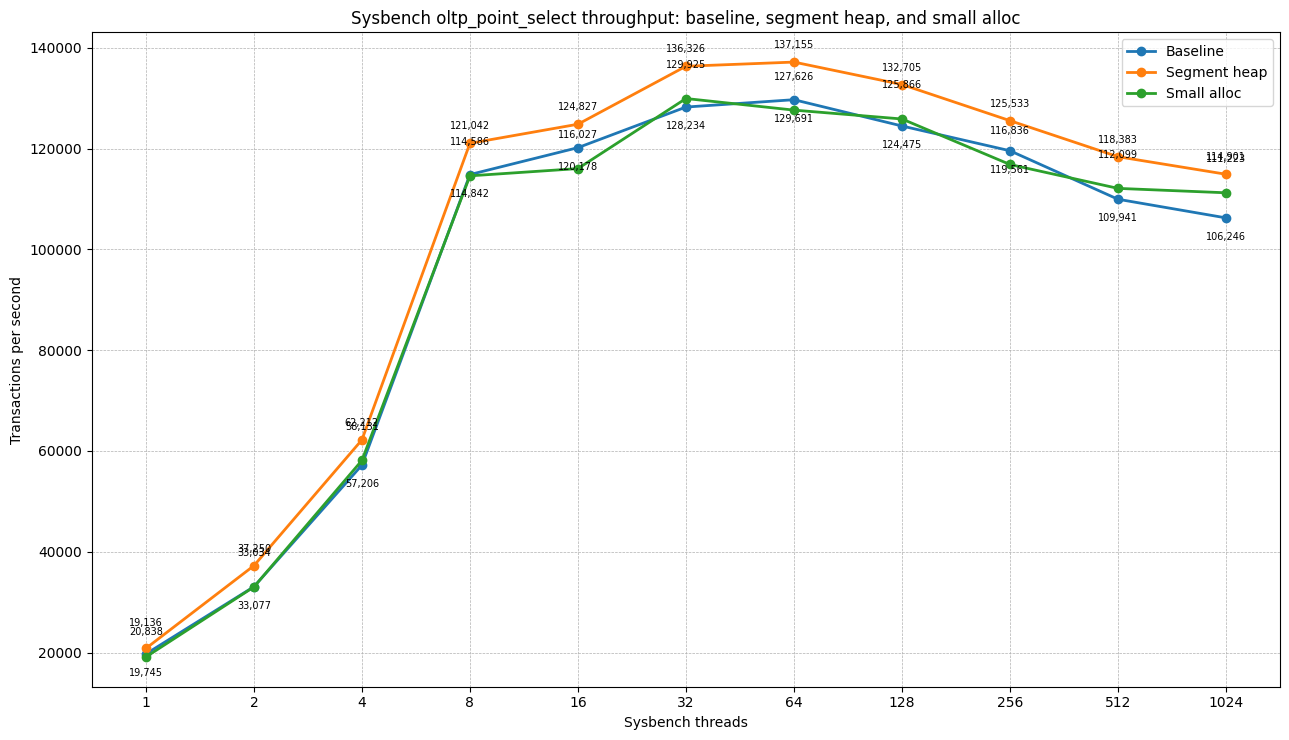
OLTP point selects
| Threads | Baseline TPS | Segment heap TPS | Δ TPS vs baseline | Small-alloc TPS | Δ TPS vs baseline |
|---|---|---|---|---|---|
| 1 | 19,744.70 | 20,837.95 | +5.5% | 19,136.36 | -3.1% |
| 2 | 33,076.75 | 37,249.91 | +12.6% | 33,033.51 | -0.1% |
| 4 | 57,206.39 | 62,211.88 | +8.7% | 58,131.30 | +1.6% |
| 8 | 114,842.09 | 121,042.18 | +5.4% | 114,585.69 | -0.2% |
| 16 | 120,177.97 | 124,826.64 | +3.9% | 116,026.76 | -3.5% |
| 32 | 128,234.11 | 136,326.26 | +6.3% | 129,924.99 | +1.3% |
| 64 | 129,691.16 | 137,154.70 | +5.8% | 127,625.62 | -1.6% |
| 128 | 124,474.86 | 132,704.84 | +6.6% | 125,866.27 | +1.1% |
| 256 | 119,561.24 | 125,532.85 | +5.0% | 116,836.28 | -2.3% |
| 512 | 109,941.15 | 118,382.95 | +7.7% | 112,099.00 | +2.0% |
| 1024 | 106,245.72 | 114,901.45 | +8.1% | 111,223.37 | +4.7% |
`oltp_point_select` is a useful control workload. Both allocators scale normally. Segment heap is modestly faster, but there is no qualitative difference. Small-alloc patch does not make a big difference either
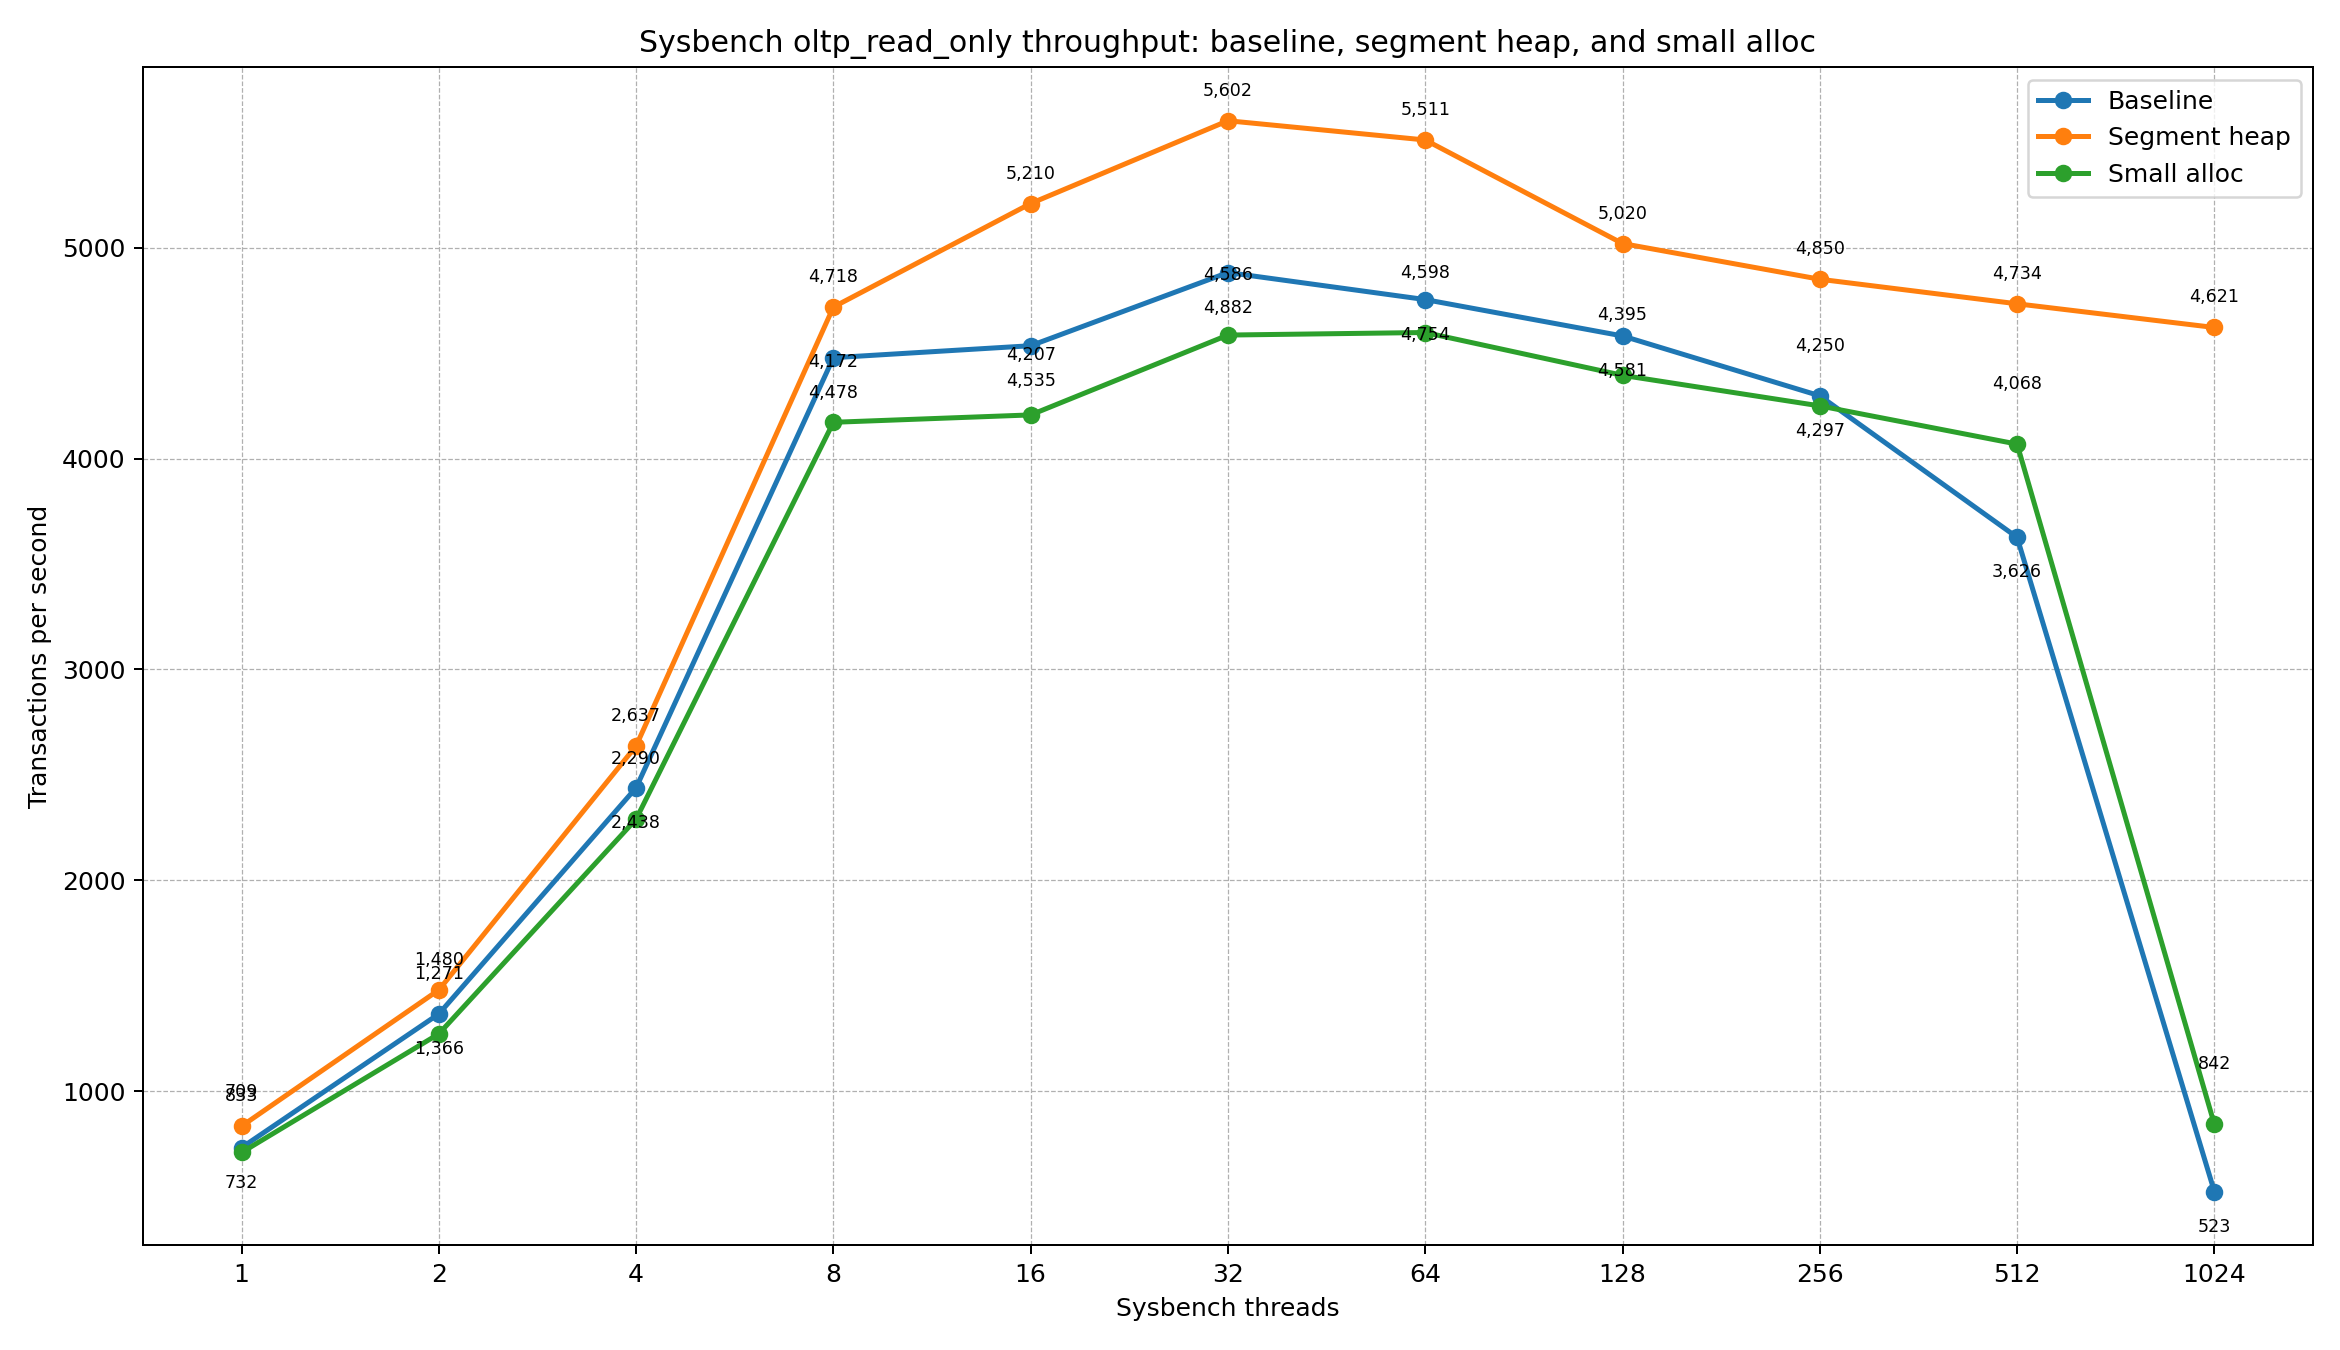
OLTP readonly
| Threads | Baseline TPS | Segment heap TPS | Δ TPS vs baseline | Small-alloc TPS | Δ TPS vs baseline |
|---|---|---|---|---|---|
| 1 | 731.50 | 833.37 | +13.9% | 708.54 | -3.1% |
| 2 | 1,365.77 | 1,479.60 | +8.3% | 1,271.23 | -6.9% |
| 4 | 2,438.49 | 2,637.09 | +8.1% | 2,289.84 | -6.1% |
| 8 | 4,478.28 | 4,718.45 | +5.4% | 4,171.84 | -6.8% |
| 16 | 4,535.01 | 5,209.58 | +14.9% | 4,206.84 | -7.2% |
| 32 | 4,882.08 | 5,602.13 | +14.7% | 4,585.61 | -6.1% |
| 64 | 4,753.91 | 5,510.90 | +15.9% | 4,597.71 | -3.3% |
| 128 | 4,581.43 | 5,019.75 | +9.6% | 4,394.56 | -4.1% |
| 256 | 4,297.46 | 4,850.34 | +12.9% | 4,249.67 | -1.1% |
| 512 | 3,626.27 | 4,733.88 | +30.5% | 4,068.37 | +12.2% |
| 1024 | 523.21 | 4,621.49 | +783.3% | 842.21 | +61.0% |
The standard allocator shows a clear scalability collapse at high concurrency: throughput drops sharply between 512 and 1024 threads. Segment heap behaves much more robustly. It reaches the saturations, then degrades gracefully instead of falling off a cliff.
Note, in all tests segment heap is winning in TPS in all cases. small-blocks patch is normally slower than baseline, but helps a little with very high concurrency.
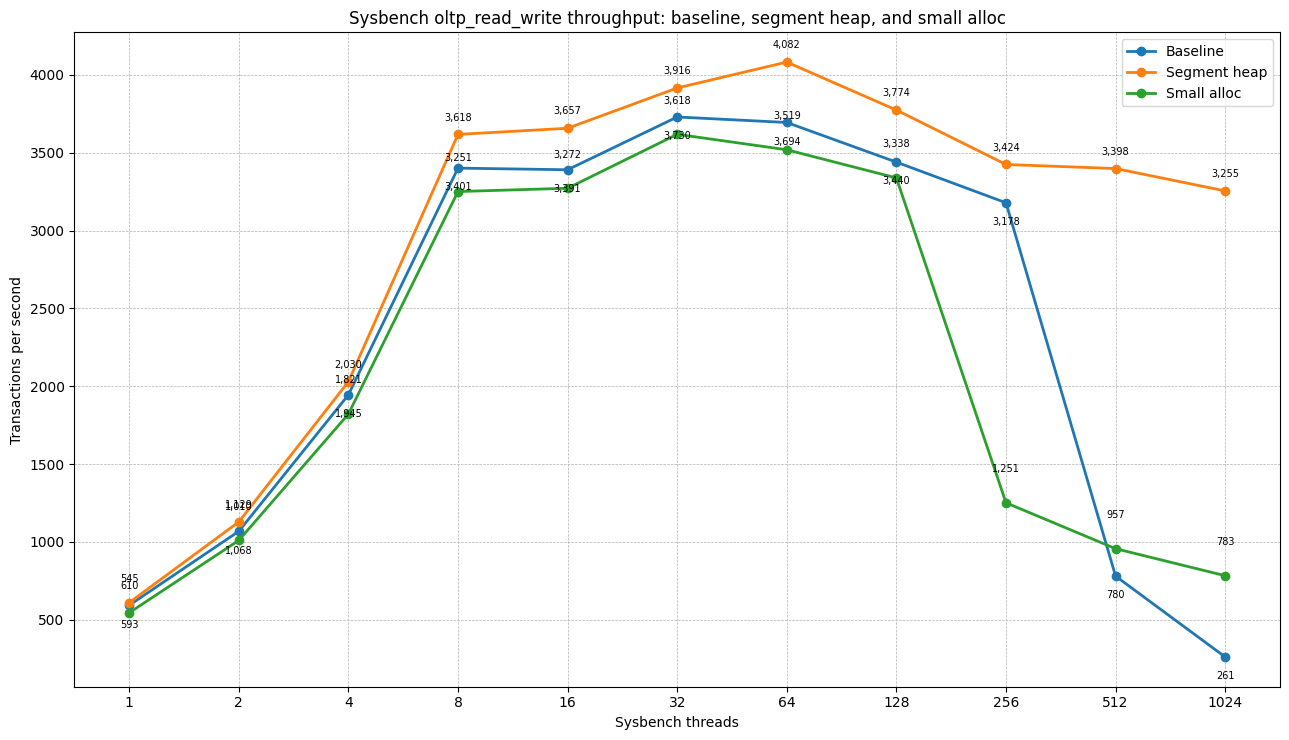
OLTP read-write

| Threads | Baseline TPS | Segment heap TPS | Δ TPS vs baseline | Small-alloc TPS | Δ TPS vs baseline |
|---|---|---|---|---|---|
| 1 | 593.11 | 610.08 | +2.9% | 545.11 | -8.1% |
| 2 | 1,068.50 | 1,128.89 | +5.7% | 1,010.23 | -5.5% |
| 4 | 1,944.90 | 2,029.51 | +4.4% | 1,821.49 | -6.3% |
| 8 | 3,401.10 | 3,617.70 | +6.4% | 3,250.64 | -4.4% |
| 16 | 3,390.56 | 3,657.23 | +7.9% | 3,271.77 | -3.5% |
| 32 | 3,729.54 | 3,915.89 | +5.0% | 3,618.37 | -3.0% |
| 64 | 3,694.25 | 4,082.22 | +10.5% | 3,518.95 | -4.7% |
| 128 | 3,439.60 | 3,773.99 | +9.7% | 3,337.93 | -3.0% |
| 256 | 3,178.48 | 3,424.38 | +7.7% | 1,251.28 | -60.6% |
| 512 | 780.43 | 3,398.35 | +335.4% | 956.76 | +22.6% |
| 1024 | 261.13 | 3,254.71 | +1,146.4% | 783.17 | +199.9% |
The baseline allocator collapses between 256 and 512 threads. Segment heap remains stable and degrades gracefully. The small-allocation workaround does not solve the issue: it collapses even earlier, already at 256 threads.
ETW context-switch analysis
Capture method
Context-switch ETLs were collected with UIForETW while running sysbench oltp_read_only at 512 users
The traces were converted into Brendan Gregg-style flamegraphs using xperf_to_collapsedstacks.py from UIForETW kit.
The flamegraphs show stacks associated with context-switch and ready-thread activity. The sample weights are inclusive: a parent frame includes the weights of its descendants. Percentages therefore overlap and must not be added together.
Flamegraphs
| Variant | Flamegraph |
|---|---|
| Baseline | baseline_context_switches.svg |
| Small alloc | small-blocks_context_switches.svg |
| Segment heap | segment_heap_context_switches.svg |
Dominant heap-related stacks
| Inclusive frame | Baseline | Small alloc | Segment heap |
|---|---|---|---|
| my_malloc | 51.53% | 51.33% | 2.37% |
| ucrtbase.dll!_malloc_base | 51.51% | 51.33% | 2.19% |
| ntdll.dll!RtlAllocateHeap | 51.48% | 51.30% | 2.13% |
| ntdll.dll!RtlpAllocateNTHeapInternal | 51.43% | 51.23% | not visible |
| ntdll.dll!RtlpAllocateHeap | 51.08% | 50.72% | not visible |
| ntdll.dll!RtlEnterCriticalSection | 28.68% | 30.30% | 0.42% |
| ntdll.dll!RtlLeaveCriticalSection | 21.08% | 20.40% | 0.23% |
| ntdll.dll!RtlpHpAllocVirtBlockCommitFirst | 13.73% | 14.55% | not visible |
| ntdll.dll!NtAllocateVirtualMemory | 13.61% | 14.39% | not visible |
| hp_get_new_block | 26.82% | 28.59% | 0.26% |
| Filesort_buffer::alloc_sort_buffer | 13.28% | 15.20% | 0.33% |
| ntdll.dll!RtlFreeHeap | 17.09% | 16.63% | 1.08% |
Dominant baseline allocation path
A large part of the baseline flamegraph is under the legacy NT heap path:
... -> heap_write
|
-> hp_get_new_block
|
-> my_malloc
|
-> ucrtbase.dll!_malloc_base
|
-> ntdll.dll!RtlAllocateHeap
|
-> ntdll.dll!RtlpAllocateNTHeapInternal
|
-> ntdll.dll!RtlpAllocateHeap
|
-> ntdll.dll!RtlpHpAllocVirtBlockCommitFirst
|
-> ntdll.dll!NtAllocateVirtualMemory
|
-> ntoskrnl.exe!NtAllocateVirtualMemory
|
-> ntoskrnl.exe!MiAllocateVirtualMemory
|
A second substantial path is associated with filesort buffer allocation:
... -> filesort
|
-> Filesort_buffer::alloc_sort_buffer
|
-> my_malloc
|
-> ucrtbase.dll!_malloc_base
|
-> ntdll.dll!RtlAllocateHeap
|
-> ntdll.dll!RtlpAllocateNTHeapInternal
|
-> ntdll.dll!RtlpAllocateHeap
|
The baseline flamegraph also shows considerable critical-section activity below the legacy heap allocator:
ntdll.dll!RtlEnterCriticalSection 28.68%
|
ntdll.dll!RtlLeaveCriticalSection 21.08%
|
Small-allocation experiment
Limiting preallocation to blocks smaller than 16 KiB does not much help in this case, since dominant stacks do not use preallocation. The only visible effect of the patch is eliminating init_sql_alloc() call stack, which has 7.41% inclusive weight in the baseline flamegraph.
The dominant legacy heap stacks remain almost unchanged.This indicates that reducing the preallocated block size is not a complete fix. It changes the symptom, but the same legacy NT heap contention and virtual-memory-commit paths remain prominent.
Segment-heap behavior
The segment-heap flamegraph is qualitatively different:
- Legacy NT heap frames such as RtlpAllocateNTHeapInternal, RtlpAllocateHeap, and RtlpHpAllocVirtBlockCommitFirst are no longer visible.
- RtlEnterCriticalSection drops from approximately 29–30% to 0.42%.
- my_malloc drops from approximately 51% to 2.37%.
- hp_get_new_block drops from approximately 27–29% to 0.26%.
- Filesort_buffer::alloc_sort_buffer drops from approximately 13–15% to 0.33%.
Segment-heap-specific allocation frames are visible, but remain small:
| Inclusive frame | Segment heap |
|---|---|
| ntdll.dll!RtlpHpVsContextAllocate | 1.07% |
| ntdll.dll!RtlpHpVsSlotAllocate | 0.80% |
Once the allocator bottleneck is removed, a larger relative share of the remaining context-switch activity is associated with normal named-pipe response completion, where write to named pipe wakes up sysbench client thread, and so contributes to context switch activity.
Interpretation
The combined ETW evidence indicates a workload-dependent scalability problem in the legacy Windows heap path:
- The baseline and small-allocation variants spend a large proportion of context-switch flamegraph weight below RtlAllocateHeap.
- Both variants show substantial critical-section activity in the legacy NT heap allocator.
- Both variants also show virtual-memory-commit activity below RtlpHpAllocVirtBlockCommitFirst.
- small-allocation patch does not remove these paths.
- Enabling segment heap almost completely removes the dominant allocator-related stacks.
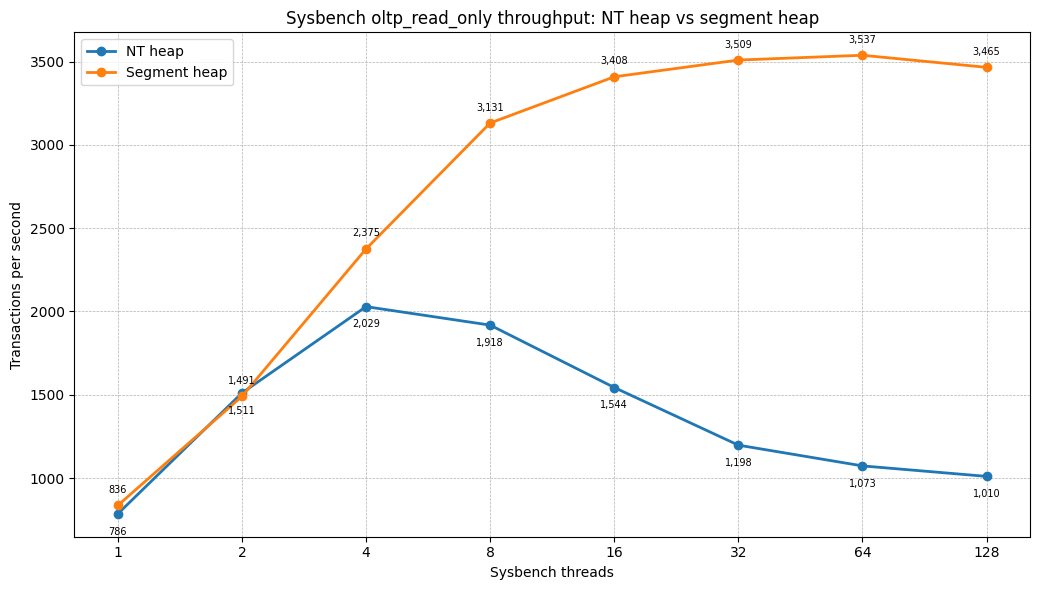
Additional test on Windows Server 2022
The result was reproduced on a second, substantially older machine:
Windows Server 2022
|
Intel Xeon E3-1230 V2 @ 3.30 GHz
|
4 physical cores / 8 logical processors
|
MariaDB 10.11
|
For this run:
MariaDB used --thread-handling=one-thread-per-connection.
--innodb-flush-log-at-trx-commit=2 was removed.
The server was pinned to 6 logical processors, corresponding to 3 physical cores.
Sysbench was pinned to the remaining physical core.
Concurrency was tested up to 128 clients.
OLTP read-only
| Threads | NT heap TPS | Segment heap TPS | Difference |
|---|---|---|---|
| 1 | 785.90 | 836.21 | +6.4% |
| 2 | 1,510.65 | 1,490.53 | -1.3% |
| 4 | 2,029.01 | 2,375.41 | +17.1% |
| 8 | 1,918.14 | 3,130.88 | +63.2% |
| 16 | 1,543.73 | 3,408.28 | +120.8% |
| 32 | 1,197.81 | 3,508.70 | +192.9% |
| 64 | 1,073.33 | 3,537.45 | +229.6% |
| 128 | 1,010.46 | 3,464.99 | +242.9% |
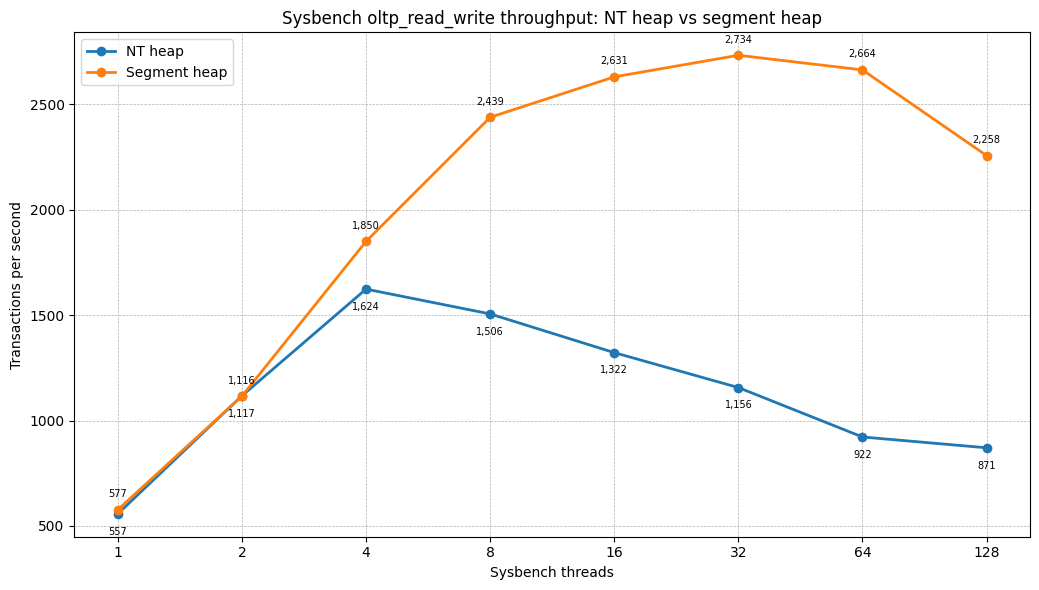
OLTP read-write

| Threads | NT heap TPS | Segment heap TPS | Difference |
|---|---|---|---|
| 1 | 557.29 | 576.80 | +3.5% |
| 2 | 1,117.43 | 1,115.87 | -0.1% |
| 4 | 1,623.73 | 1,850.23 | +13.9% |
| 8 | 1,505.91 | 2,439.19 | +62.0% |
| 16 | 1,322.29 | 2,631.09 | +99.0% |
| 32 | 1,156.44 | 2,733.67 | +136.4% |
| 64 | 921.89 | 2,664.05 | +189.0% |
| 128 | 870.55 | 2,257.60 | +159.3% |
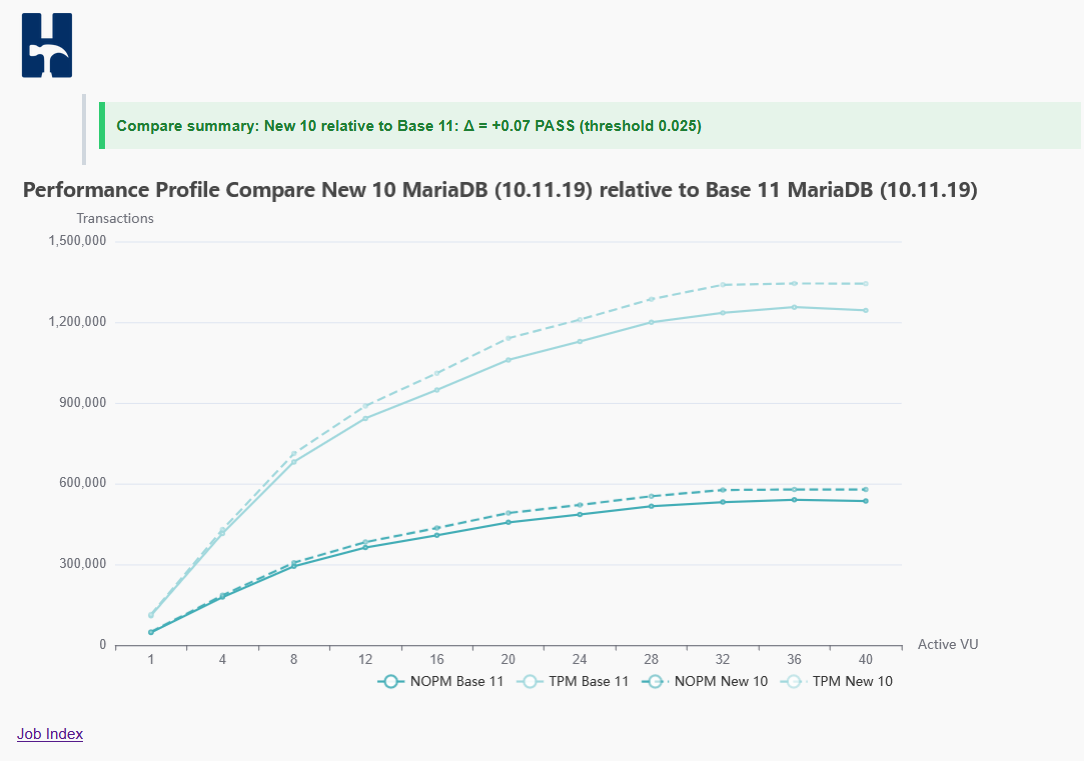
HammerDB benchmark (courtesy of Steve Shaw)
Steve ran comparison benchmark on his Windows (24 core Alder Lake), and provided graph with results, showing better results
with segment heap (about 7% TPS increase in peak performance, but improvements are also seen on non-peak concurrency levels)
Summary
The same pattern is visible on the Windows Server 2022 machine with the one-thread-per-connection scheduler: the NT heap reaches its peak at low concurrency and then collapses as the client count increases. Segment heap continues scaling until saturation and then degrades gracefully.


