Details
-
Bug
-
Status: Open (View Workflow)
-
 Major
Major
-
Resolution: Unresolved
-
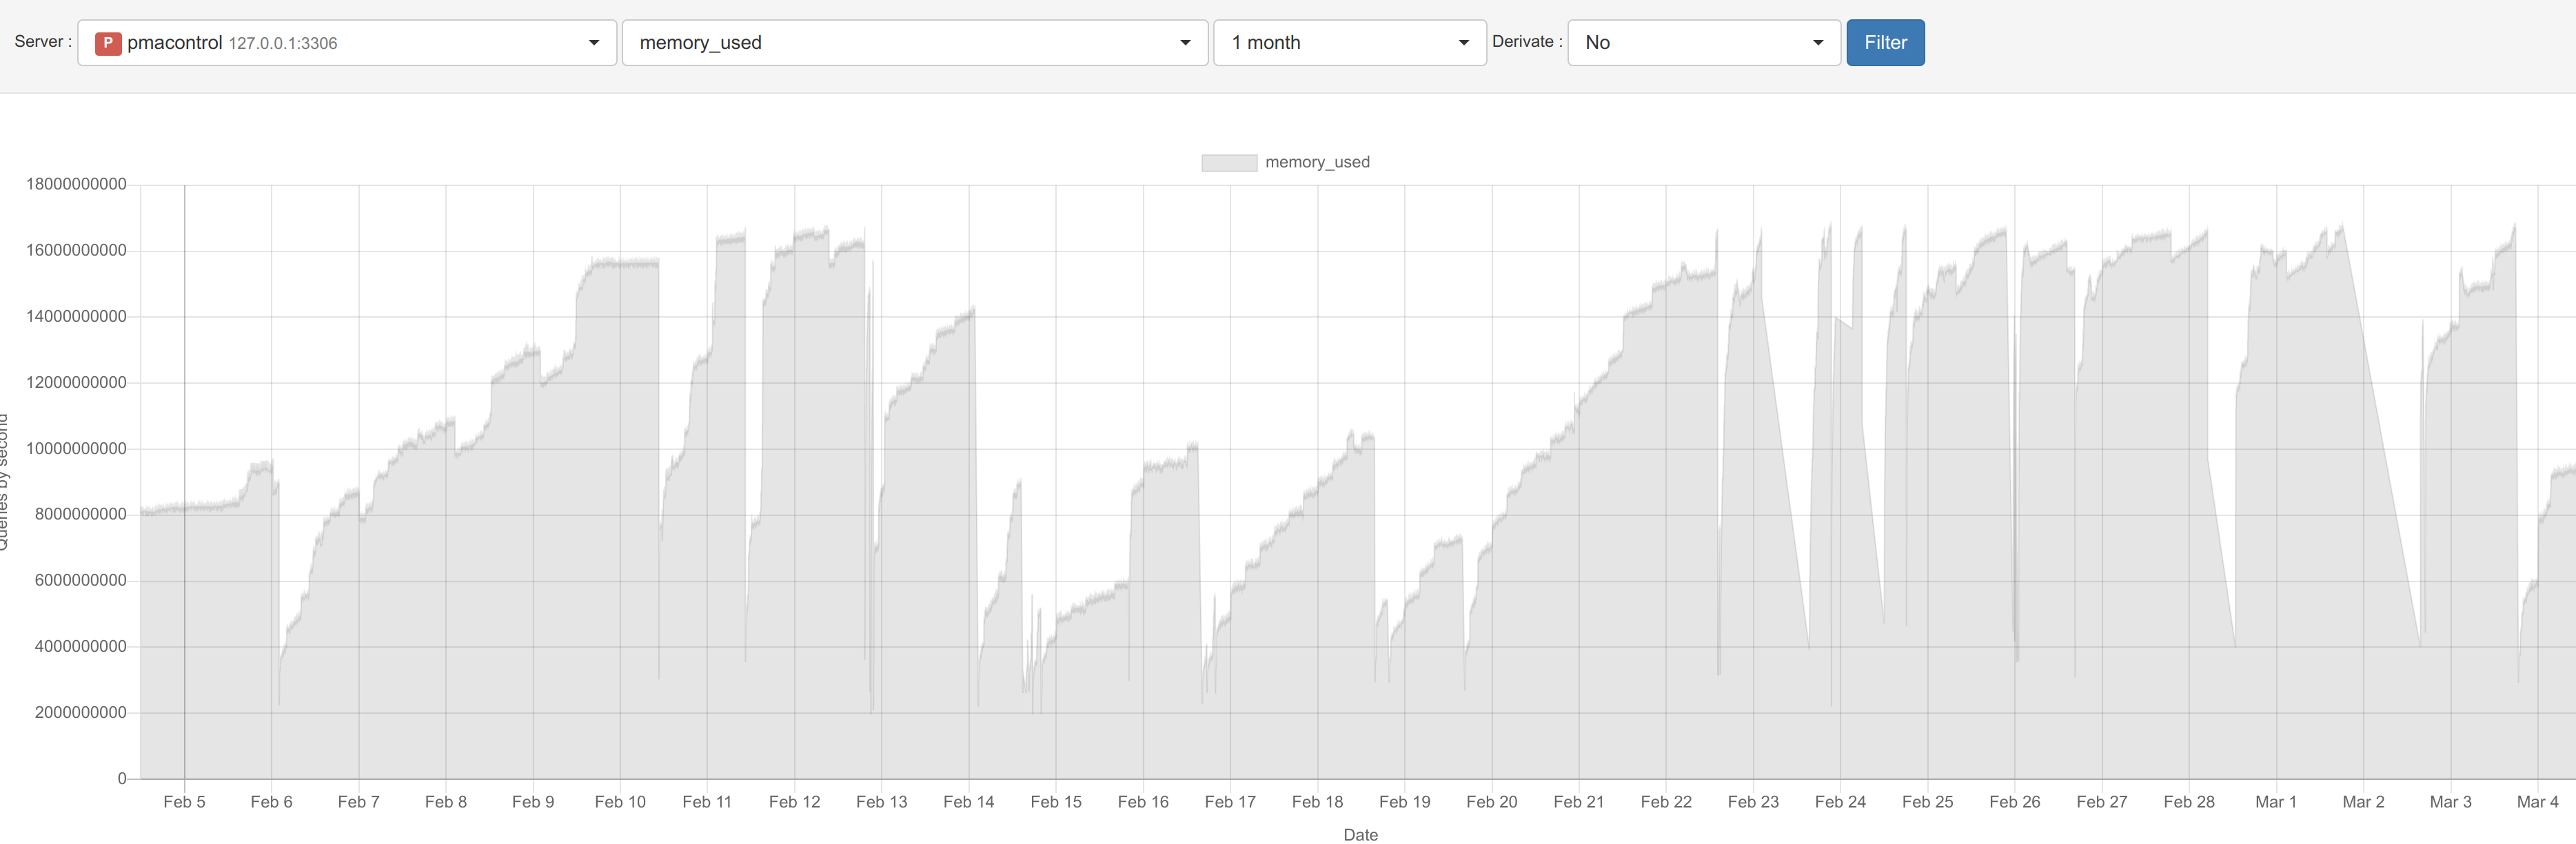
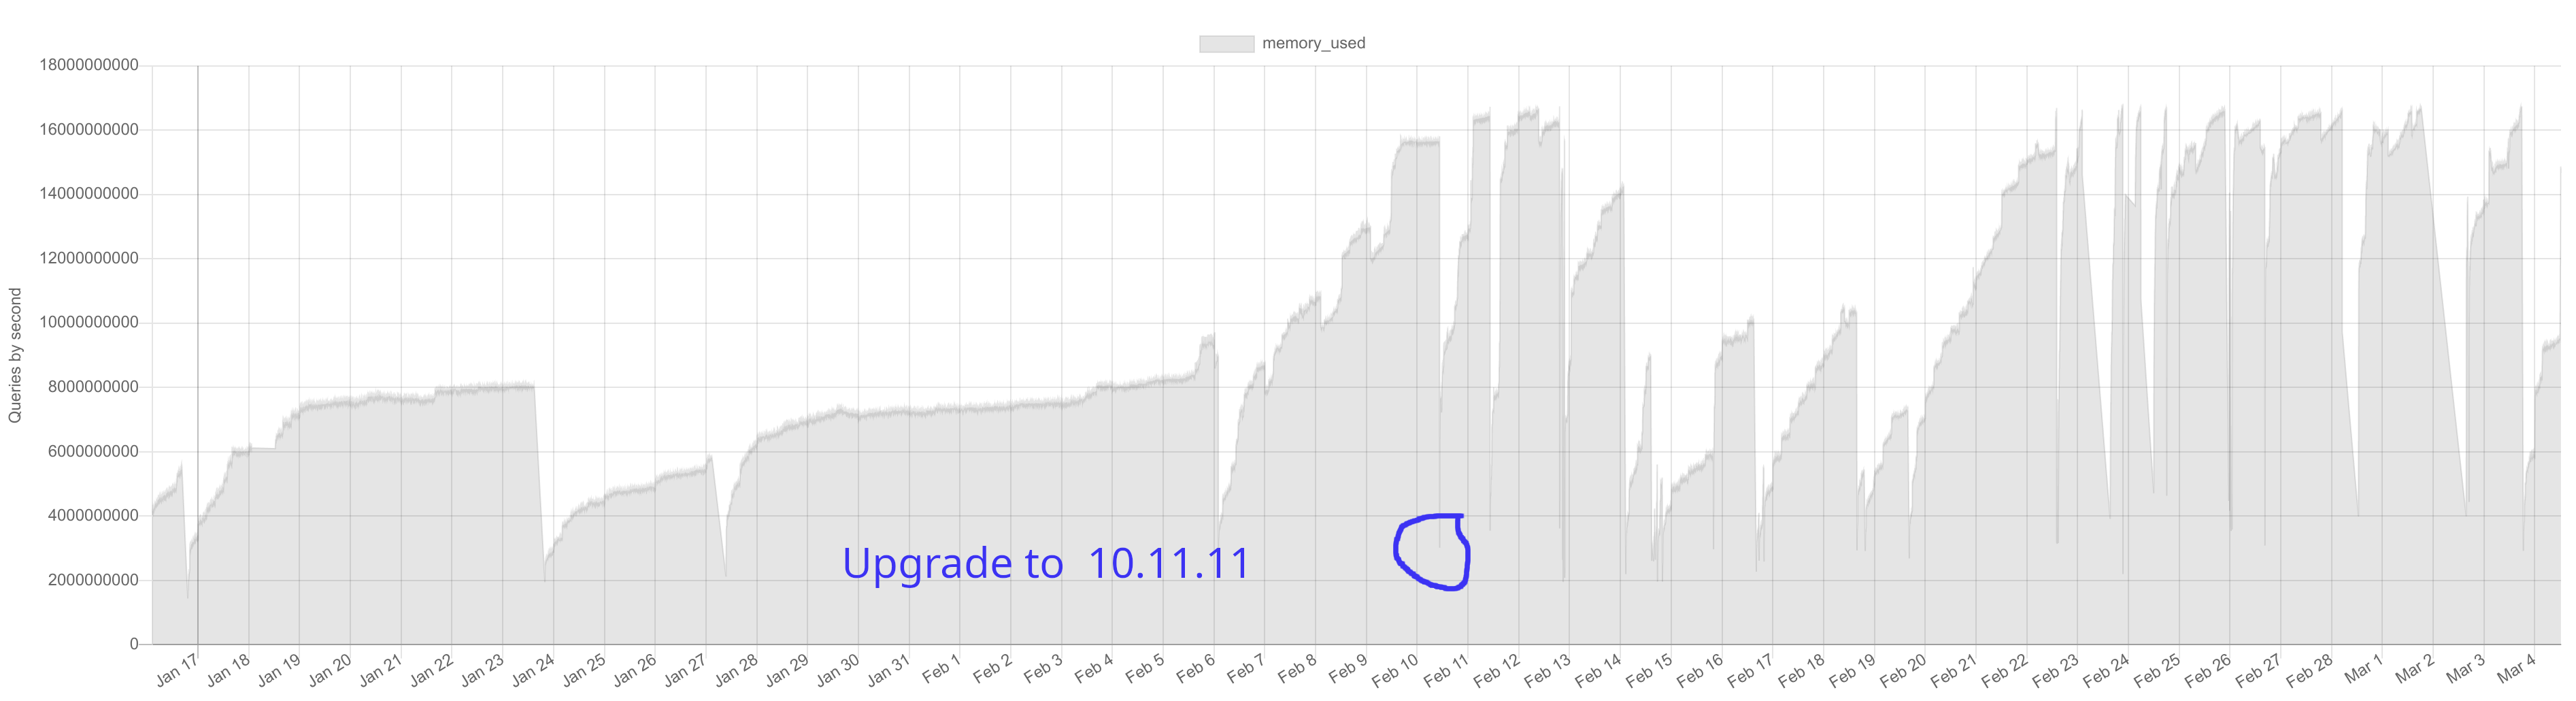
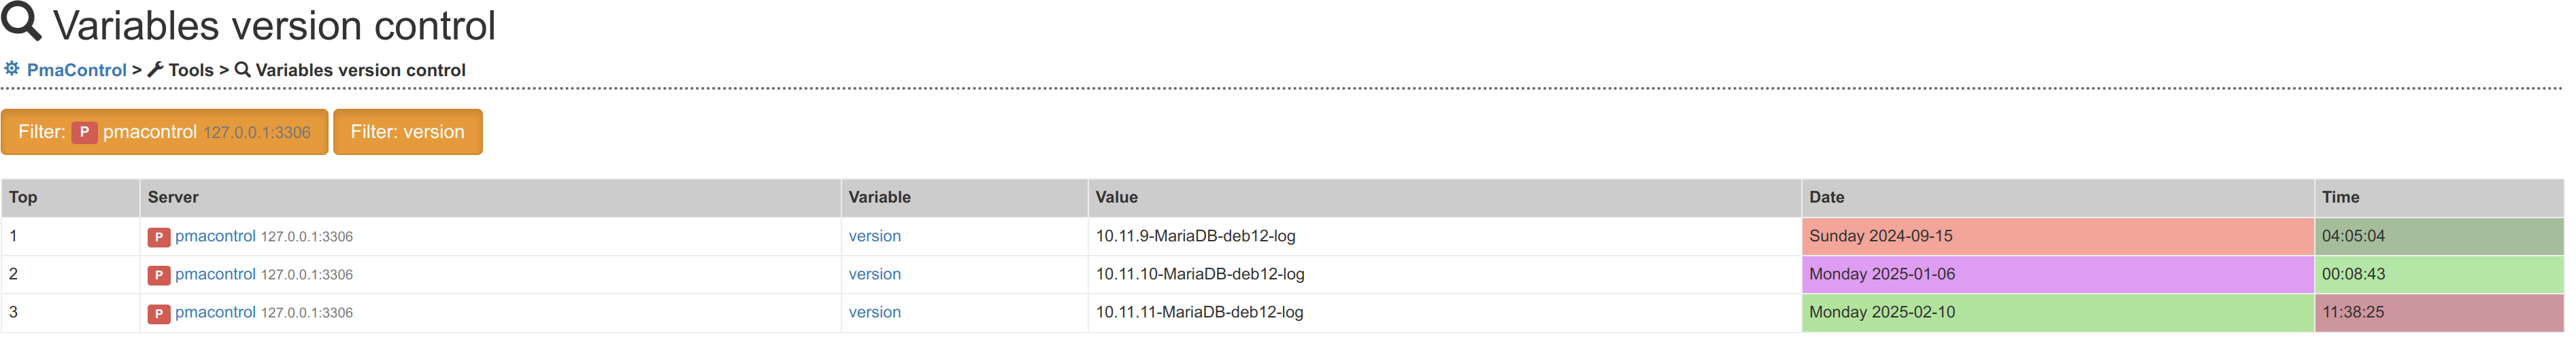
10.11.11
Description
2025-02-23 2:06:14 0 [Note] InnoDB: Memory pressure event freed 534 pages |
2025-02-23 2:07:14 0 [Note] InnoDB: Memory pressure event freed 406 pages |
2025-02-23 2:08:17 0 [Note] InnoDB: Memory pressure event freed 395 pages |
2025-02-23 2:09:17 0 [Note] InnoDB: Memory pressure event freed 426 pages |
2025-02-23 2:10:19 0 [Note] InnoDB: Memory pressure event freed 412 pages |
2025-02-23 2:11:19 0 [Note] InnoDB: Memory pressure event freed 411 pages |
2025-02-23 2:12:21 0 [Note] InnoDB: Memory pressure event freed 416 pages |
and got catch by OOM Killer (it's something i didn't got in previous version)
[dim. 23 févr. 02:13:17 2025] Out of memory: Killed process 3993534 (mariadbd) total-vm:19520796kB, anon-rss:15073372kB, file-rss:0kB, shmem-rss:0kB, UID:102 pgtables:32596kB oom_score_adj:0 |
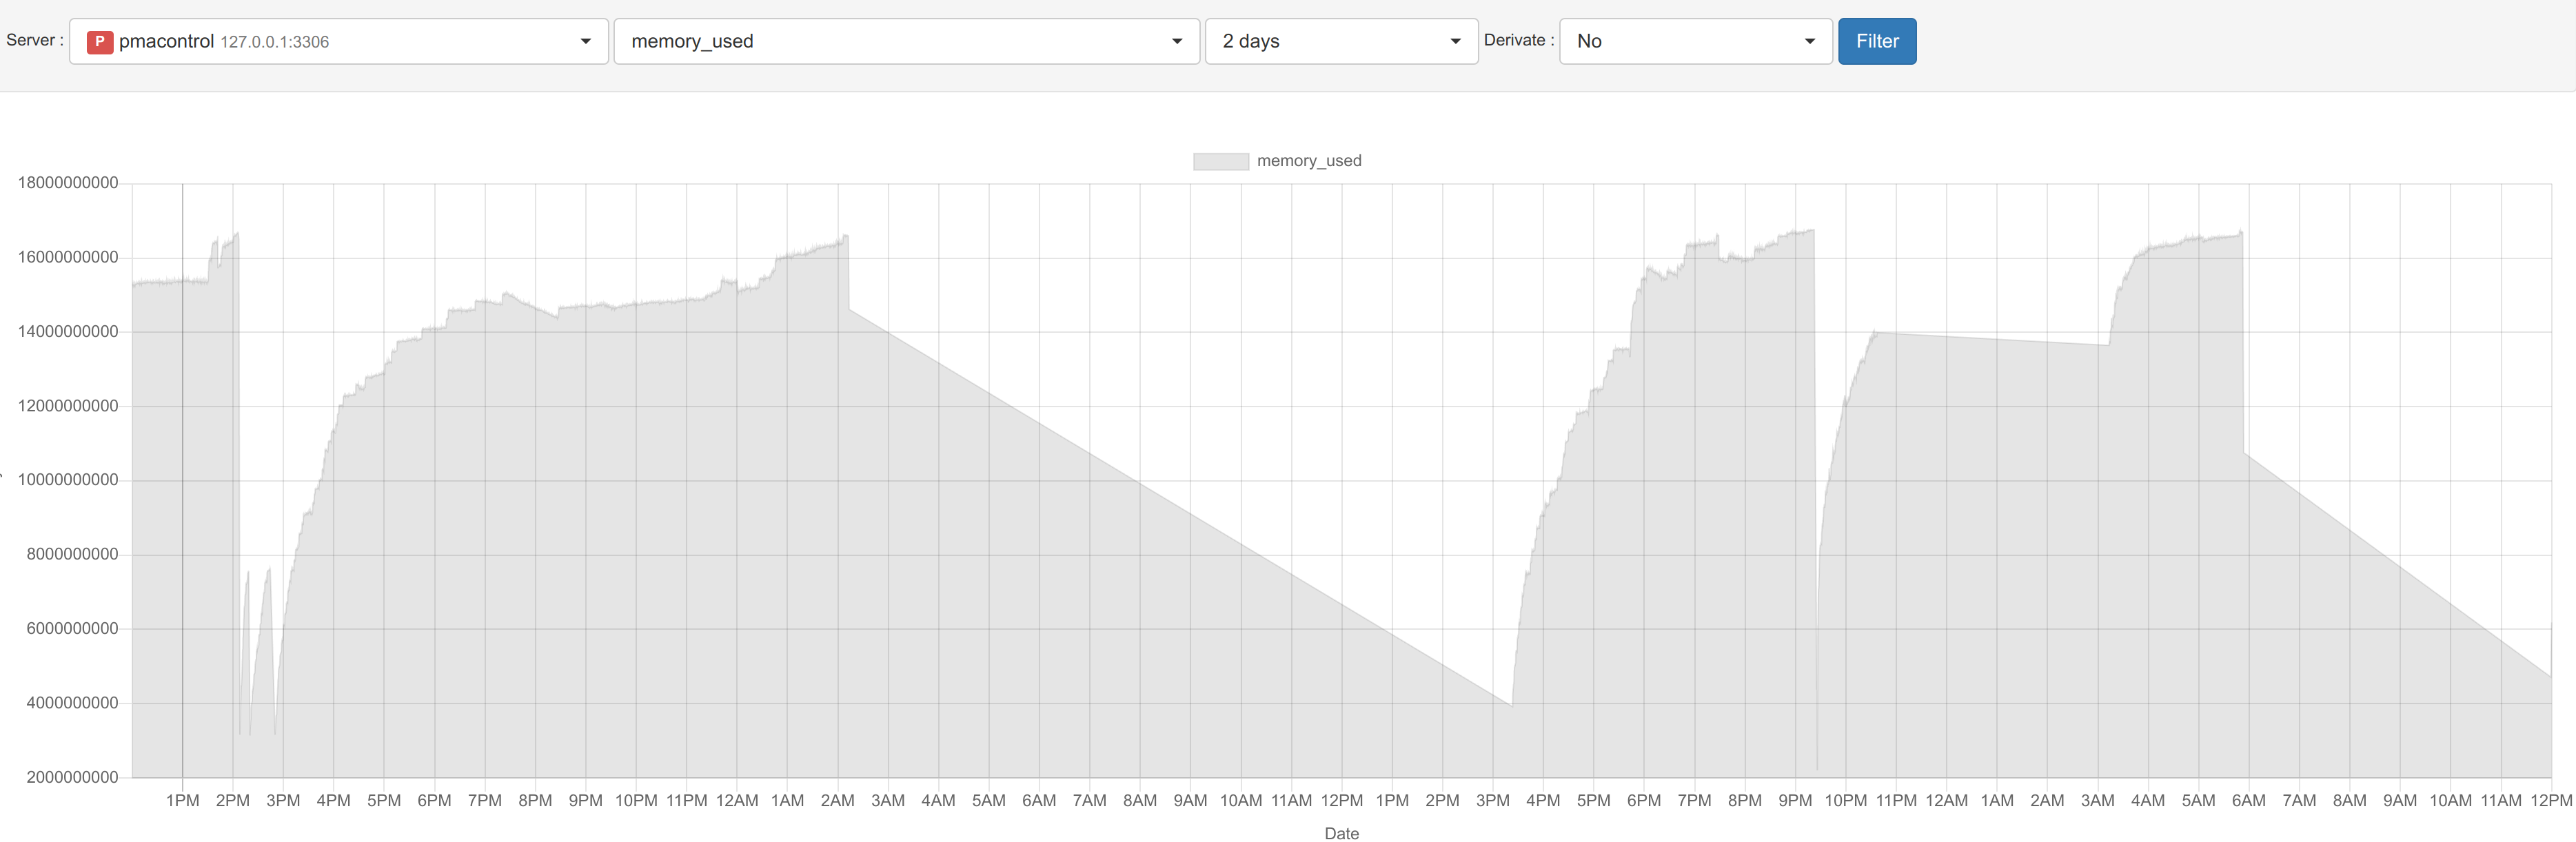
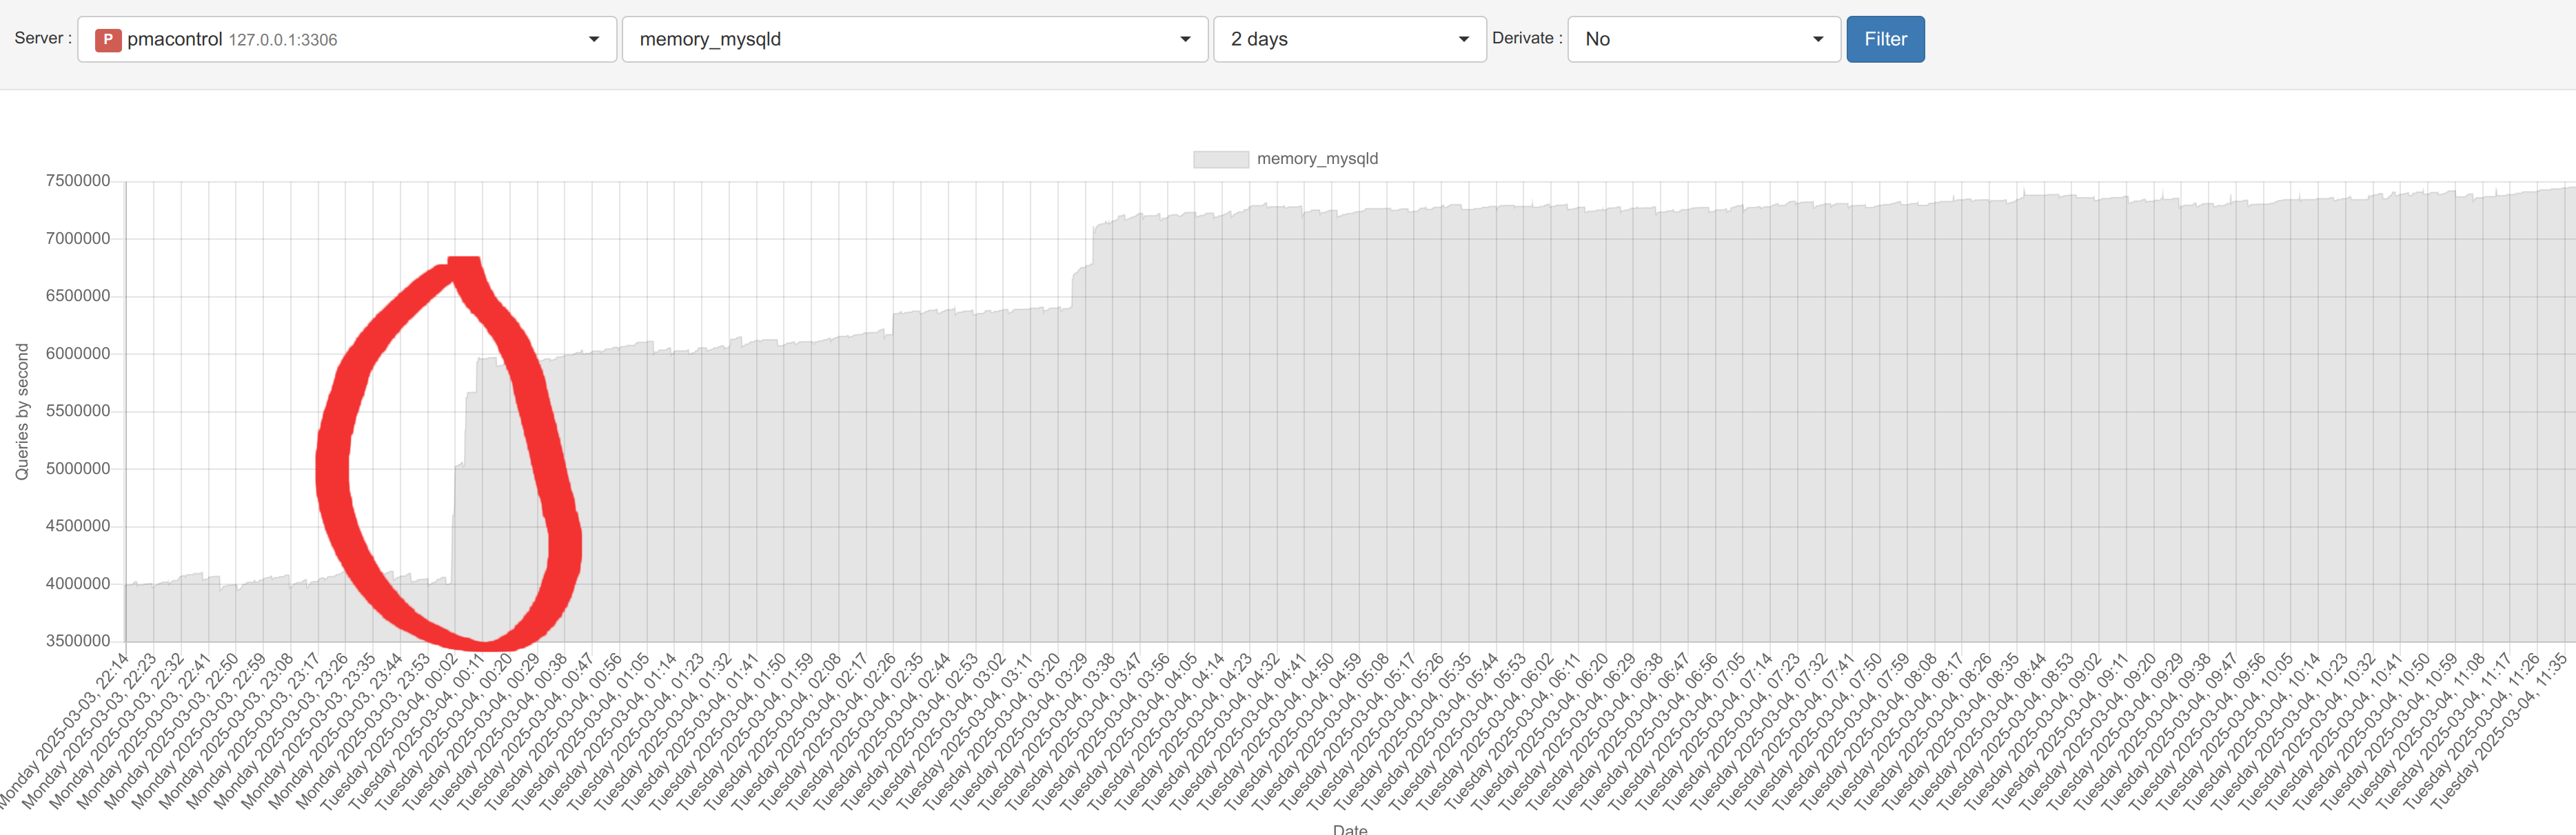
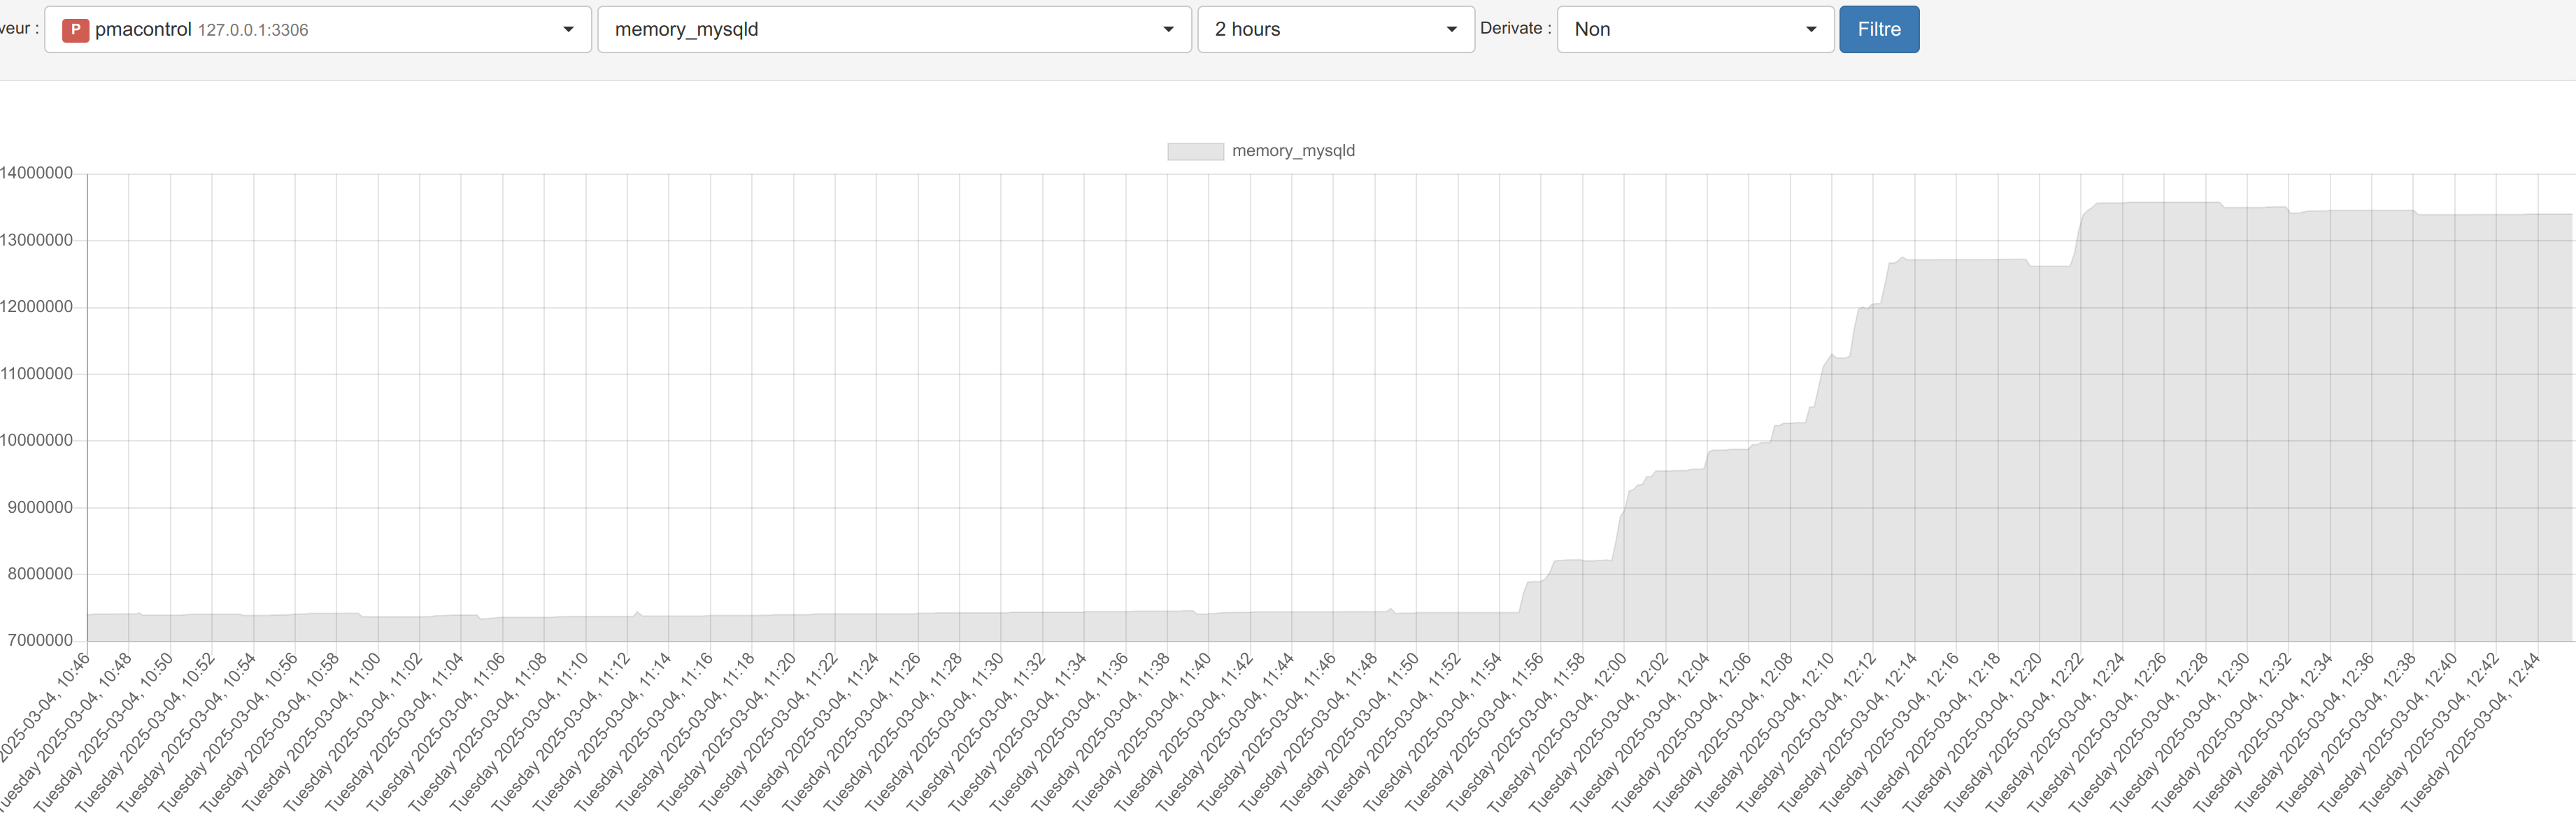
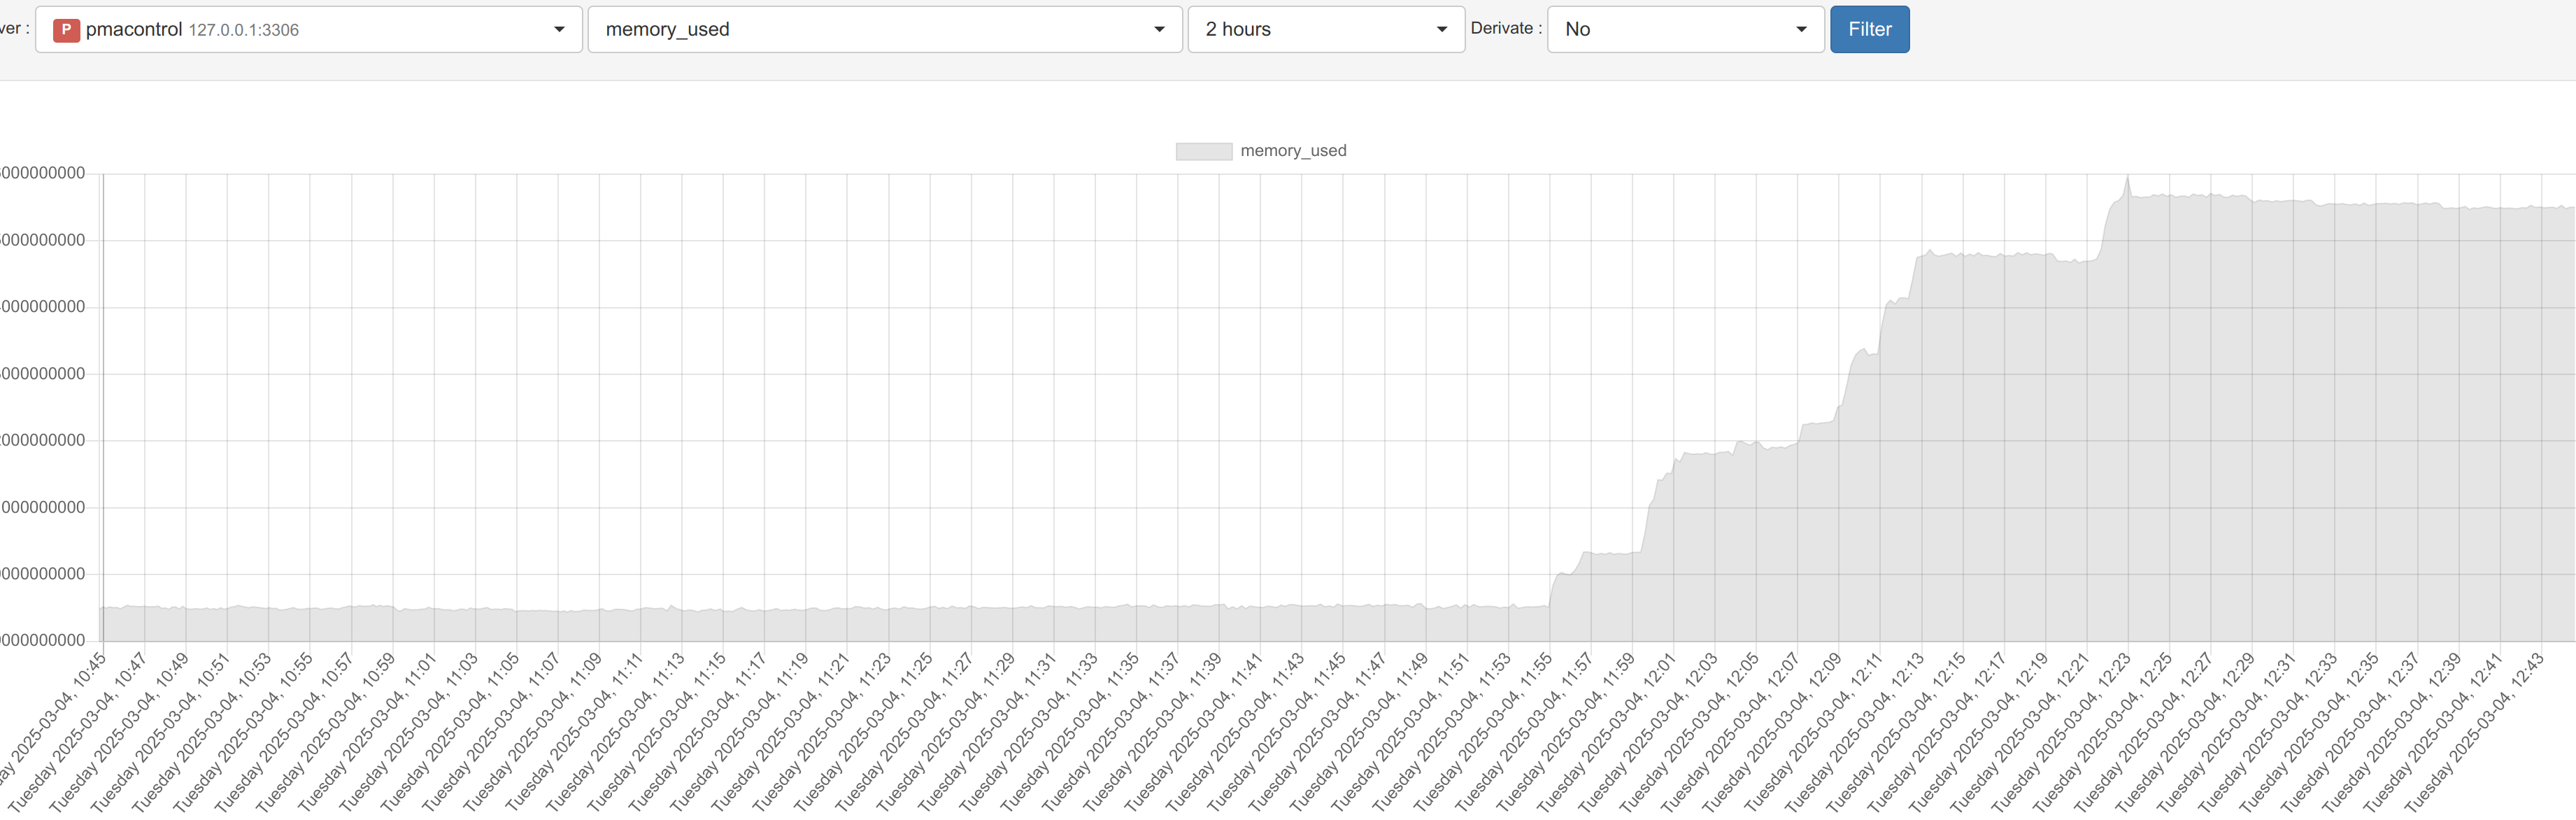
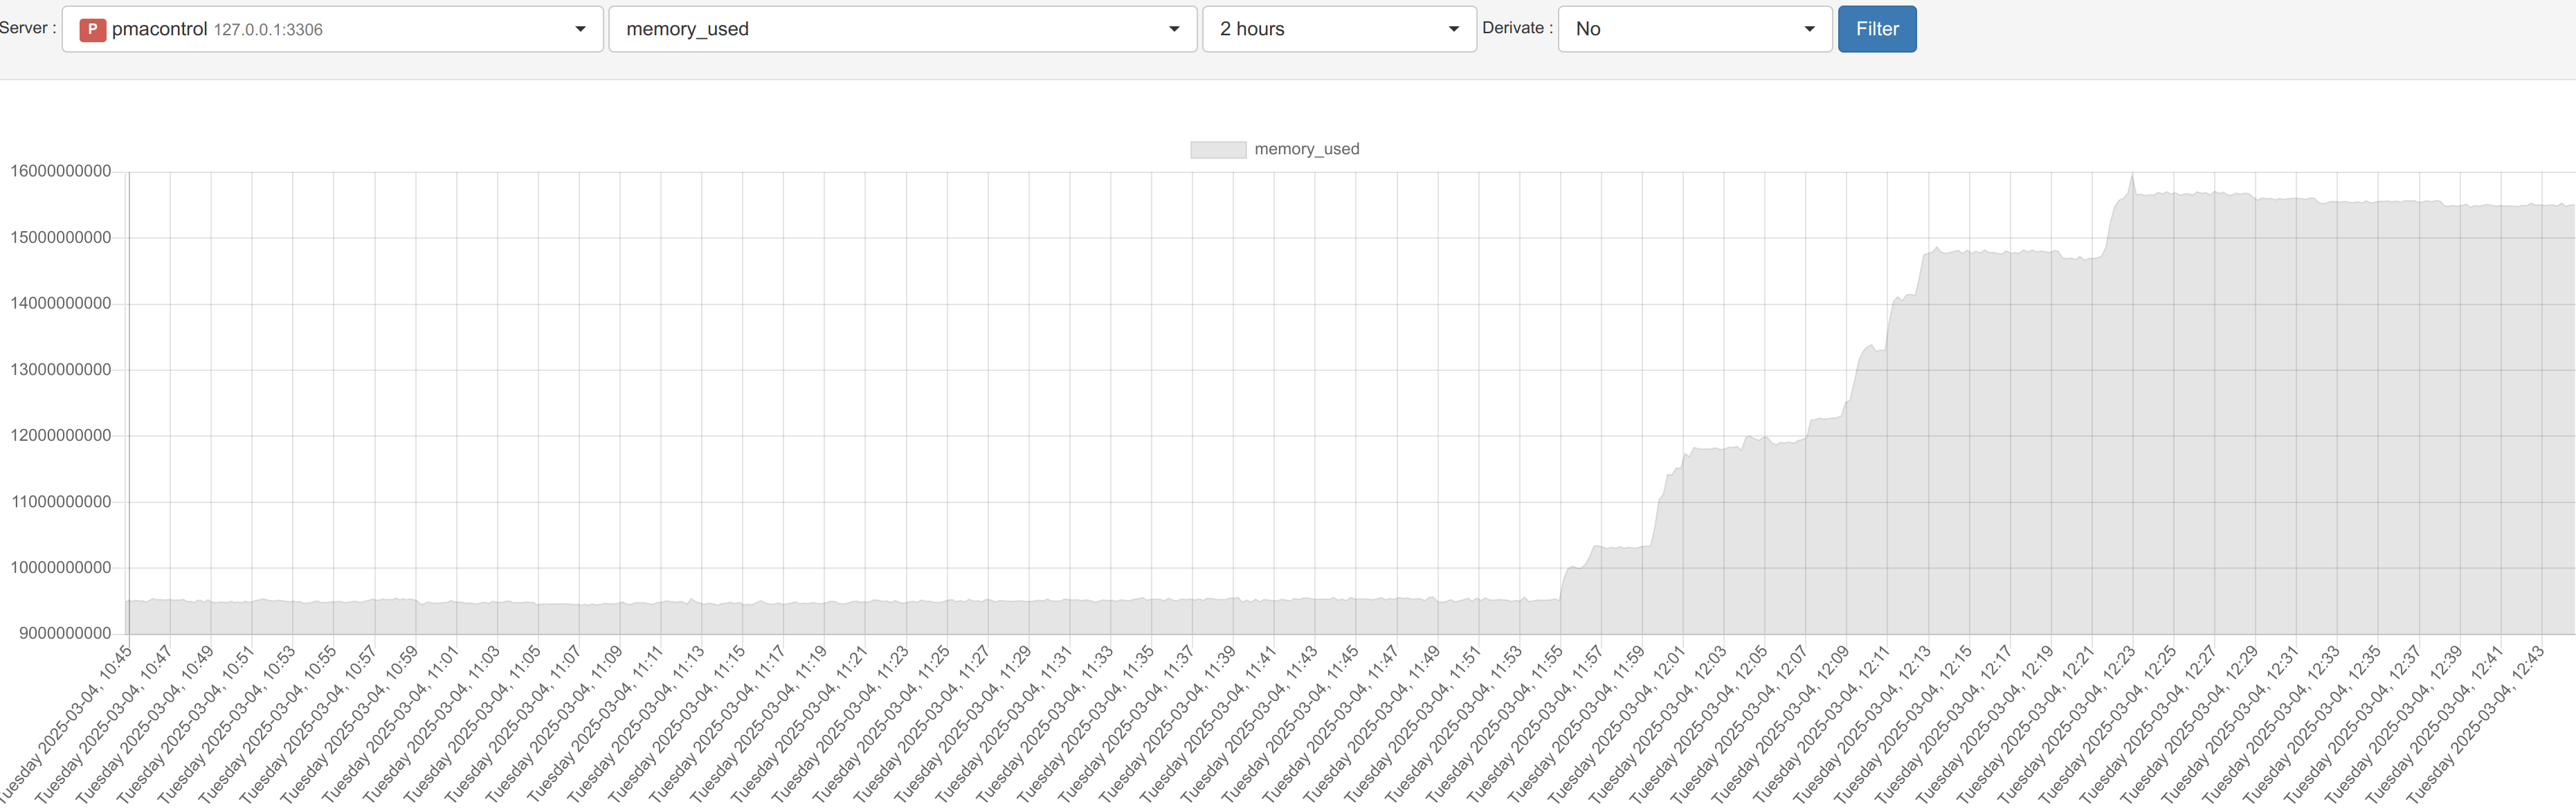
My MyRocks, take more and more memory until InnoDB crash, and mysql crash
The server :
8 Vcpu
16Go RAM
NVME 1To
My configuration :
# MariaDB database server configuration file.
|
#
|
# You can copy this file to one of: |
# - "/etc/mysql/my.cnf" to set global options, |
# - "~/.my.cnf" to set user-specific options. |
#
|
# One can use all long options that the program supports. |
# Run program with --help to get a list of available options and with
|
# --print-defaults to see which it would actually understand and use.
|
#
|
# For explanations see
|
# http://dev.mysql.com/doc/mysql/en/server-system-variables.html |
|
|
# This will be passed to all mysql clients
|
# It has been reported that passwords should be enclosed with ticks/quotes
|
# escpecially if they contain "#" chars... |
# Remember to edit /etc/mysql/debian.cnf when changing the socket location.
|
[client]
|
port = 3306 |
socket = /var/run/mysqld/mysqld.sock
|
|
|
# Here is entries for some specific programs |
# The following values assume you have at least 32M ram
|
|
|
# This was formally known as [safe_mysqld]. Both versions are currently parsed.
|
[mysqld_safe]
|
socket = /var/run/mysqld/mysqld.sock
|
nice = 0 |
|
|
[mysqld]
|
#
|
# * Basic Settings
|
#
|
|
|
rocksdb_allow_concurrent_memtable_write=1 |
rocksdb_allow_to_start_after_corruption=1 |
rocksdb_db_write_buffer_size=256M
|
rocksdb_block_cache_size=4G
|
rocksdb_deadlock_detect=1 |
rocksdb_delayed_write_rate=167772160 |
|
|
rocksdb_table_cache_numshardbits=6 |
rocksdb_wal_recovery_mode=2 |
rocksdb_max_total_wal_size = 2G
|
rocksdb_compaction_readahead_size=1G
|
rocksdb_max_background_jobs=4 |
rocksdb_compaction_readahead_size=16M # Optimisation pour éviter des lectures trop petites
|
rocksdb_use_direct_reads=ON
|
rocksdb_use_direct_io_for_flush_and_compaction=ON
|
rocksdb_skip_fill_cache=ON
|
rocksdb_max_total_wal_size=1G # Limite la taille totale des logs d'écriture
|
|
|
|
|
query_response_time_stats=ON
|
userstat=ON
|
|
|
innodb_autoextend_increment = 1000 |
innodb_strict_mode=1 |
sql_mode=NO_AUTO_CREATE_USER,NO_ENGINE_SUBSTITUTION
|
performance_schema=ON
|
connect_timeout=10 |
innodb_rollback_on_timeout=1 |
wait_timeout=18000 |
|
|
plugin-load=server_audit=server_audit.so
|
|
|
server_audit_logging=1 |
|
|
# do not allow users to uninstall plugin |
server_audit=FORCE_PLUS_PERMANENT
|
|
|
# only audit connections and DDL queries
|
server_audit_events=CONNECT,QUERY_DDL
|
|
|
# flat file
|
server_audit_output_type=FILE
|
server_audit_file_path=/srv/mysql/log/audit.log
|
server_audit_file_rotate_size=1000000 |
server_audit_file_rotations=9 |
|
|
character-set-server = utf8mb4
|
collation-server = utf8mb4_general_ci
|
character_set_server = utf8mb4
|
collation-server = utf8mb4_general_ci
|
#innodb_force_recovery = 1 |
|
|
user = mysql
|
pid-file = /var/run/mysqld/mysqld.pid
|
socket = /var/run/mysqld/mysqld.sock
|
port = 3306 |
basedir = /usr
|
datadir = /srv/mysql/data
|
tmpdir = /srv/mysql/tmp
|
lc_messages_dir = /usr/share/mysql
|
lc_messages = en_US
|
|
|
plugin_dir = /usr/lib/mysql/plugin/
|
|
|
skip-name-resolve
|
|
|
#logs
|
log_error=/srv/mysql/log/error.log
|
|
|
|
|
#
|
# Instead of skip-networking the default is now to listen only on |
# localhost which is more compatible and is not less secure.
|
# bind-address = 127.0.0.1 |
#
|
# * Fine Tuning
|
#
|
max_connections = 1000 |
connect_timeout = 10 |
wait_timeout = 600 |
max_allowed_packet = 256M
|
thread_cache_size = 128 |
sort_buffer_size = 4M
|
bulk_insert_buffer_size = 16M
|
tmp_table_size = 256M
|
max_heap_table_size = 256M
|
#
|
# * MyISAM
|
#
|
# This replaces the startup script and checks MyISAM tables if needed |
# the first time they are touched. On error, make copy and try a repair. |
myisam_recover_options = BACKUP
|
key_buffer_size = 128M
|
open-files-limit = 2000 |
table_open_cache = 400 |
myisam_sort_buffer_size = 512M
|
concurrent_insert = 2 |
read_buffer_size = 2M
|
read_rnd_buffer_size = 1M
|
key_cache_segments = 64 |
|
|
#mroonga.replicate_rewrite_db="repl->repl2" |
#mroonga.replicate_do_table="repl2.article2" |
|
|
#
|
# * Query Cache Configuration
|
#
|
# Cache only tiny result sets, so we can fit more in the query cache.
|
query_cache_limit = 128K
|
query_cache_size = 0 |
# for more write intensive setups, set to DEMAND or OFF |
query_cache_type = OFF
|
#
|
# * Logging and Replication
|
#
|
# Both location gets rotated by the cronjob.
|
# Be aware that this log type is a performance killer. |
# As of 5.1 you can enable the log at runtime! |
general_log_file = /srv/mysql/log/general.log
|
#general_log = 1 |
#
|
# Error logging goes to syslog due to /etc/mysql/conf.d/mysqld_safe_syslog.cnf.
|
#
|
# we do want to know about network errors and such |
log_warnings = 2 |
#
|
# Enable the slow query log to see queries with especially long duration |
slow_query_log=1 |
slow_query_log_file = /srv/mysql/log/mariadb-slow.log
|
long_query_time=1 |
#log_slow_rate_limit = 1000 |
log_slow_verbosity = query_plan
|
log_slave_updates = 1 |
#log-queries-not-using-indexes
|
#log_slow_admin_statements
|
#
|
# The following can be used as easy to replay backup logs or for replication. |
# note: if you are setting up a replication slave, see README.Debian about |
# other settings you may need to change.
|
server-id = 394663081 |
|
|
report_host = ist-pmacontrol
|
|
|
#auto_increment_increment = 2 |
#auto_increment_offset = 1 |
log_bin = /srv/mysql/binlog/mariadb-bin
|
log_bin_index = /srv/mysql/binlog/mariadb-bin.index
|
# not fab for performance, but safer |
sync_binlog = 10000 |
expire_logs_days = 1 |
|
|
#to be more easy for SHOW BINLOG EVENTS (1G => 100M) |
max_binlog_size = 100M
|
|
|
# slaves
|
relay_log = /srv/mysql/relaylog/relay-bin
|
relay_log_index = /srv/mysql/relaylog/relay-bin.index
|
relay_log_info_file = /srv/mysql/relaylog/relay-bin.info
|
|
|
log_slave_updates
|
|
|
#read_only
|
|
|
#
|
# If applications support it, this stricter sql_mode prevents some |
# mistakes like inserting invalid dates etc.
|
# sql_mode = NO_ENGINE_SUBSTITUTION,TRADITIONAL
|
#
|
# * InnoDB
|
#
|
# InnoDB is enabled by default with a 10MB datafile in /var/lib/mysql/. |
# Read the manual for more InnoDB related options. There are many! |
default_storage_engine = InnoDB
|
# you can't just change log file size, requires special procedure
|
innodb_log_file_size = 2G
|
innodb_buffer_pool_size = 1G
|
#innodb_buffer_pool_instances=8 ## removed for 10.7 |
innodb_log_buffer_size = 8M
|
innodb_file_per_table = 1 |
innodb_open_files = 400 |
innodb_io_capacity = 2000 |
innodb_flush_method = O_DIRECT
|
#
|
# * Security Features
|
|
|
#
|
# Read the manual, too, if you want chroot! |
# chroot = /var/lib/mysql/
|
#
|
# For generating SSL certificates I recommend the OpenSSL GUI "tinyca". |
#
|
# ssl-ca=/etc/mysql/cacert.pem
|
# ssl-cert=/etc/mysql/server-cert.pem
|
# ssl-key=/etc/mysql/server-key.pem
|
|
|
|
|
|
|
#
|
# * Galera-related settings
|
event-scheduler = ON
|
#
|
|
|
|
|
[galera]
|
# Mandatory settings
|
wsrep_on=OFF
|
wsrep_cluster_name='68Koncept' |
wsrep_provider=/usr/lib/galera/libgalera_smm.so
|
wsrep_cluster_address=gcomm:// |
wsrep_node_address=10.68.68.111 2a01:cb00:416:9400:be24:11ff:fead:aced |
wsrep_node_name=ist-pmacontrol
|
wsrep_gtid_mode=ON
|
|
|
wsrep_sst_method = xtrabackup-v2
|
wsrep_sst_auth = 'sst:QSEDWGRg133' |
|
|
wsrep_provider_options="gcache.size = 20G" |
wsrep_max_ws_rows = 500000 |
|
|
|
|
binlog_format=row
|
default_storage_engine=InnoDB
|
innodb_autoinc_lock_mode=2 |
|
|
#
|
# Allow server to accept connections on all interfaces.
|
#
|
bind-address=0.0.0.0 |
#
|
# Optional setting
|
wsrep_slave_threads=4 |
innodb_flush_log_at_trx_commit=2 |
|
|
# DBUG options for wsrep provider |
#wsrep_dbug_option
|
|
|
# Generate fake primary keys for non-PK tables (required for multi-master |
# and parallel applying operation)
|
wsrep_certify_nonPK=1 |
|
|
# Location of the directory with data files. Needed for non-mysqldump |
# state snapshot transfers. Defaults to mysql_real_data_home.
|
#wsrep_data_home_dir=
|
|
|
# Maximum number of rows in write set
|
wsrep_max_ws_rows=131072 |
|
|
# Maximum size of write set
|
wsrep_max_ws_size=1073741824 |
|
|
# to enable debug level logging, set this to 1 |
wsrep_debug=0 |
|
|
# convert locking sessions into transactions
|
wsrep_convert_LOCK_to_trx=0 |
|
|
# how many times to retry deadlocked autocommits
|
wsrep_retry_autocommit=1 |
|
|
# change auto_increment_increment and auto_increment_offset automatically
|
wsrep_auto_increment_control=1 |
|
|
# replicate myisam
|
## wsrep_replicate_myisam=1 #removed in 10.7 |
|
|
|
|
|
|
# retry autoinc insert, which failed for duplicate key error |
wsrep_drupal_282555_workaround=0 |
|
|
# enable "strictly synchronous" semantics for read operations |
wsrep_causal_reads=0 |
|
|
# Protocol version to use
|
# wsrep_protocol_version=
|
|
|
# log conflicts
|
wsrep_log_conflicts=1 |
|
|
|
|
|
|
[xtrabackup]
|
user=sst
|
password=QSEDWGRg133
|
databases-exclude=lost+found
|
|
|
[mysqldump]
|
quick
|
quote-names
|
max_allowed_packet = 256M
|
|
|
[mysql]
|
#no-auto-rehash # faster start of mysql but no tab completion
|
|
|
[isamchk]
|
key_buffer = 16M
|
|