Details
-
Bug
-
Status: Closed (View Workflow)
-
 Major
Major
-
Resolution: Fixed
-
10.5.7, 10.6.17, 10.6.18, 10.11.8
Description
Summary
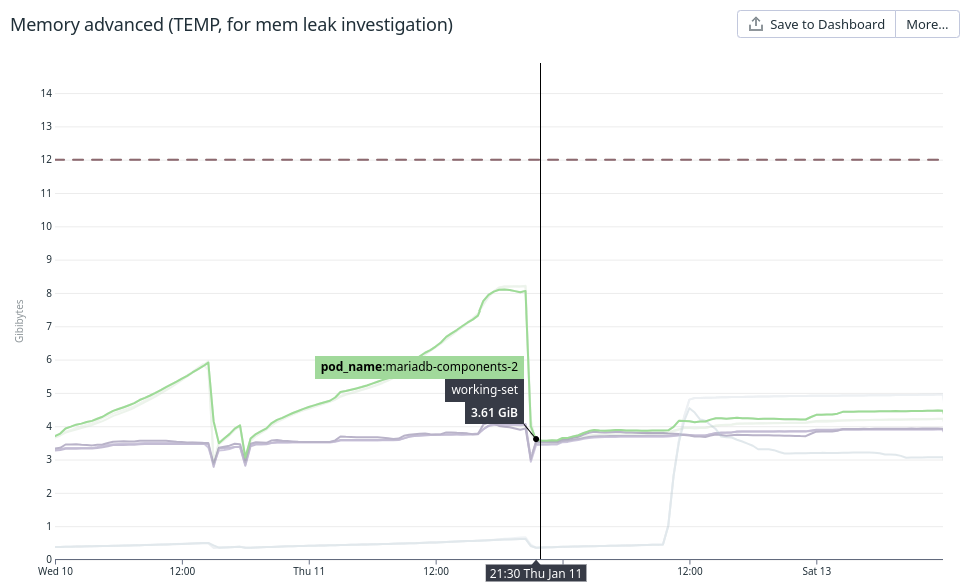
On many MariaDB Galera clusters deployed in Kubernetes, after migrating from 10.4 to 10.6, we observed a brutal and consistent change in the pattern of working-set memory (WS). The resident state size memory (RSS), that used to be very correlated to the WS, is stable; only the WS is affected by the leak. This behaviour consistently reproduces all the time: after the usual warmup phase, a slow leak starts, with WS slowly diverging from the RSS.
Working-set memory is what is used by Kubernetes to trigger out-of-memory pod restarts. That is why this leak is potentially impactful for us.
We have investigated on Kubernetes side too (and are open to suggestions of course), however, so far we could not identify why it happened after the upgrade from 10.4.31 to >=10.6.17. The situation reproduced on every cluster upgraded so far. However, on some larger clusters (>100GB buffer pool size) the leak is fortunately not very apparent.
The leak also takes place on one 10.11 cluster. That cluster was never upgraded but was created directly in 10.11.
Our main expectation is the following: gaining insights about any low-level changes that have been introduced between the latest 10.4 and 10.6, and that would be likely to trigger this behavior.
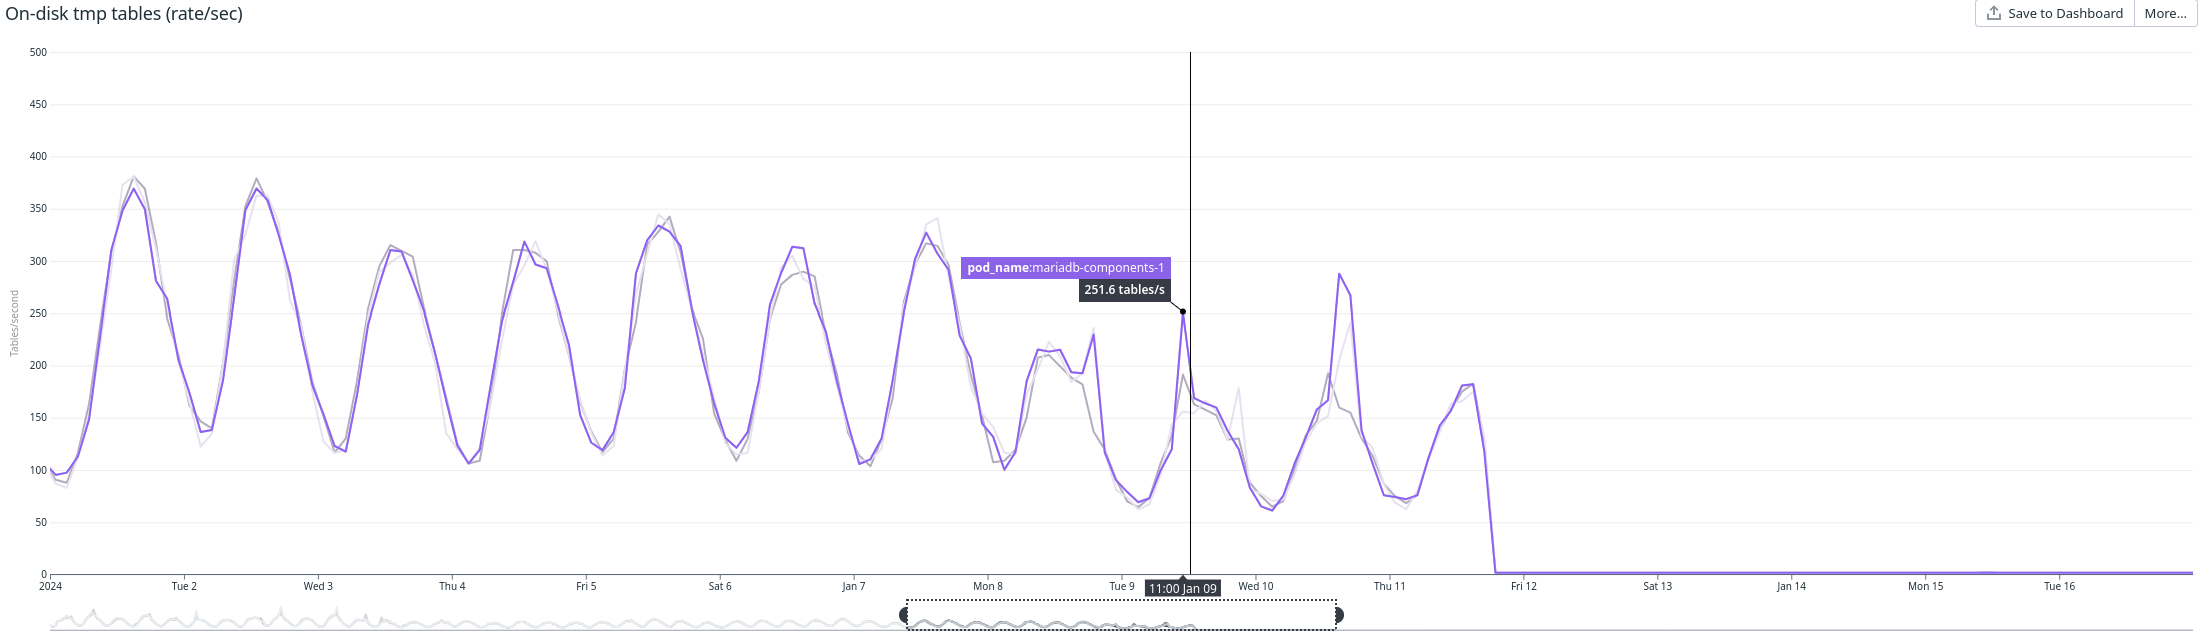
We found it seems to be related to temporary tables, but we could not identify any specific new usage or major changes between the versions.
It could be interesting if you know if there were significant changes in how temporary tables are managed. For instance, you might know if the pattern of {{fsync}}s changed compared to 10.4, or not at all.
I'm attaching a screenshot of our memory monitoring right after the upgrade.
Technical investigation
Stable system monitoring variables
By monitoring /sys/fs/cgroup/memory/memory.stat (cgroupv1), here's what we see:
- RSS remain stable. When taking continuous traces, it grows while the buffer pool is warming, after that it remains stable as expected. We do not expect any leak there;
- anon allocations do not show any correlation as well;
- mapped_files are strictly stable, no variations over from day to day;
- the cache takes longer to stabilize but its increase does not seem to match working-set memory;
- lsof outputs are stable over time, we do not see any increase of lines returned;
- performance schemas memory table are stable over time, we do not see any increase in current memory used.
Increasing system variable: active files
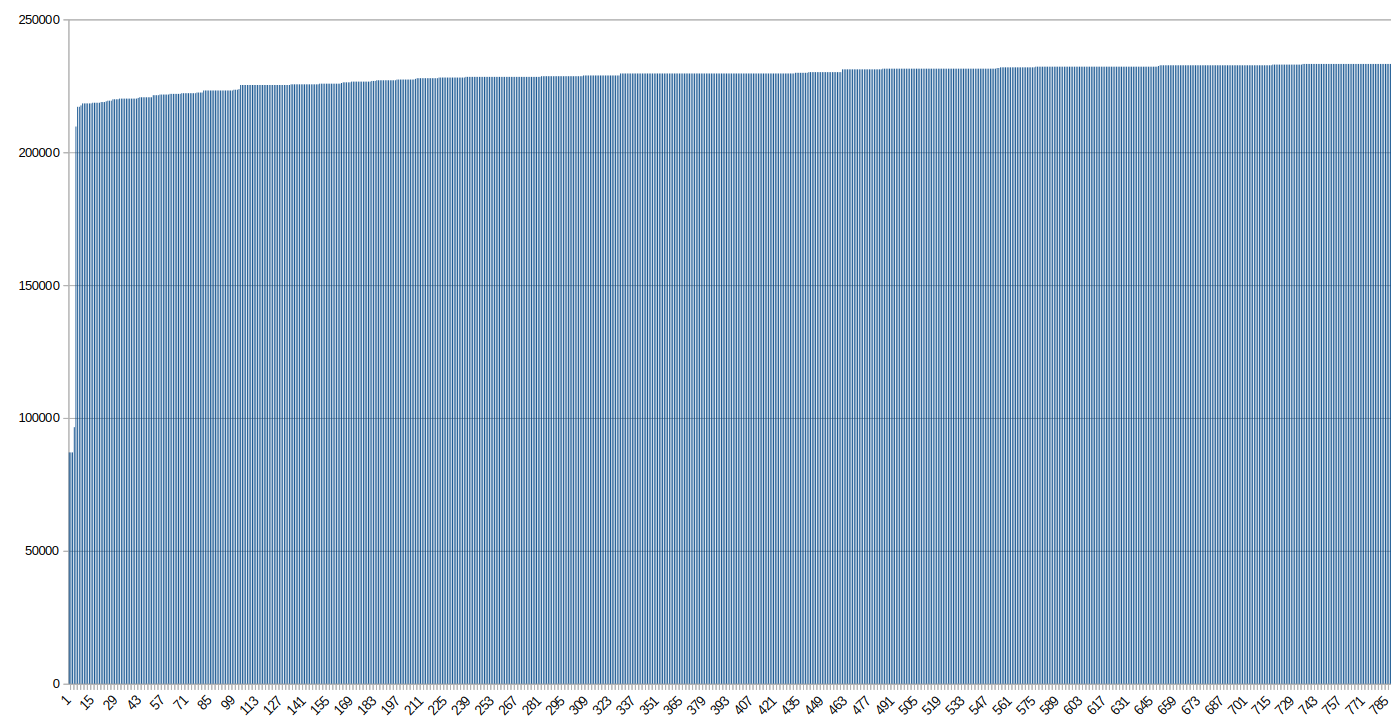
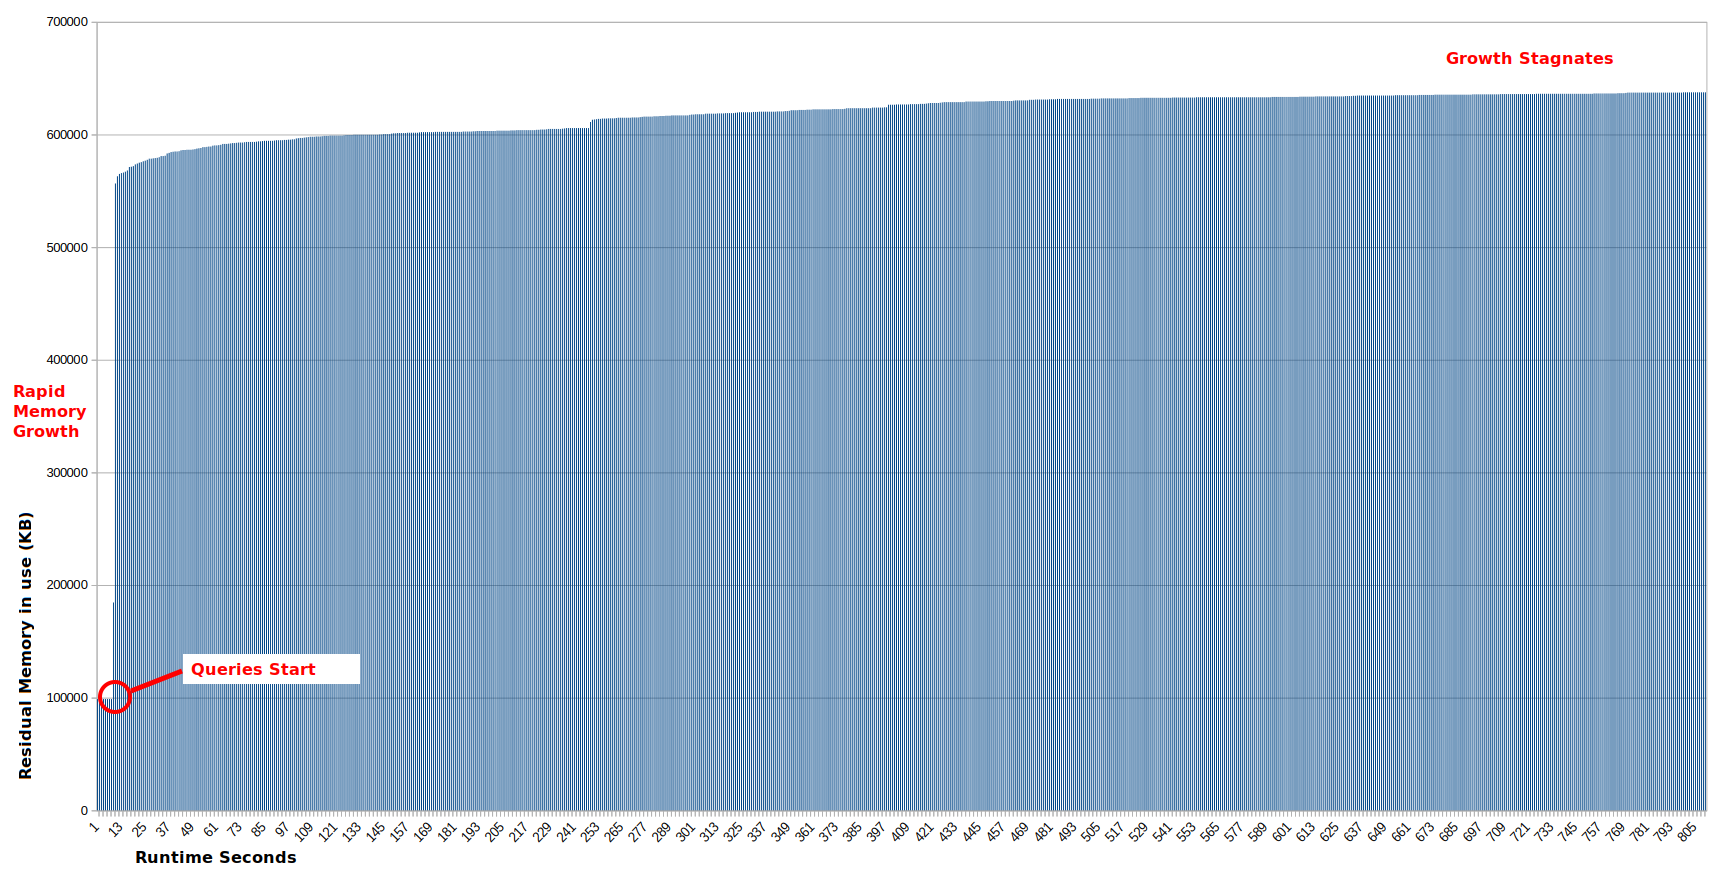
The only significant change we noticed was a steep and constant increase of active_file.
Starting from a warm MariaDB with an uptime of 346868 seconds (4 days), over the next 4 days active_file grows quickly
DATE: Mon Apr 8 16:32:38 UTC 2024
|
| Uptime | 346868 |
|
active_file 864256
|
|
|
DATE: Tue Apr 9 10:00:53 UTC 2024
|
| Uptime | 409763 |
|
active_file 2609152
|
|
|
DATE: Thu Apr 11 12:45:30 UTC 2024
|
| Uptime | 592440 |
|
active_file 36868096
|
active_file counts toward the workingset memory calculation (https://github.com/kubernetes/kubernetes/issues/43916).
MariaDB 10.4 vs 10.6 comparison
When we compared running 10.4 and 10.6 clusters, here's what we found:
- In both images, only innodb_flush_method = O_direct is used. It's by default with mariadb docker images. Method fsync would have explained a different memory usage.
- innodb_flush_log_at_trx_commit = 2. After and before upgrade, we did not try to set it to 1 to avoid impact
- both use jemalloc as malloc lib (note: using tcmalloc with 10.6 was tested and does not solve the leak).
- galera.cache have not been changed (and mmap files are stable), we don't see usage of additional gcache pages
- there are no usages of explicit temporary tables, no DDLs
- innodb_adaptive_hash_index was tried both disabled and enabled, it did not seem to improve the issue. (It was disabled by default in 10.6, so we tried to match the 10.4 tuning.)
- both 10.4 and 10.6 workload have a high buffer pool miss rate: Buffer pool hit rate 936 / 1000, young-making rate 36 / 1000 not 126 / 1000.
Differences in raw parameters
Variable /tmp/mariadb_104 /tmp/mariadb_106
|
========================= ========================= =========================
|
back_log 70 80
|
bulk_insert_buffer_size 16777216 8388608
|
concurrent_insert ALWAYS AUTO
|
connect_timeout 5 10
|
innodb_adaptive_hash_i... ON OFF
|
innodb_change_buffering all none
|
innodb_checksum_algorithm crc32 full_crc32
|
innodb_lru_scan_depth 1024 1536
|
innodb_max_dirty_pages... 75.000000 90.000000
|
innodb_purge_batch_size 300 1000
|
max_recursive_iterations 4294967295 1000
|
max_relay_log_size 104857600 1073741824
|
pseudo_thread_id 45 29
|
slave_parallel_mode conservative optimistic
|
sort_buffer_size 4194304 2097152
|
table_open_cache 400 2000
|
thread_cache_size 100 151
|
wait_timeout 600 28800
|
Some of those variables had new default values in 10.6, but they were already tuned explicitly in the custom my.cnf.
Both 10.4 and 10.6 are running in the same Kubernetes cluster.
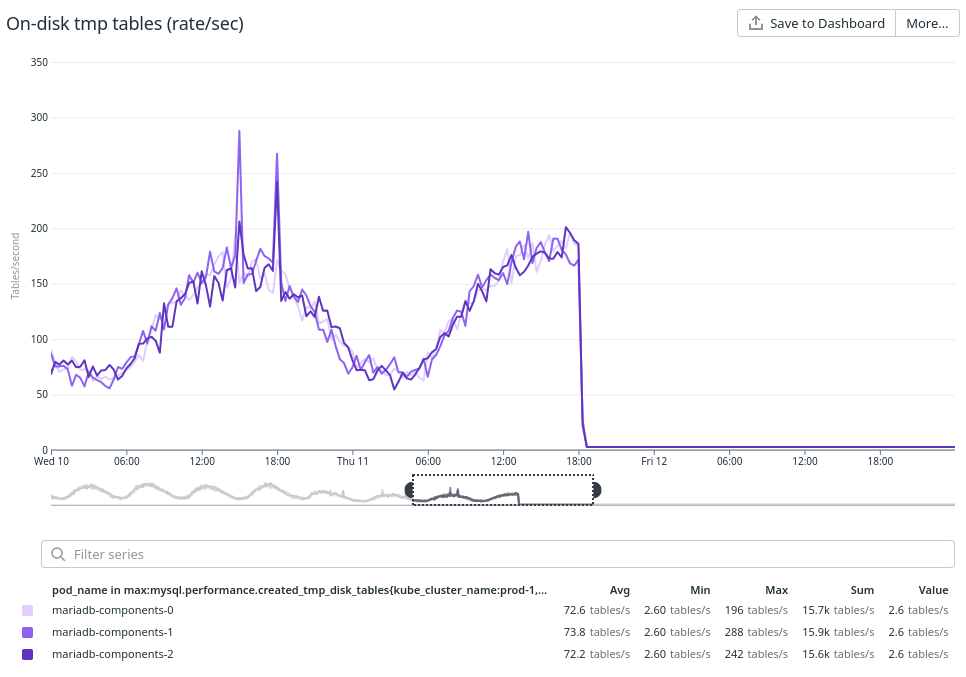
Temporary tables
So far, we only found that reducing the amount of implicit temporary tables usage reduces the "leak". This reduction does not remove the leak, but it makes it happen slower.
Things we did not try
- comparing pmap over time;
- jemalloc profiling (as RSS is stable);
- any strace, perf, or any ebpf based tool. Without having a clear plan on what to track, we skipped as those can be costly.
- removing entirely the temp tables used in a test cluster.
TL;DR: workaround
To work around this issue quickly, it is enough to add the --temp-pool=1 flag to the mariadbd (or mysqld) program command.
Archived environment (no longer applicable) label:
Kubernetes cluster, managed by GCP (GKE cluster)
|
Kubernetes version: 1.28.9-gke.1289000.
|
Dedicated nodepool with cgroup v1 (switching to cgroup v2 does not resolve), virtual machine type n2d-highmem-32.
|
Docker images: from MariaDB, e.g. mariadb:10.6.18 (Docker Hub).
|
Other: uses Galera replication. No Kubernetes operators.
|
Attachments


Issue Links
- relates to
-
MDEV-22278 change temp-pool to be 0 by default
-

- Closed
-
-
MDEV-35860 use O_TMPFILE for (implicit) temporary Aria/MyISAM tables
-
- Open
-
-
-
- Closed
-
