Details
-
Bug
-
Status: Closed (View Workflow)
-
 Major
Major
-
Resolution: Incomplete
-
10.6.12
-
None
-
None
-
EL8, mariadb 10.6.12 (official yum repo)
Description
After upgrading from mariadb 10.3 to 10.6 we are having a lot of issues with memory filling up and abnormal memory usage.
General info:
# cat /etc/redhat-release
|
Red Hat Enterprise Linux release 8.7 (Ootpa) |
|
|
# uname -a
|
Linux xxxxxxxxx 4.18.0-425.19.2.el8_7.x86_64 #1 SMP Fri Mar 17 01:52:38 EDT 2023 x86_64 x86_64 x86_64 GNU/Linux |
|
|
# rpm -qa | grep -i maria
|
MariaDB-common-10.6.12-1.el8.x86_64 |
MariaDB-shared-10.6.12-1.el8.x86_64 |
MariaDB-client-10.6.12-1.el8.x86_64 |
MariaDB-server-10.6.12-1.el8.x86_64 |
|
|
# yum info jemalloc
|
Installed Packages
|
Name : jemalloc
|
Version : 5.2.1 |
Release : 2.el8 |
Architecture : x86_64
|
Size : 762 k |
Source : jemalloc-5.2.1-2.el8.src.rpm |
Repository : @System |
From repo : epel
|
Summary : General-purpose scalable concurrent malloc implementation
|
URL : http://www.canonware.com/jemalloc/ |
License : BSD
|
Description : General-purpose scalable concurrent malloc(3) implementation. |
: This distribution is the stand-alone "portable" implementation of jemalloc. |
|
|
|
|
MariaDB [(none)]> SHOW VARIABLES LIKE 'version_malloc_library'; |
+------------------------+------------------------------------------------------------+
|
| Variable_name | Value |
|
+------------------------+------------------------------------------------------------+
|
| version_malloc_library | jemalloc 5.2.1-0-gea6b3e973b477b8061e0076bb257dbd7f3faa756 | |
+------------------------+------------------------------------------------------------+
|
|
|
# mysqltuner (partial output)
|
[--] Up for: 2d 0h 17m 59s (4M q [26.215 qps], 73K conn, TX: 36G, RX: 2G) |
[--] Reads / Writes: 46% / 54% |
[--] Binary logging is enabled (GTID MODE: ON)
|
[--] Physical Memory : 15.4G |
[--] Max MySQL memory : 7.5G |
[--] Other process memory: 0B
|
[--] Total buffers: 6.4G global + 18.9M per thread (51 max threads) |
[--] Performance_schema Max memory usage: 165M
|
[--] Galera GCache Max memory usage: 0B
|
[OK] Maximum reached memory usage: 6.8G (44.24% of installed RAM) |
[OK] Maximum possible memory usage: 7.5G (48.66% of installed RAM) |
[OK] Overall possible memory usage with other process is compatible with memory available
|
|
|
# free -m
|
total used free shared buff/cache available
|
Mem: 15800 12454 433 129 2911 2871 |
Swap: 7995 5717 2278 |
|
|
|
|
# top
|
PID USER PR NI VIRT RES SHR S %CPU %MEM TIME+ COMMAND
|
21026 mysql 20 0 22.8g 11.6g 14676 S 0.7 75.1 186:12.70 mariadbd |
|
|
|
|
MariaDB [(none)]> SHOW ENGINE INNODB STATUS \G;
|
*************************** 1. row *************************** |
Type: InnoDB
|
Name:
|
Status:
|
=====================================
|
2023-04-30 13:44:34 0x7f17f729c700 INNODB MONITOR OUTPUT |
=====================================
|
Per second averages calculated from the last 21 seconds |
-----------------
|
BACKGROUND THREAD
|
-----------------
|
srv_master_thread loops: 0 srv_active, 0 srv_shutdown, 184831 srv_idle |
srv_master_thread log flush and writes: 184819 |
----------
|
SEMAPHORES
|
----------
|
------------
|
TRANSACTIONS
|
------------
|
Trx id counter 108643 |
Purge done for trx's n:o < 108643 undo n:o < 0 state: running |
History list length 3 |
LIST OF TRANSACTIONS FOR EACH SESSION:
|
---TRANSACTION (0x7f17f8845480), not started |
0 lock struct(s), heap size 1128, 0 row lock(s) |
--------
|
FILE I/O
|
--------
|
Pending flushes (fsync) log: 0; buffer pool: 0 |
4712675 OS file reads, 783405 OS file writes, 115892 OS fsyncs |
0.00 reads/s, 0 avg bytes/read, 0.00 writes/s, 0.00 fsyncs/s |
-------------------------------------
|
INSERT BUFFER AND ADAPTIVE HASH INDEX
|
-------------------------------------
|
Ibuf: size 1, free list len 0, seg size 2, 0 merges |
merged operations:
|
insert 0, delete mark 0, delete 0 |
discarded operations:
|
insert 0, delete mark 0, delete 0 |
0.00 hash searches/s, 0.00 non-hash searches/s |
---
|
LOG
|
---
|
Log sequence number 23625243328 |
Log flushed up to 23625243328 |
Pages flushed up to 22665988754 |
Last checkpoint at 22665988754 |
0 pending log flushes, 0 pending chkp writes |
88183 log i/o's done, 0.00 log i/o's/second |
----------------------
|
BUFFER POOL AND MEMORY
|
----------------------
|
Total large memory allocated 6476005376 |
Dictionary memory allocated 43952088 |
Buffer pool size 389376 |
Free buffers 0 |
Database pages 389376 |
Old database pages 143735 |
Modified db pages 206924 |
Percent of dirty pages(LRU & free pages): 53.142 |
Max dirty pages percent: 90.000 |
Pending reads 0 |
Pending writes: LRU 0, flush list 0 |
Pages made young 2346394, not young 729301125 |
0.00 youngs/s, 0.00 non-youngs/s |
Pages read 4710099, created 324293, written 686951 |
0.00 reads/s, 0.00 creates/s, 0.00 writes/s |
Buffer pool hit rate 1000 / 1000, young-making rate 0 / 1000 not 0 / 1000 |
Pages read ahead 0.00/s, evicted without access 0.00/s, Random read ahead 0.00/s |
LRU len: 389376, unzip_LRU len: 0 |
I/O sum[0]:cur[0], unzip sum[0]:cur[0] |
--------------
|
ROW OPERATIONS
|
--------------
|
0 read views open inside InnoDB |
Process ID=0, Main thread ID=0, state: sleeping |
Number of rows inserted 10565449, updated 146566, deleted 9102732, read 2299931488 |
0.00 inserts/s, 0.00 updates/s, 0.00 deletes/s, 817.44 reads/s |
Number of system rows inserted 0, updated 0, deleted 0, read 0 |
0.00 inserts/s, 0.00 updates/s, 0.00 deletes/s, 0.00 reads/s |
----------------------------
|
END OF INNODB MONITOR OUTPUT
|
============================
|
`show global status;` and `my.conf` as attachments.
1) After a service restart, the "normal" (backup/restore using mysqldump/restore disabled/not executed) memory usage seems to be around 11.5/12 GB: is that normal? Should it not be 7.5 GB max?
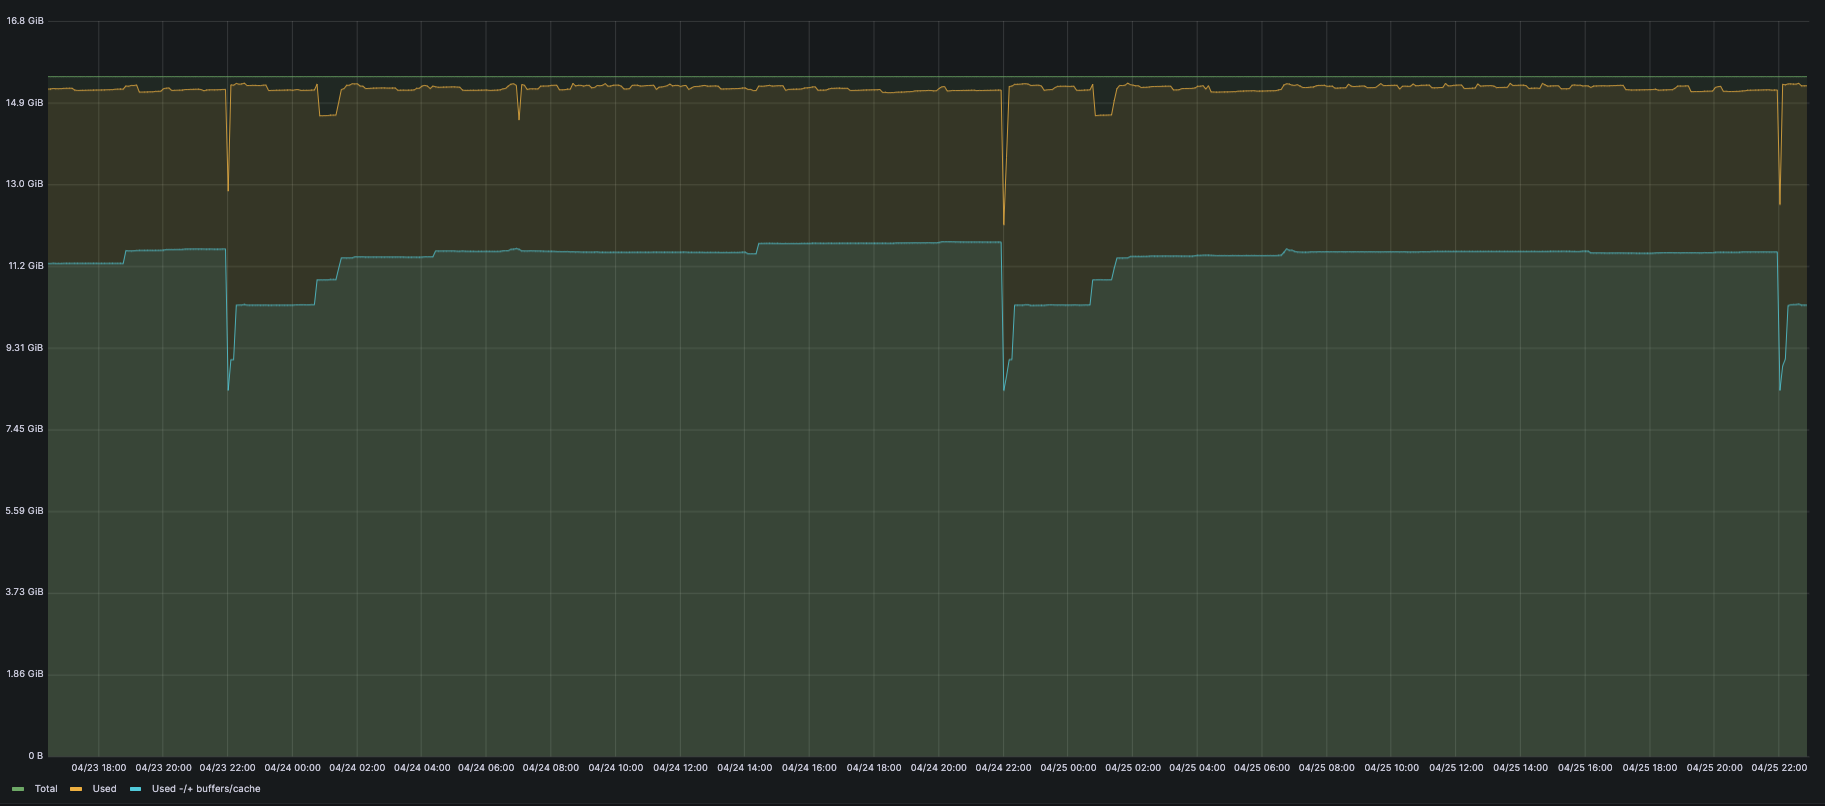
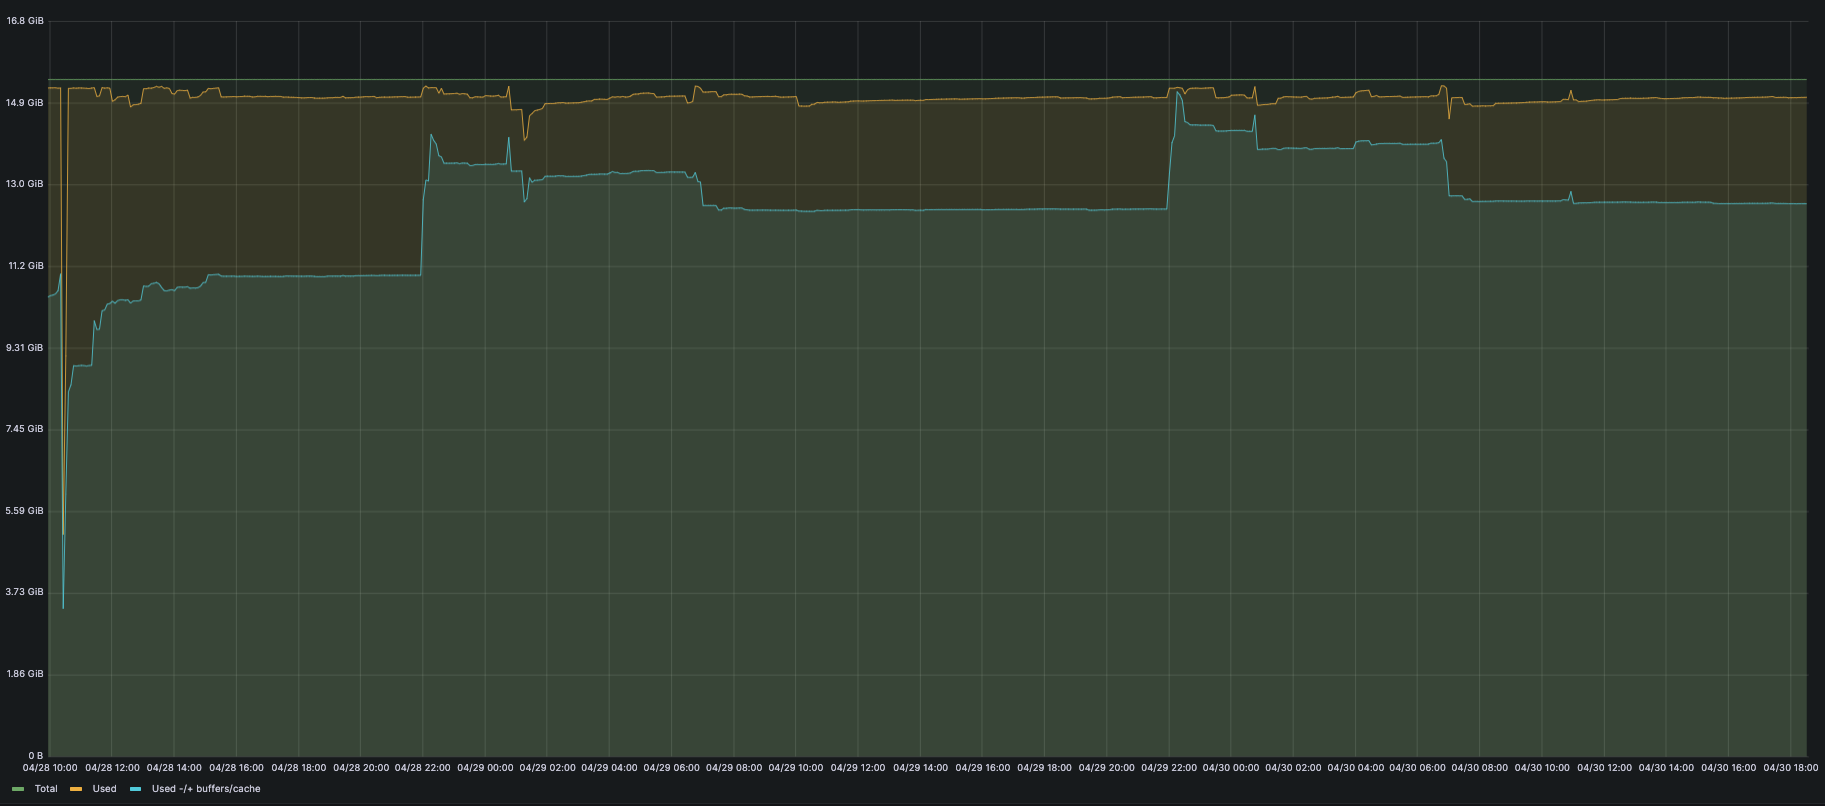
2) If mysqldump is executed, memory usage increases by 2.5/3+ GB (memory will never be completely released?!). In version 10.3 that increase was lower (max 2GB) but memory used to be released (it seems at the beginning of mysqldump execution). See images `memory_usage.*.png` (mysqldump start @22:00, stop @22:40)