Details
-
Bug
-
Status: Closed (View Workflow)
-
 Major
Major
-
Resolution: Incomplete
-
10.5.18, 10.5.19
-
debian 11
Description
Hello everyone,
I and my team spent a lot of time before posting this bug, and maybe it's not really a bug, but we can't figure out why our server has this behaviour.
We had 5 servers with debian 10 + mariaDB 10.3.38, everything was fine. We recently upgraded to debian 11 + mariaDB 10.5.18 and we started to have a high connect rate.
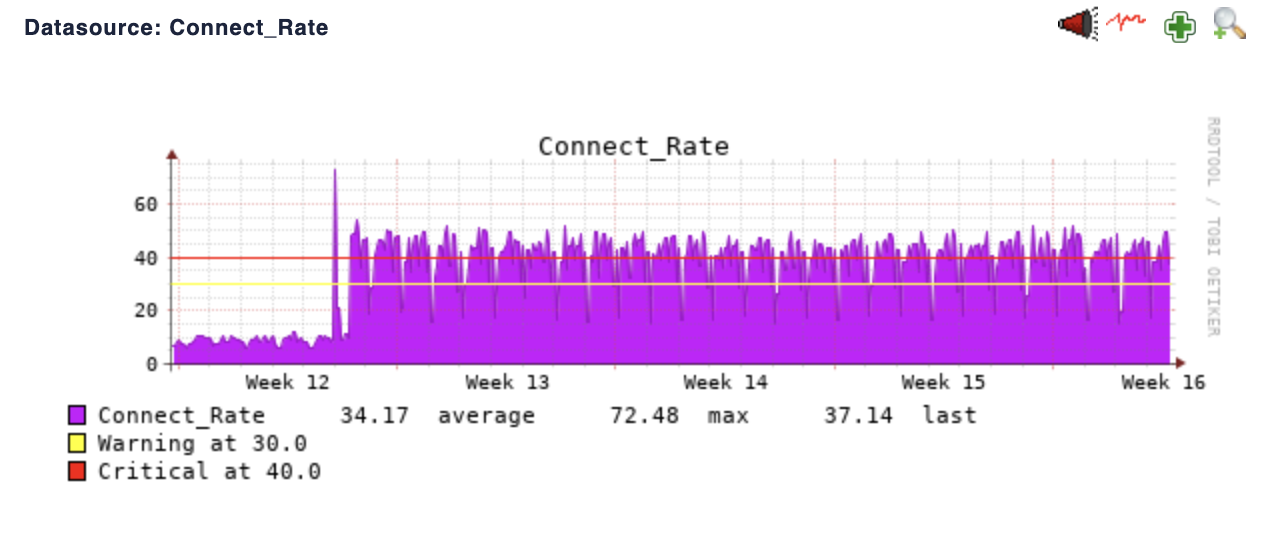
we upgraded on 23th march (week 12). We can see clearly on the chart below that connect_rate increased by about 4 times.
connect_rate is a probe from CheckMK monitoring, which reads Connections variable from SHOW GLOBAL STATUS.
When showing this variable every 10 seconds, counter increases a lot:
MariaDB [(none)]> show global status like 'Connections';
|
+---------------+----------+
|
| Variable_name | Value |
|
+---------------+----------+
|
| Connections | 33742168 |
|
+---------------+----------+
|
1 row in set (0,002 sec)
|
|
|
MariaDB [(none)]> show global status like 'Connections';
|
+---------------+----------+
|
| Variable_name | Value |
|
+---------------+----------+
|
| Connections | 33742651 |
|
+---------------+----------+
|
1 row in set (0,001 sec)
|
483 new connections in about 10 seconds.
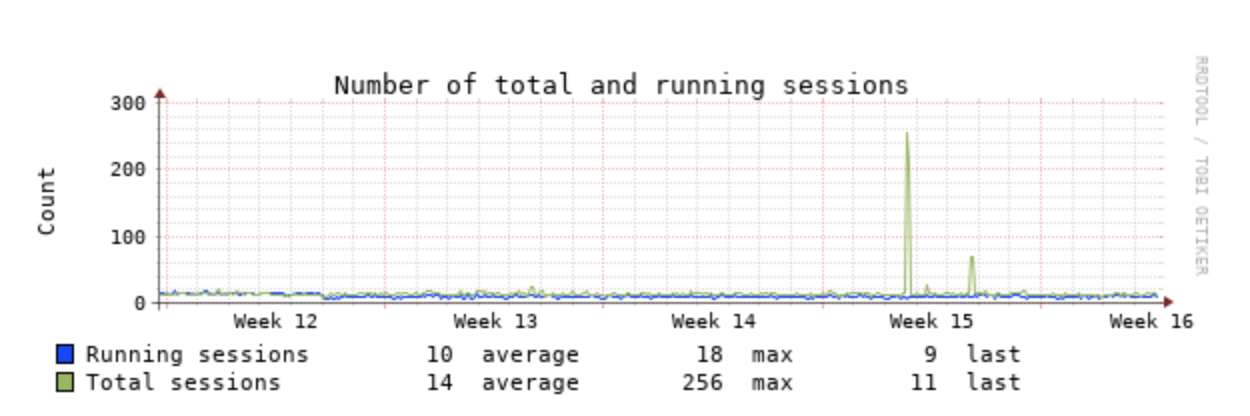
But when listing processlist, there aren't so many running sessions.
And our trafic hasn't increased neither.
All our servers are in ring replication, so all are master-master, and slave from previous one.
sql1 <=> sql2 <=> sql3 <=> sql4 <=> sql5 =>
So we tried with another slave connected to sql1, with only replication as client (no read from any application or other client): same problem.
sql1 <=> sql2 <=> sql3 <=> sql4 <=> sql5 =>
sql8
But when we stop replication (STOP SLAVE), new connections don't increase no more! I checked in the source code, "Connections" global status variable seems to be increased every new connection, and should have created a new thread.
We tried to enable audit plugin, but we can't see all intermediate connection_id.
We also tried to enable the general_log for a few minutes, we can see replication queries, with connection_id = the same in the processlist, but we can't find other one.
Connection rate increases when there are many queries in the replication.
So our main problems are:
- connect_rate that triggers our monitoring alerts
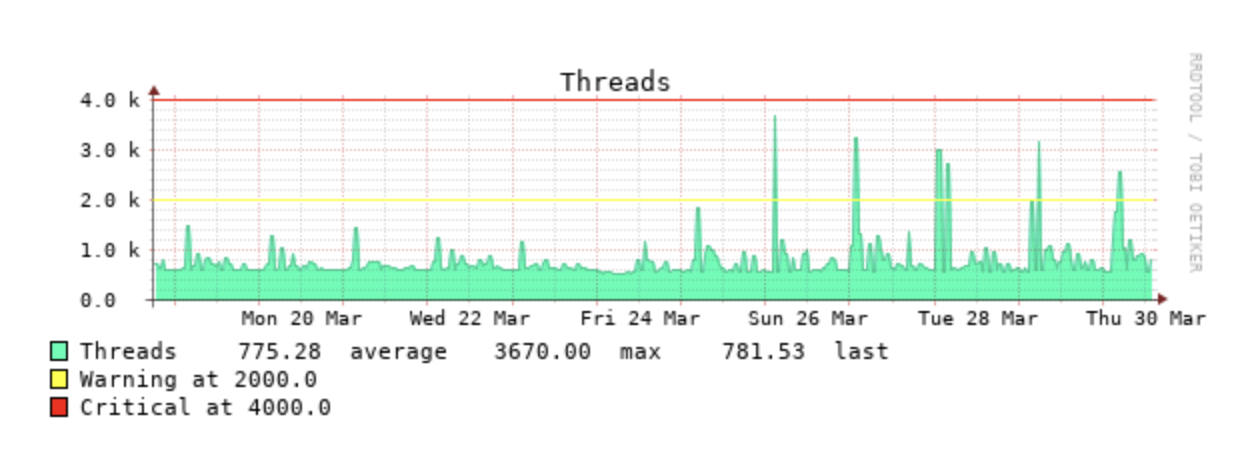
- the result is that performance has decreased a lot, because server seems to be on heavyload permanently, with some peaks when there are many queries replication.
We searched a lot on Internet, but we can't find any post or any bug in this tracker speaking about this behaviour.
What it seems to be weird, is that we can't find in the general_log nor in the audit log queries or connections with new IDs. All queries made by replication have the same connection_id. But when there are many queries, connection rate increases, which seems to be a link between the two.
I assume that queries replication shouldn't create new connections or increase Connections counter?
Binlog format from master sql1 is in MIXED format.
thread_handling one-thread-per-connection
Is this behaviour normal?
Thanks a lot!