Details
-
Bug
-
Status: Closed (View Workflow)
-
 Critical
-
Resolution: Incomplete
-
10.6.11, 10.6.12
Description
Summary
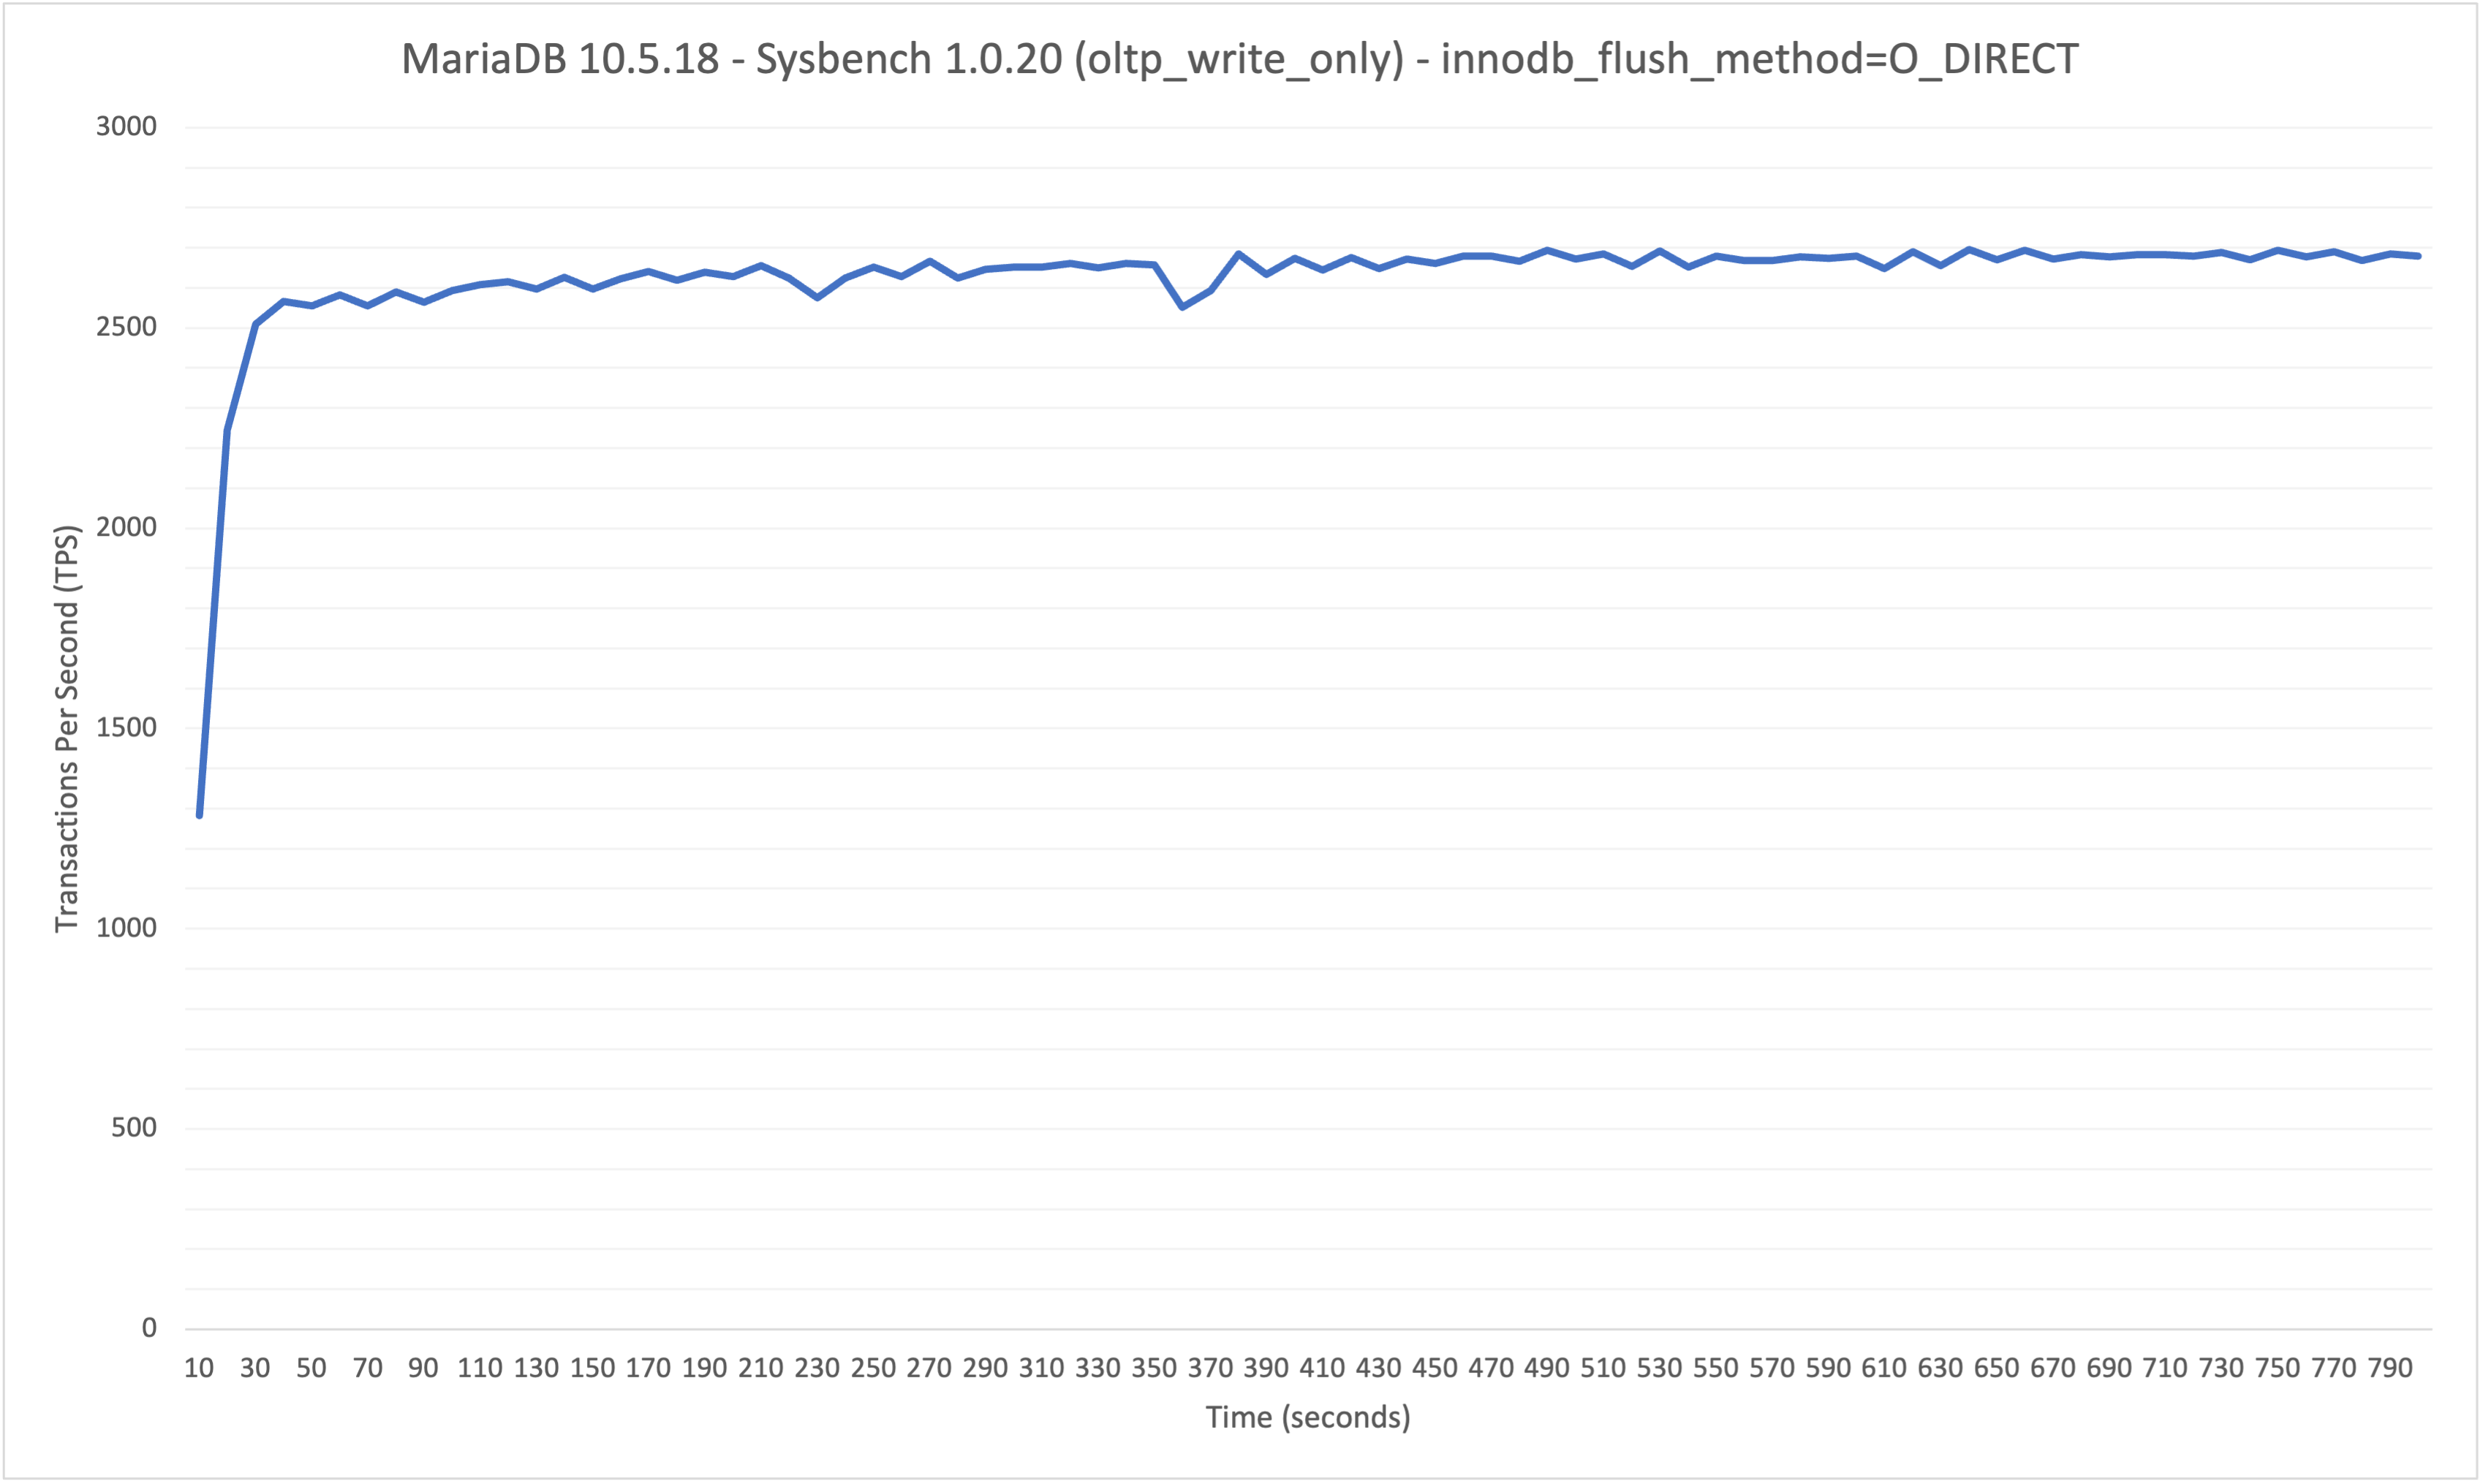
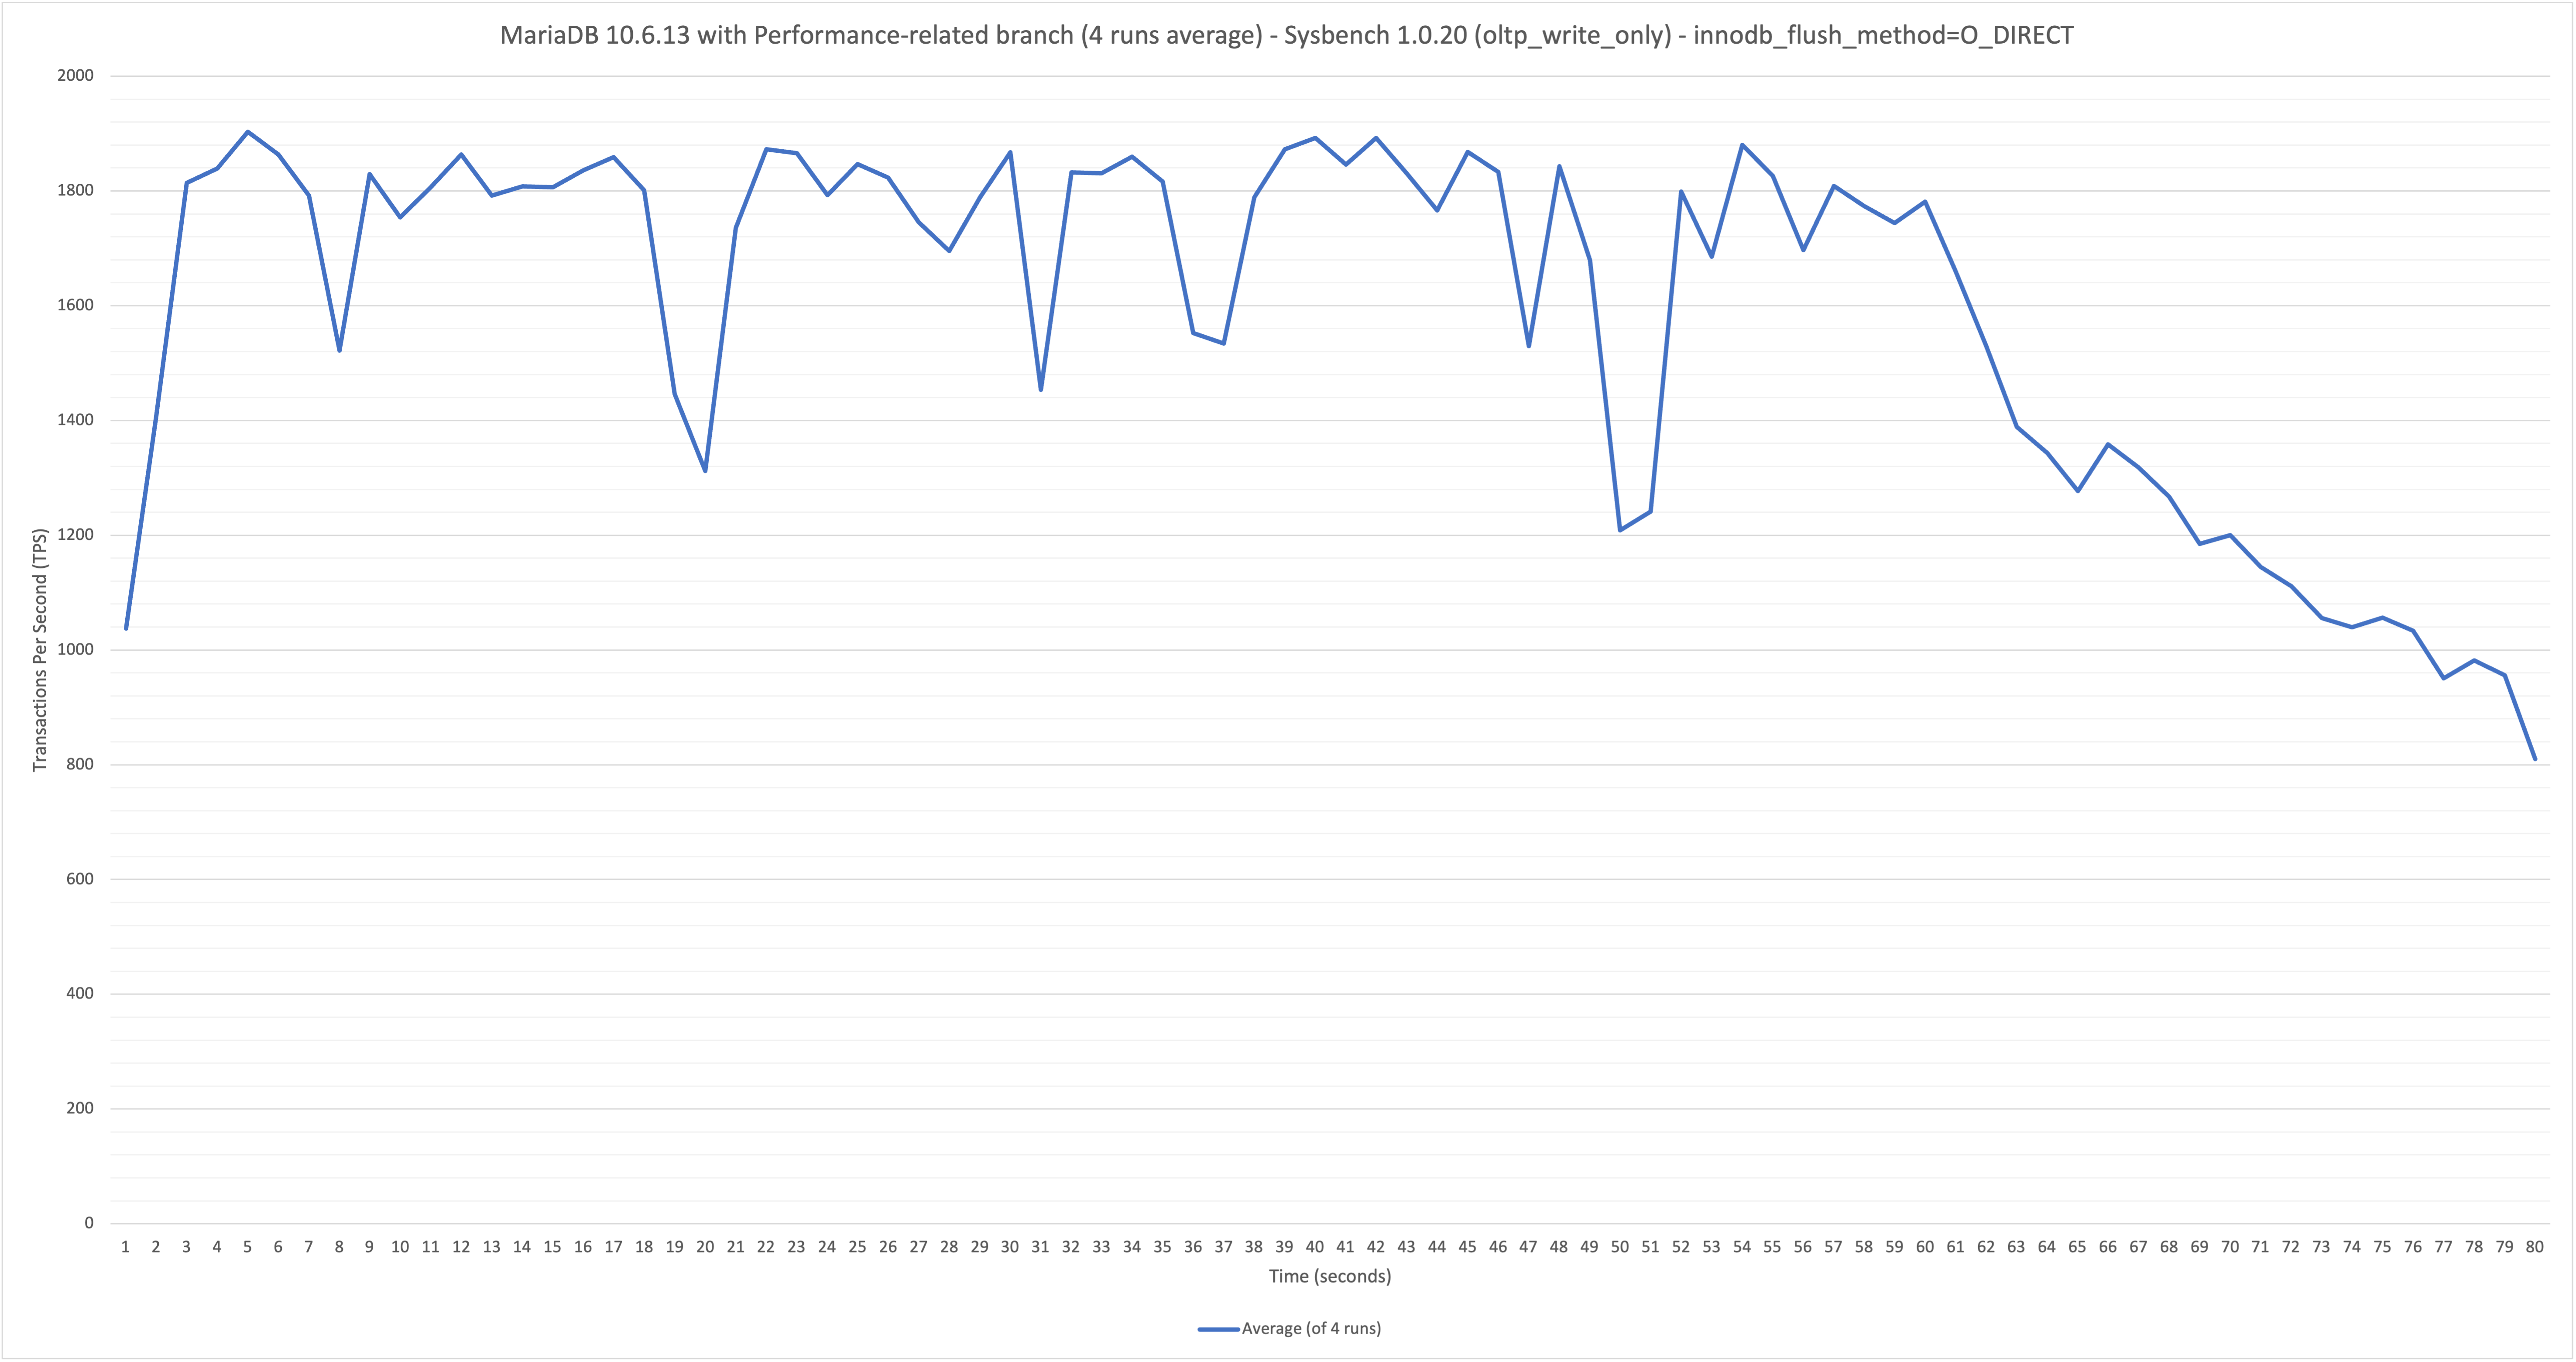
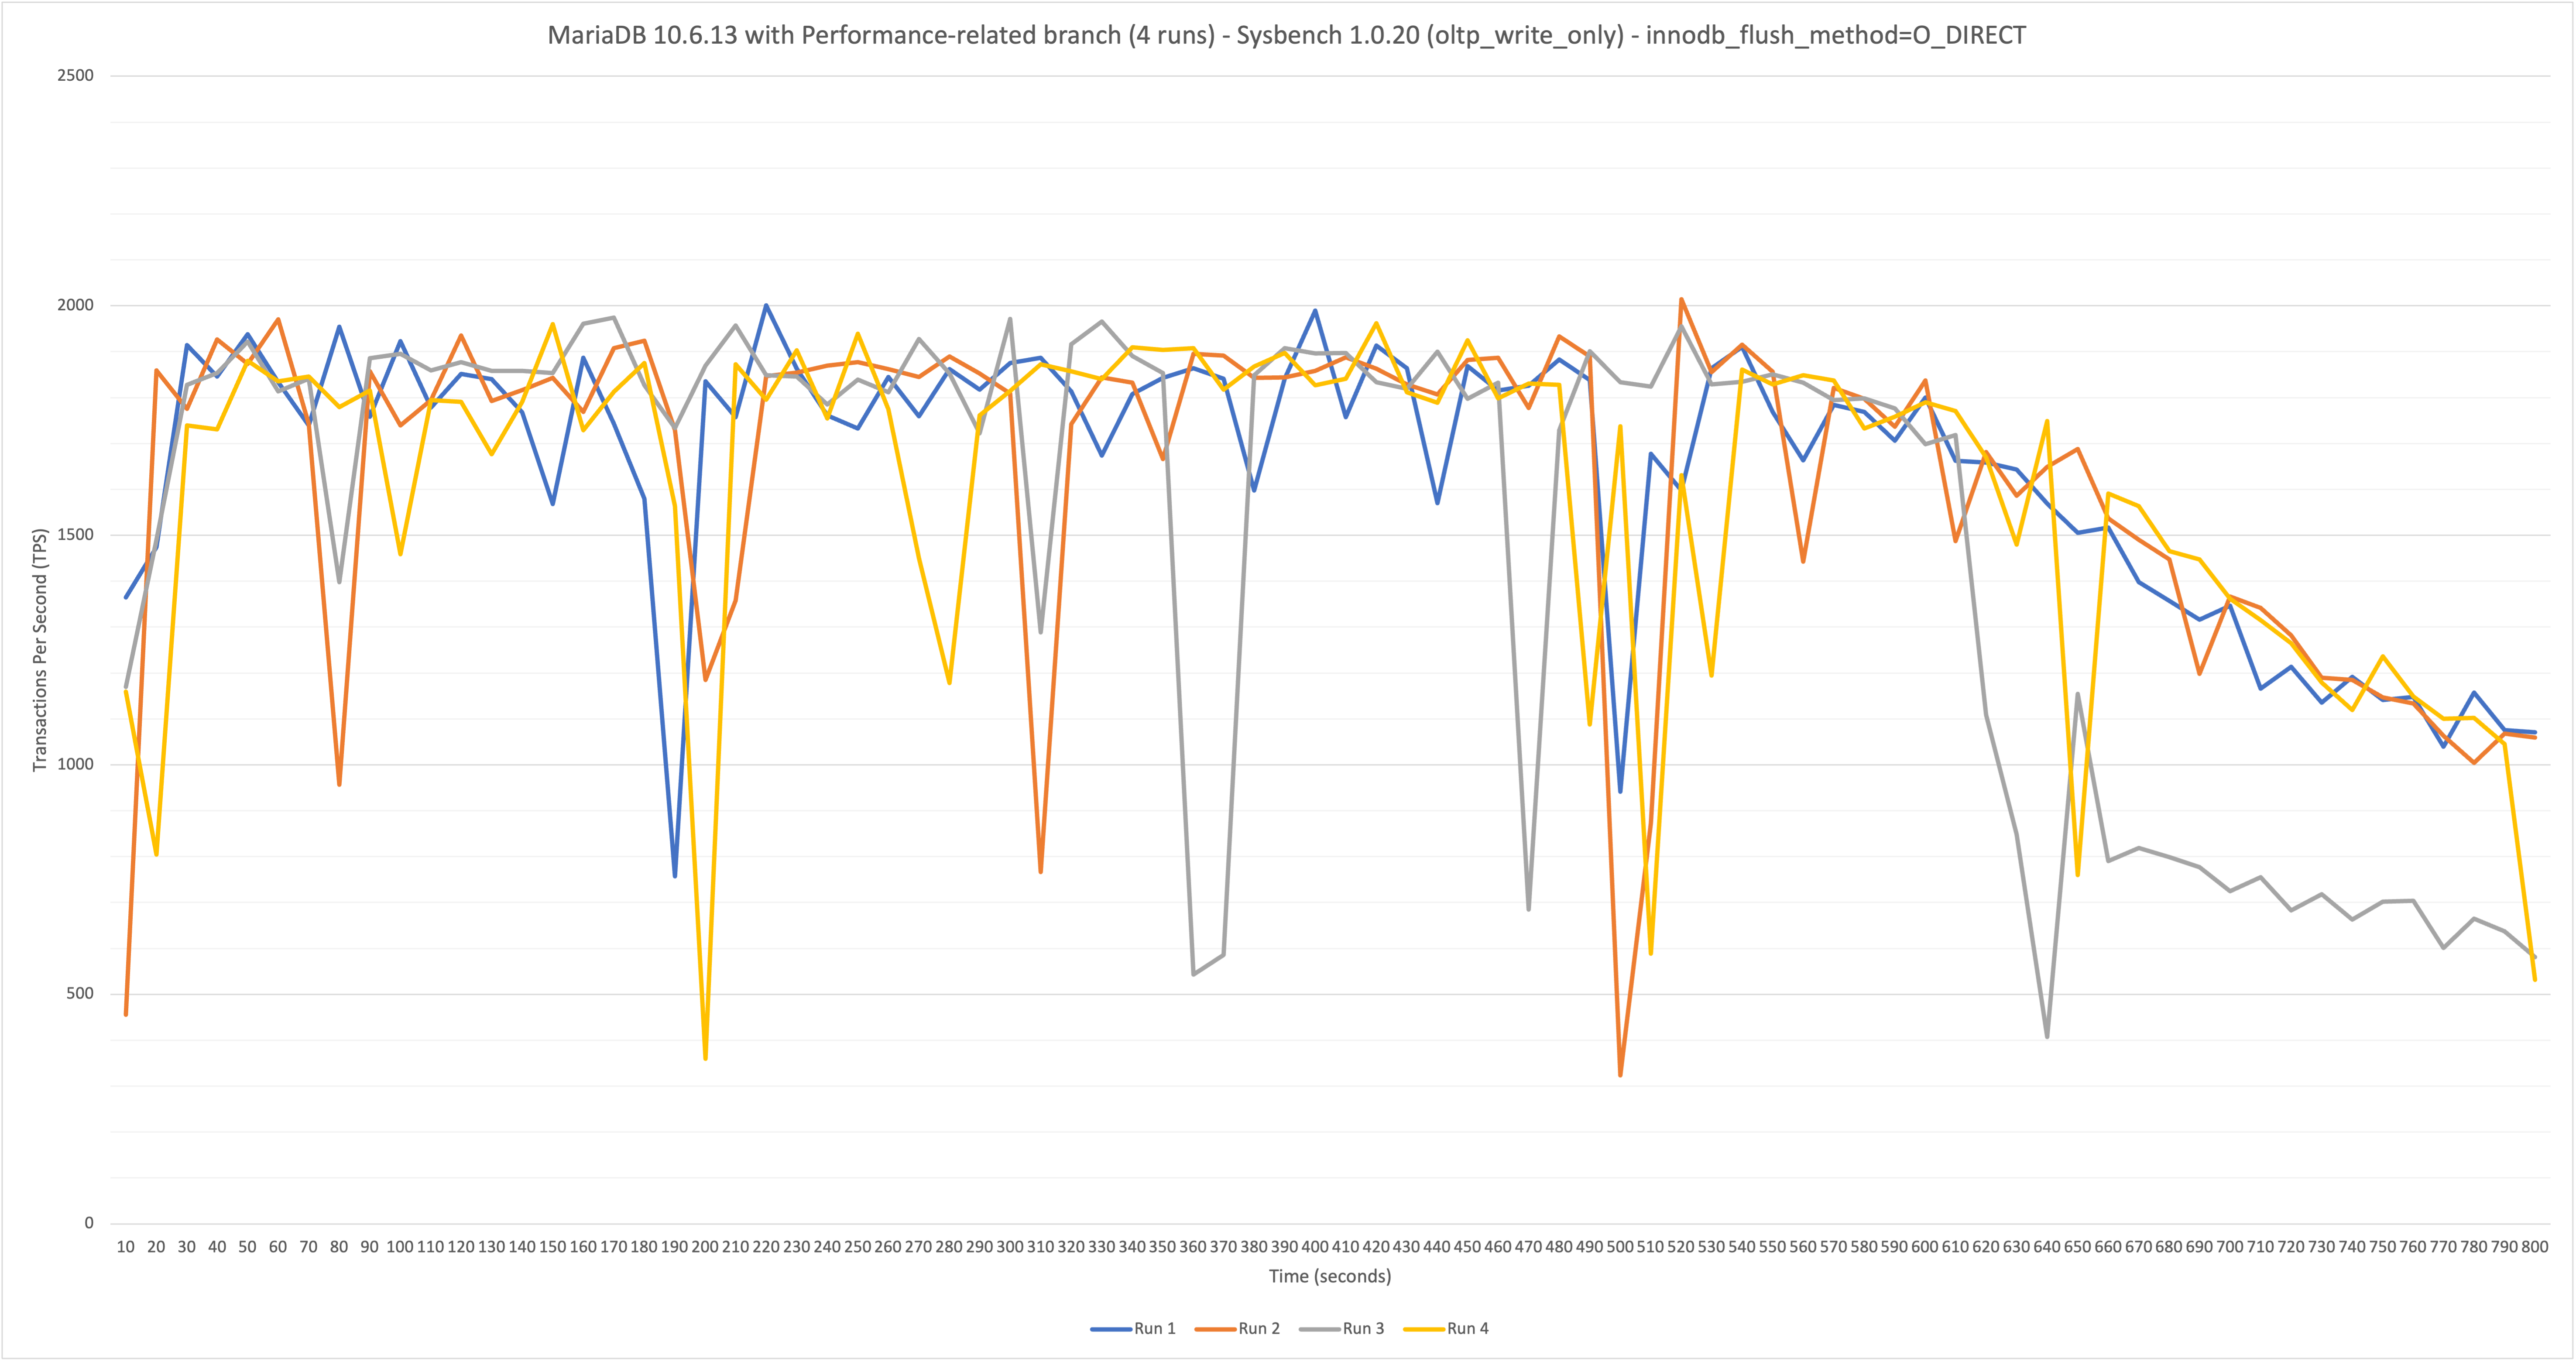
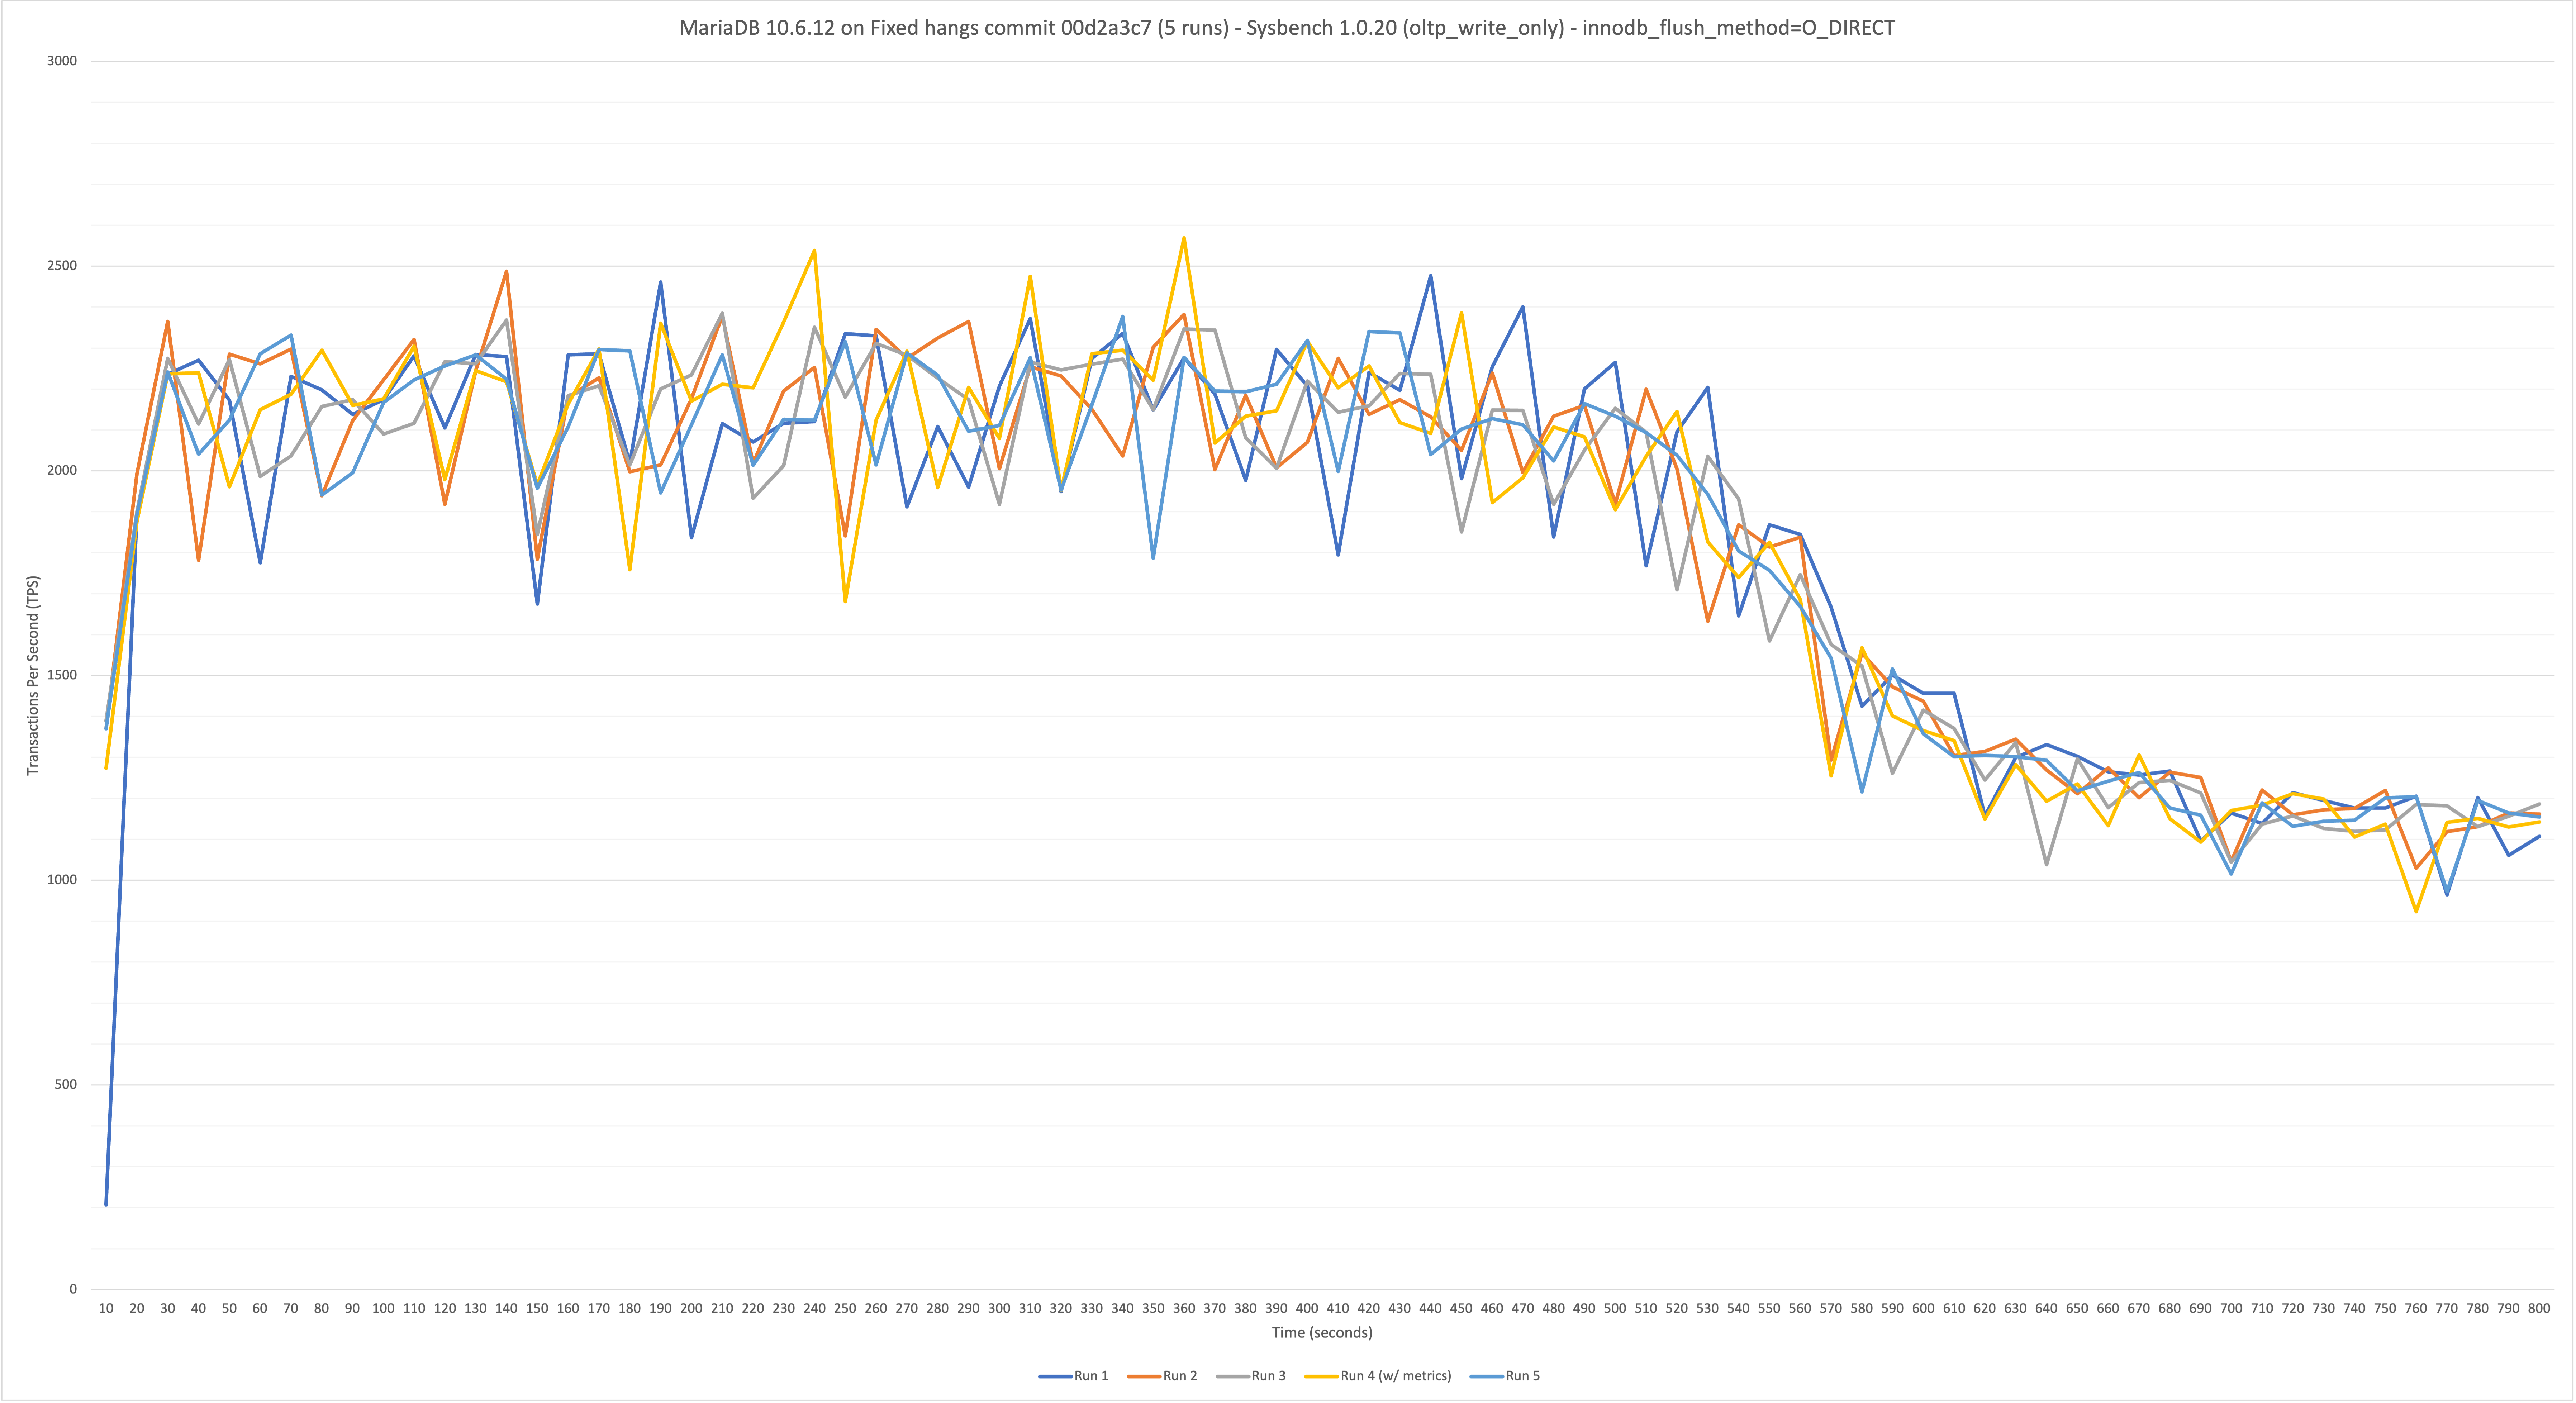
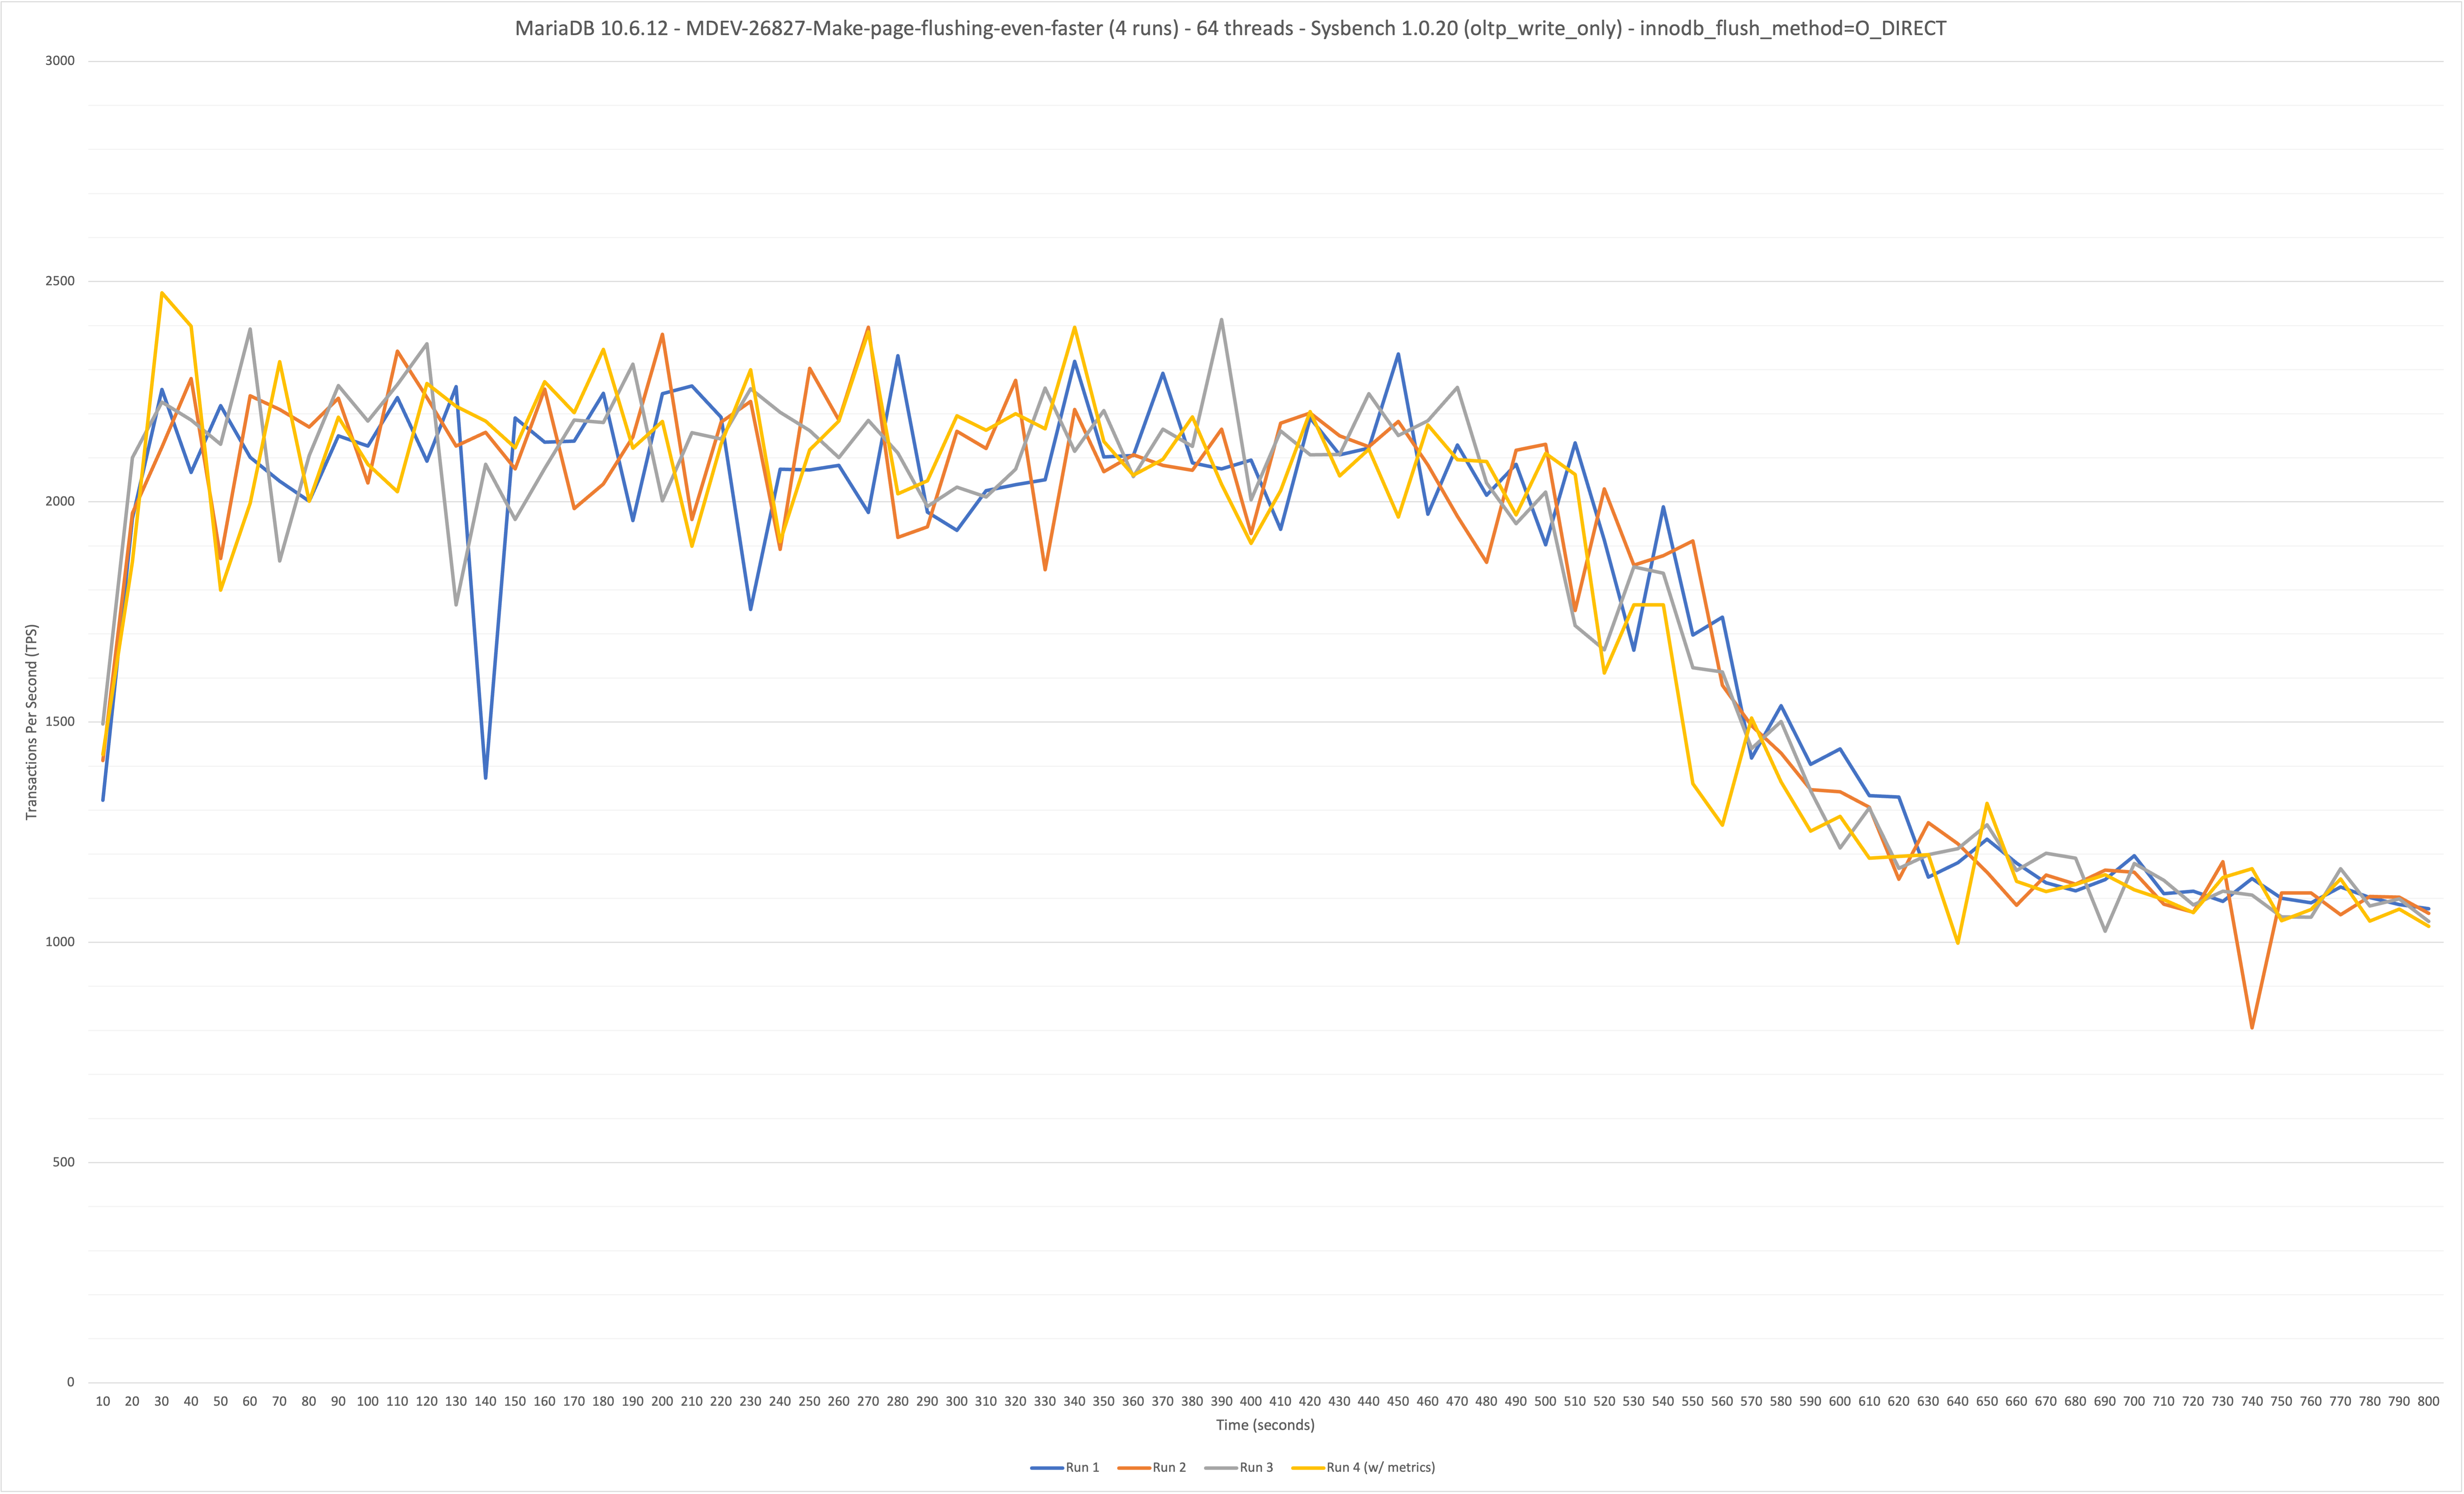
On MariaDB 10.6.12 (found in 10.6.11) at a sustained (800 second) OLTP write-only workload at 64 benchmark threads/connections (48 core / 96 thread hardware), the throughput starts high (~2200 TPS) and then gradually decreases starting from the 450 second mark until the end of the run (ends at ~980 TPS - 55.4% drop-off in performance). Performance is stable on MariaDB 10.5.18 (no regression), which averaged 2625 TPS over the 800s benchmark, with no drop-off in TPS. innodb_flush_method was set to O_DIRECT for both MariaDB 10.6 and 10.5 benchmarks.

Additional information
- TPS continues to decrease if more time is added to the benchmark:
- ~2350 TPS to ~500 TPS over a 1500s benchmark (79% drop-off in performance).
- CPUs utilized (measured by task-clock):
- MariaDB 10.6.12: 0.732 CPUs
- MariaDB 10.5.18: 1.490 CPUs
- Issue seems to happen when there are greater or equal connections than CPU cores; did not see the issue at 32 threads, but started seeing the issue at >=48 threads (on a 48 core / 96 thread CPU).
- Flamegraph results show CPU time spent on buf_page related functions, with buf_LRU_free_page blocking a lot of the on-CPU time.
- innodb_buffer_pool_wait_free metric increases over the entire duration of the run. At ~200s, the metric is at ~40,000, but at ~420s (where the regression happens) its at ~115,000. By the end of the run (800s) the metric is at ~300,000.
- Performance schema shows a lot of time spent in buf_pool_mutex.
Reproduce
- See the my.cnf file attached.
- Ran Sysbench 1.0.20, wrapped in mini-benchmark.sh, with the following modifications:
- oltp_write_only workload.
- 64 benchmark threads only.
- 800 second benchmark duration.
- Sysbench prepare:
sysbench oltp_write_only prepare --threads=16 --tables=20 --table-size=100000
- Sysbench run:
sysbench oltp_write_only run --threads=$t --time=800 --tables=20 --table_size=100000 --db-ps-mode=disable --simple_ranges=0 --order_ranges=0 --distinct_ranges=0 --sum_ranges=0 --report-interval=10
Other Details
- Ran the benchmarks on the following hardware (virtualized environment):
- m5.12xlarge AWS EC2 instance
- Intel Xeon Platinum 8175 processor @ 2.5 GHz (3.1 GHz turbo, 48 cores / 96 threads)
- 192 GB memory
- 500 GB SSD-based storage
- m5.12xlarge AWS EC2 instance
- Issue was reproduced on other instances and CPUs (Intel, ARM) at high threads/connections.
"Logs & Flamegraphs" Folder
The attached Logs & Flamegraphs.zip file contains the following:
- MariaDB 10.5 benchmark (1 run):
- Run 1: Same configuration as the "Reproduce" section
- MariaDB 10.6 benchmarks (3 runs):
- Run 1: Same configuration as the "Reproduce" section
- Run 2: Same configuration as Run 1, but with a flamegraph (perf record)
- Run 3: Same configuration as Run 1, but with a flamegraph of only the last 330 seconds of the run (approximately when the degradation occurs).
Each run has a photo graphing the TPS over time. The graphs for runs 1 of MariaDB 10.5.18 and 10.6.12 are also attached directly to this ticket.
Attachments


Issue Links
- includes
-
-
- Closed
-
- relates to
-
-

- Closed
-
-
-

- Closed
-
-
-
- Closed
-
-
-
- Closed
-
