Details
Description
We run rather large production servers with over hundreds of databases with varying sizes between a few MB and many GB.
Over the last few months we noticed an issue where MariaDB gets suddenly stuck in an 'too many connections' state without any clear cause.
The only way to resolve by killing MariaDB. When you try to restart MariaDB it also keeps hanging.
The problem keeps returning periodically mostly on our more busy production servers. On less busy servers the problem seems more rare or even not happening. In a test environments we are unable to reproduce the issue.
The chances of MariaDB getting stuck seems to be higher when you have multiple InnoDB databases above 1 GB who get hit often by queries. With InnoDB databases above ~ 10 GB the chance of crashes can happen seem to be multiple times per week.
Cleaning up or deleting larger databases from a server seems to lower the chance of MariaDB getting stuck.
In most cases not really helpful information is logged when MariaDB gets stuck:
2023-01-11 15:50:01 13718176 [Warning] Aborted connection 13718176 to db: 'unconnected' user: 'root' host: 'localhost' (Got an error reading communication packets) |
2023-01-11 15:51:01 13719057 [Warning] Aborted connection 13719057 to db: 'unconnected' user: 'root' host: 'localhost' (Got an error reading communication packets) |
2023-01-11 15:54:01 0 [Warning] Aborted connection 0 to db: 'unconnected' user: 'unauthenticated' host: 'connecting host' (Too many connections) |
2023-01-11 15:54:01 0 [Warning] Aborted connection 0 to db: 'unconnected' user: 'unauthenticated' host: 'connecting host' (Too many connections) |
2023-01-11 15:54:11 0 [Warning] Aborted connection 0 to db: 'unconnected' user: 'unauthenticated' host: 'connecting host' (Too many connections) |
2023-01-11 15:54:11 0 [Warning] Aborted connection 0 to db: 'unconnected' user: 'unauthenticated' host: 'connecting host' (Too many connections) |
2023-01-11 15:54:15 0 [Warning] Aborted connection 0 to db: 'unconnected' user: 'unauthenticated' host: 'connecting host' (Too many connections) |
2023-01-11 15:54:15 0 [Warning] Aborted connection 0 to db: 'unconnected' user: 'unauthenticated' host: 'connecting host' (Too many connections) |
2023-01-11 15:54:19 0 [Warning] Aborted connection 0 to db: 'unconnected' user: 'unauthenticated' host: 'connecting host' (Too many connections) |
etc...
|
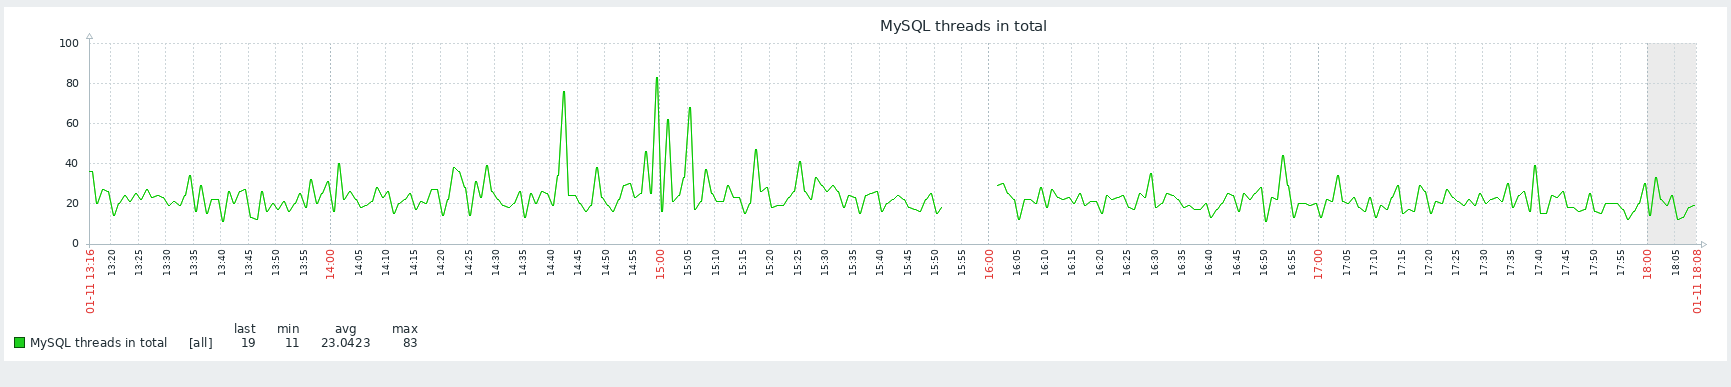
As shown in the attached image the number of connections before it are normal and after restart the connections are also normal. Also we don't see any different behaviour from websites or on the server running on our platform when MariaDB gets stuck.
Only once we got more data logged when we where still running 10.5.17:
2022-12-21 5:44:42 0 [Note] InnoDB: A semaphore wait: |
--Thread 140534735423232 has waited at dict0dict.cc line 1094 for 627.00 seconds the semaphore: |
Mutex at 0x557f23c2eb40, Mutex DICT_SYS created /builddir/build/BUILD/mariadb-10.5.17/storage/innobase/dict/dict0dict.cc:1038, lock var 2 |
|
|
2022-12-21 5:44:42 0 [Note] InnoDB: A semaphore wait: |
--Thread 140534943823616 has waited at ha_innodb.cc line 14379 for 630.00 seconds the semaphore: |
Mutex at 0x557f23c2eb40, Mutex DICT_SYS created /builddir/build/BUILD/mariadb-10.5.17/storage/innobase/dict/dict0dict.cc:1038, lock var 2 |
|
|
2022-12-21 5:44:42 0 [Note] InnoDB: A semaphore wait: |
--Thread 140532156942080 has waited at ha_innodb.cc line 14379 for 630.00 seconds the semaphore: |
Mutex at 0x557f23c2eb40, Mutex DICT_SYS created /builddir/build/BUILD/mariadb-10.5.17/storage/innobase/dict/dict0dict.cc:1038, lock var 2 |
|
|
2022-12-21 5:44:42 0 [Note] InnoDB: A semaphore wait: |
--Thread 140534680626944 has waited at ha_innodb.cc line 14379 for 625.00 seconds the semaphore: |
Mutex at 0x557f23c2eb40, Mutex DICT_SYS created /builddir/build/BUILD/mariadb-10.5.17/storage/innobase/dict/dict0dict.cc:1038, lock var 2 |
|
|
2022-12-21 5:44:42 0 [Note] InnoDB: A semaphore wait: |
--Thread 140534181000960 has waited at ha_innodb.cc line 14379 for 628.00 seconds the semaphore: |
Mutex at 0x557f23c2eb40, Mutex DICT_SYS created /builddir/build/BUILD/mariadb-10.5.17/storage/innobase/dict/dict0dict.cc:1038, lock var 2 |
|
|
InnoDB: Pending reads 0, writes 0 |
2022-12-21 5:44:42 0 [ERROR] [FATAL] InnoDB: Semaphore wait has lasted > 600 seconds. We intentionally crash the server because it appears to be hung. |
221221 5:44:42 [ERROR] mysqld got signal 6 ; |
This could be because you hit a bug. It is also possible that this binary |
or one of the libraries it was linked against is corrupt, improperly built,
|
or misconfigured. This error can also be caused by malfunctioning hardware.
|
|
|
To report this bug, see https://mariadb.com/kb/en/reporting-bugs |
|
|
We will try our best to scrape up some info that will hopefully help |
diagnose the problem, but since we have already crashed,
|
something is definitely wrong and this may fail. |
|
|
Server version: 10.5.17-MariaDB-cll-lve-log |
key_buffer_size=67108864 |
read_buffer_size=1048576 |
max_used_connections=501 |
max_threads=502 |
thread_count=498 |
It is possible that mysqld could use up to
|
key_buffer_size + (read_buffer_size + sort_buffer_size)*max_threads = 1106446 K bytes of memory |
Hope that's ok; if not, decrease some variables in the equation. |
|
|
Thread pointer: 0x0 |
Attempting backtrace. You can use the following information to find out
|
where mysqld died. If you see no messages after this, something went |
terribly wrong...
|
stack_bottom = 0x0 thread_stack 0x40000 |
2022-12-21 5:45:17 0 [Warning] You need to use --log-bin to make --binlog-format work. |
2022-12-21 5:45:17 0 [Note] mariadbd: Aria engine: starting recovery |
tables to flush: 2 1 0 |
(0.0 seconds); |
2022-12-21 5:45:17 0 [Note] mariadbd: Aria engine: recovery done |
2022-12-21 5:45:17 0 [Warning] The parameter innodb_file_format is deprecated and has no effect. It may be removed in future releases. See https://mariadb.com/kb/en/library/xtradbinnodb-file-format/ |
2022-12-21 5:45:17 0 [Note] InnoDB: Uses event mutexes |
--Thread 140534990231296 has waited at ha_innodb.cc line 14379 for 629.00 seconds the semaphore: |
Mutex at 0x557f23c2eb40, Mutex DICT_SYS created /builddir/build/BUILD/mariadb-10.5.17/storage/innobase/dict/dict0dict.cc:1038, lock var 2 |
|
|
2022-12-21 5:44:42 0 [Warning] InnoDB: A long semaphore wait: |
--Thread 140533752624896 has waited at ha_innodb.cc line 14379 for 629.00 seconds the semaphore: |
Mutex at 0x557f23c2eb40, Mutex DICT_SYS created /builddir/build/BUILD/mariadb-10.5.17/storage/innobase/dict/dict0dict.cc:1038, lock var 2 |
|
|
2022-12-21 5:44:42 0 [Warning] InnoDB: A long semaphore wait: |
--Thread 140534735423232 has waited at dict0dict.cc line 1094 for 627.00 seconds the semaphore: |
Mutex at 0x557f23c2eb40, Mutex DICT_SYS created /builddir/build/BUILD/mariadb-10.5.17/storage/innobase/dict/dict0dict.cc:1038, lock var 2 |
|
|
2022-12-21 5:44:42 0 [Warning] InnoDB: A long semaphore wait: |
--Thread 140534943823616 has waited at ha_innodb.cc line 14379 for 630.00 seconds the semaphore: |
Mutex at 0x557f23c2eb40, Mutex DICT_SYS created /builddir/build/BUILD/mariadb-10.5.17/storage/innobase/dict/dict0dict.cc:1038, lock var 2 |
|
|
2022-12-21 5:44:42 0 [Warning] InnoDB: A long semaphore wait: |
--Thread 140532156942080 has waited at ha_innodb.cc line 14379 for 630.00 seconds the semaphore: |
Mutex at 0x557f23c2eb40, Mutex DICT_SYS created /builddir/build/BUILD/mariadb-10.5.17/storage/innobase/dict/dict0dict.cc:1038, lock var 2 |
|
|
2022-12-21 5:44:42 0 [Warning] InnoDB: A long semaphore wait: |
--Thread 140534680626944 has waited at ha_innodb.cc line 14379 for 625.00 seconds the semaphore: |
Mutex at 0x557f23c2eb40, Mutex DICT_SYS created /builddir/build/BUILD/mariadb-10.5.17/storage/innobase/dict/dict0dict.cc:1038, lock var 2 |
|
|
2022-12-21 5:44:42 0 [Warning] InnoDB: A long semaphore wait: |
--Thread 140534181000960 has waited at ha_innodb.cc line 14379 for 628.00 seconds the semaphore: |
Mutex at 0x557f23c2eb40, Mutex DICT_SYS created /builddir/build/BUILD/mariadb-10.5.17/storage/innobase/dict/dict0dict.cc:1038, lock var 2 |
|
|
2022-12-21 5:44:42 0 [Note] InnoDB: A semaphore wait: |
--Thread 140534826923776 has waited at dict0dict.cc line 1094 for 627.00 seconds the semaphore: |
Mutex at 0x557f23c2eb40, Mutex DICT_SYS created /builddir/build/BUILD/mariadb-10.5.17/storage/innobase/dict/dict0dict.cc:1038, lock var 2 |
|
|
2022-12-21 5:44:42 0 [Note] InnoDB: A semaphore wait: |
--Thread 140534990231296 has waited at ha_innodb.cc line 14379 for 629.00 seconds the semaphore: |
Mutex at 0x557f23c2eb40, Mutex DICT_SYS created /builddir/build/BUILD/mariadb-10.5.17/storage/innobase/dict/dict0dict.cc:1038, lock var 2 |
|
|
2022-12-21 5:44:42 0 [Note] InnoDB: A semaphore wait: |
--Thread 140533752624896 has waited at ha_innodb.cc line 14379 for 629.00 seconds the semaphore: |
Mutex at 0x557f23c2eb40, Mutex DICT_SYS created /builddir/build/BUILD/mariadb-10.5.17/storage/innobase/dict/dict0dict.cc:1038, lock var 2 |
|
|
2022-12-21 5:44:42 0 [Note] InnoDB: A semaphore wait: |
--Thread 140534735423232 has waited at dict0dict.cc line 1094 for 627.00 seconds the semaphore: |
Mutex at 0x557f23c2eb40, Mutex DICT_SYS created /builddir/build/BUILD/mariadb-10.5.17/storage/innobase/dict/dict0dict.cc:1038, lock var 2 |
|
|
2022-12-21 5:44:42 0 [Note] InnoDB: A semaphore wait: |
--Thread 140534943823616 has waited at ha_innodb.cc line 14379 for 630.00 seconds the semaphore: |
Mutex at 0x557f23c2eb40, Mutex DICT_SYS created /builddir/build/BUILD/mariadb-10.5.17/storage/innobase/dict/dict0dict.cc:1038, lock var 2 |
|
|
2022-12-21 5:44:42 0 [Note] InnoDB: A semaphore wait: |
--Thread 140532156942080 has waited at ha_innodb.cc line 14379 for 630.00 seconds the semaphore: |
Mutex at 0x557f23c2eb40, Mutex DICT_SYS created /builddir/build/BUILD/mariadb-10.5.17/storage/innobase/dict/dict0dict.cc:1038, lock var 2 |
|
|
2022-12-21 5:44:42 0 [Note] InnoDB: A semaphore wait: |
--Thread 140534680626944 has waited at ha_innodb.cc line 14379 for 625.00 seconds the semaphore: |
Mutex at 0x557f23c2eb40, Mutex DICT_SYS created /builddir/build/BUILD/mariadb-10.5.17/storage/innobase/dict/dict0dict.cc:1038, lock var 2 |
|
|
2022-12-21 5:44:42 0 [Note] InnoDB: A semaphore wait: |
--Thread 140534181000960 has waited at ha_innodb.cc line 14379 for 628.00 seconds the semaphore: |
Mutex at 0x557f23c2eb40, Mutex DICT_SYS created /builddir/build/BUILD/mariadb-10.5.17/storage/innobase/dict/dict0dict.cc:1038, lock var 2 |
|
|
InnoDB: Pending reads 0, writes 0 |
2022-12-21 5:44:42 0 [ERROR] [FATAL] InnoDB: Semaphore wait has lasted > 600 seconds. We intentionally crash the server because it appears to be hung. |
221221 5:44:42 [ERROR] mysqld got signal 6 ; |
This could be because you hit a bug. It is also possible that this binary |
or one of the libraries it was linked against is corrupt, improperly built,
|
or misconfigured. This error can also be caused by malfunctioning hardware.
|
|
|
To report this bug, see https://mariadb.com/kb/en/reporting-bugs |
|
|
We will try our best to scrape up some info that will hopefully help |
diagnose the problem, but since we have already crashed,
|
something is definitely wrong and this may fail. |
|
|
Server version: 10.5.17-MariaDB-cll-lve-log |
key_buffer_size=67108864 |
read_buffer_size=1048576 |
max_used_connections=501 |
max_threads=502 |
thread_count=498 |
It is possible that mysqld could use up to
|
key_buffer_size + (read_buffer_size + sort_buffer_size)*max_threads = 1106446 K bytes of memory |
Hope that's ok; if not, decrease some variables in the equation. |
|
|
Thread pointer: 0x0 |
Attempting backtrace. You can use the following information to find out
|
where mysqld died. If you see no messages after this, something went |
terribly wrong...
|
stack_bottom = 0x0 thread_stack 0x40000 |
Config:
mysqld would have been started with the following arguments:
|
--basedir=/usr --bind-address=:: --binlog_checksum=NONE --binlog_format=STATEMENT --datadir=/var/lib/mysql --expire_logs_days=10 --ft_min_word_len=3 --innodb_buffer_pool_size=256M --innodb_checksum_algorithm=innodb --innodb_doublewrite=0 --innodb_file_format=barracuda --innodb_file_per_table=1 --innodb_large_prefix=ON --innodb_log_file_size=192M --innodb_strict_mode=false --innodb_use_native_aio=0 --join_buffer_size=1M --key_buffer_size=64M --local-infile=1 --log-error=/var/log/mysqld.log --log_warnings=2 --long_query_time=2 --max_allowed_packet=24M --max_binlog_size=100M --max_connections=500 --max_heap_table_size=20M --max_user_connections=100 --myisam_sort_buffer_size=32M --open_files_limit=51200 --pid-file=/var/run/mysqld/mysqld.pid --port=3306 --query_cache_size=32M --read_buffer_size=1M --read_rnd_buffer_size=1M --skip-external-locking --slow_query_log=1 --slow_query_log_file=/var/lib/mysql/slow_query.log --socket=/var/lib/mysql_sock/mysql.sock --sort_buffer_size=1M --sql_mode=NO_AUTO_CREATE_USER,NO_ENGINE_SUBSTITUTION --ssl --ssl-cert=/etc/pki/tls/certs/REDACTED.fullchain --ssl-key=/etc/pki/tls/private/REDACTED.mysql.key --ssl_cipher=TLSv1.2 --symbolic-links=0 --table_cache=2048 --table_definition_cache=2048 --thread_cache_size=8 --thread_stack=256K --tmp_table_size=10M --tmpdir=/var/lib/mysql_tmp --user=mysql --basedir=/usr --bind-address=:: --binlog_checksum=NONE --binlog_format=STATEMENT --datadir=/var/lib/mysql --expire_logs_days=10 --ft_min_word_len=3 --innodb_buffer_pool_size=2G --innodb_checksum_algorithm=full_crc32 --innodb_doublewrite=0 --innodb_file_format=barracuda --innodb_file_per_table=1 --innodb_large_prefix=ON --innodb_log_file_size=1G --innodb_strict_mode=false --innodb_use_native_aio=0 --join_buffer_size=1M --key_buffer_size=64M --local-infile=1 --log-error=/var/log/mariadb/mariadb.log --log_warnings=2 --long_query_time=2 --max_allowed_packet=24M --max_binlog_size=100M --max_connections=500 --max_heap_table_size=20M --max_user_connections=100 --myisam_sort_buffer_size=32M --open_files_limit=51200 --pid-file=/var/run/mariadb/mariadb.pid --port=3306 --query_cache_size=0M --read_buffer_size=1M --read_rnd_buffer_size=1M --skip-external-locking --slow_query_log=1 --slow_query_log_file=/var/lib/mysql/slow_query.log --socket=/var/lib/mysql_sock/mysql.sock --sort_buffer_size=1M --sql_mode=NO_AUTO_CREATE_USER,NO_ENGINE_SUBSTITUTION --ssl --ssl-cert=/etc/pki/tls/certs/REDACTED.fullchain --ssl-key=/etc/pki/tls/private/REDACTED.mysql.key --ssl_cipher=TLSv1.2 --symbolic-links=0 --table_definition_cache=4096 --table_open_cache=4096 --thread_cache_size=256 --thread_stack=256K --tmp_table_size=10M --tmpdir=/var/lib/mysql_tmp --user=mysql --wait_timeout=3600
|
Attachments
Issue Links
- relates to
-
MDEV-31293 Threads stuck on semaphore wait causing MariaDB to crash
-

- Closed
-
-
-

- Closed
-
-
-
- Closed
-
