Details
-
Bug
-
Status: Closed (View Workflow)
-
 Major
Major
-
Resolution: Cannot Reproduce
-
10.3.22, 10.2.32, 10.3.23, 10.4.13, 10.5.3
-
Discovered on Debian 10.3, replicated on Debian 9.12, Ubuntu 20.04, and CentOS 8.2. All systems are Digital Ocean droplets with 2 vCPU (2.3GHz), 2GB RAM, and SSD storage.
-
Related to performance
Description
I originally posted a question at https://dba.stackexchange.com/questions/269503/why-is-disk-io-higher-on-debian-10-mariadb-10-3-with-mysql-replication
But further investigation leads me to believe this is a regression in MariaDB, possibly with the InnoDB storage engine, but I'll try to repeat the important bits here.
Initially, I had 2 Debian 9.12 servers running MariaDB 10.1.44 in a parallel master-master replication setup. One is the primary, the other used as an automatic fail-over in our application. I was looking to replace them with new Debian 10 instances running MariaDB 10.3.22. Once I had the new 10.3.22 instance going, I was having some performance trouble, and in the process discovered roughly 6x higher write disk write activity on the new server (based on bytes, rather than # of writes).
I moved all production activity back to the 10.1.44 primary. Write activity on the 10.3.22 server dropped, but was still about 3x higher, with no noticeable change on the 10.1.44 primary. In fact, when you compare the 10.1.44 primary with its matching fail-over server, there is very little difference in write activity (both write/s and bytes/s).
I've gone through and compared every single setting that was different between MariaDB 10.1.44 and 10.3.22, and found nothing that impacted the disk IO in any way for our workload.
But for reference, here are the settings I've tried:
{{binlog_annotate_row_events = OFF
binlog_checksum = NONE
binlog_format = STATEMENT
innodb_flush_method = O_DSYNC
log_slow_admin_statements = OFF
log_slow_slave_statements = OFF
replicate_annotate_row_events = OFF
innodb_adaptive_hash_index_parts = 0/1/2
innodb_purge_threads = 1
innodb_spin_wait_delay = 6
innodb_strict_mode = OFF
innodb_use_atomic_writes = OFF
innodb_flush_sync = OFF
innodb_flush_neighbors = 0
innodb_io_capacity = 2000
innodb_use_native_aio = OFF
thread_cache_size = 8
thread_pool_max_threads = 1000
thread_stack = 196608}}
I also noticed 10.3.22 was using the Barracuda format, whereas 10.1.44 was using Antelope, so I moved the 10.1.44 primary server to Barracuda which did not have a negative impact. Note that I wasn't sure how to rebuild these tables, so they remain as Antelope: SYS_DATAFILES, SYS_FOREIGN, SYS_FOREIGN_COLS, SYS_TABLESPACES.
After all that, I wanted to rule out Debian 10 as the culprit, and I also tested various versions of MariaDB and even MySQL 8, so here are the combinations that I've tried:
optimize1 Debian 9.12 MariaDB 10.1.44 (master-master with db11)
optimize2 Debian 9.12 MariaDB 10.1.44 (slave from optimize1)
db11 Debian 10.3 MariaDB 10.3.22 (master-master with optimize1)
db12 Debian 10.3 MariaDB 10.3.22 (slave from db11)
db11293 Ubuntu 20.04 MariaDB 10.3.22 (slave from 10.1)
db11294 CentOS 8.2 MariaDB 10.4.13 (slave from 10.1)
db11295 Ubuntu 20.04 MySQL 8.0.20 (slave from 10.1)
db11296 Debian 9.12 MariaDB 10.1.44 (slave from 10.1)
db11296 Debian 9.12 MariaDB 10.2.32 (slave from 10.1)
db11296 Debian 9.12 MariaDB 10.3.23 (slave from 10.1)
db11296 Debian 9.12 MariaDB 10.4.13 (slave from 10.1)
db11296 Debian 9.12 MariaDB 10.5.3 (slave from 10.1)
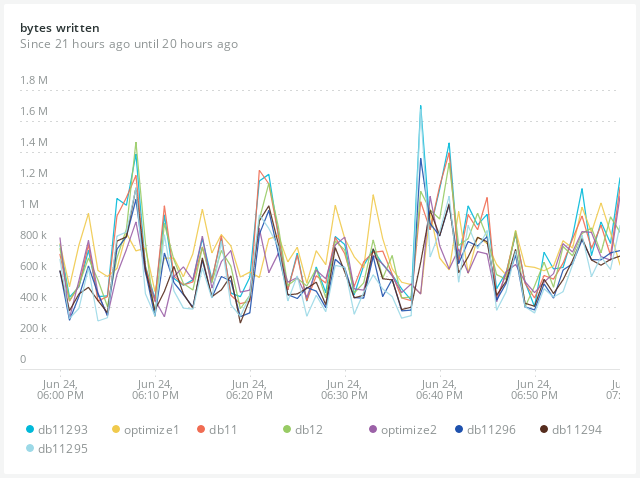
I included hostnames, so you can see them on these charts for comparison (which is live data):
https://chart-embed.service.newrelic.com/herald/368df819-2aaf-4e8a-ad8d-8c675550dd6f?height=400px&timepicker=true – writes per second
https://chart-embed.service.newrelic.com/herald/916ac5f9-e145-4ffd-9045-ad1a66e4f351?height=400px&timepicker=true – bytes written per second
https://chart-embed.service.newrelic.com/herald/ab5c6e16-86d8-417f-b50d-1b14275a6b66?height=400px&timepicker=true – bandwidth used
Note that db11296 is currently running 10.5.3, but I tested it on all those versions for at least an hour to compare it with the performance of the other active servers.
The CentOS 8.2 server performaed better than the Debian/Ubuntu servers due to using the XFS filesystem, but still much more write IO than the 10.1.44 servers.
MySQL 8 is sometimes "normal", but then bursts for brief periods to match the 10.2+ servers.
10.2 on Debian was the worst of the bunch, 10.5 was the best, matching the performance of the CentOS server running 10.4.
The workload on the db is nothing too crazy, 5-15 updates/second, lots of reads, and the occasional insert/delete. Some of the most common queries are these:
UPDATE clients SET licensed=licensed-1,last_optimized=NOW(),to_bill=0 WHERE id=436922 AND licensed>0
UPDATE client_usage_stats SET consumed=consumed+1 WHERE client_id=436922 AND year=2020 AND month=6
UPDATE clients SET consumed=consumed+1,last_optimized=NOW(),to_bill=0 WHERE id=436922
UPDATE api_keys SET consumed=consumed+1 WHERE sub_key='xyz123...'