Details
-
Bug
-
Status: Open (View Workflow)
-
 Minor
Minor
-
Resolution: Unresolved
-
None
-
None
-
None
-
None
Description
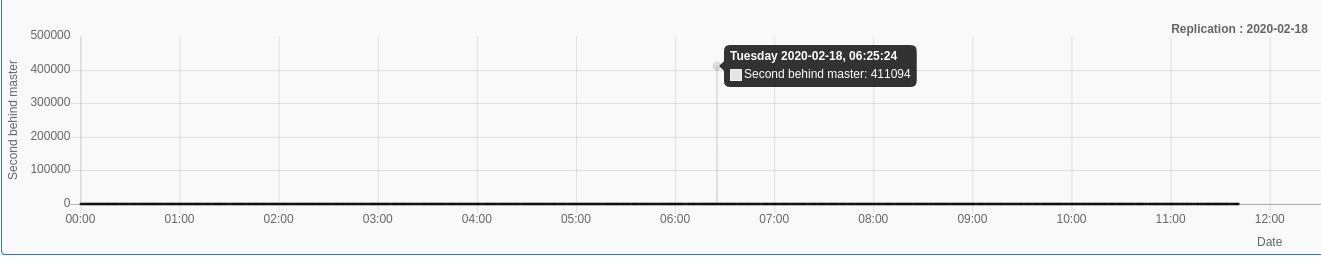
I monitor SHOW SLAVE STATUS each 5 seconds, and some time without any reason second behind master give me a crazy number :
MariaDB [pmacontrol]> select * from ts_value_slave_int where id_ts_variable = 815 and date= '2020-02-18 06:25:24' and id_mysql_server=33; |
+---------+-----------------+----------------+-----------------+---------------------+--------+
|
| id | id_mysql_server | id_ts_variable | connection_name | date | value |
|
+---------+-----------------+----------------+-----------------+---------------------+--------+
|
| 3823039 | 33 | 815 | | 2020-02-18 06:25:24 | 411094 | |
+---------+-----------------+----------------+-----------------+---------------------+--------+
|
The one (second behind master) before is 0 and the one after is 0 too.
here : 411094 , an other 423565 (on an other slave on same master).
it seem an even generate this problem, it's all time happen on the same Master/Slave (when it's happen)