Details
-
Bug
-
Status: Open (View Workflow)
-
 Minor
Minor
-
Resolution: Unresolved
-
10.2(EOL)
-
None
-
MariaDB 10.2.12 on RHEL 7.3
Description
I've noticed significant memory usage with the repeated use of COLUMN_GET() in a query.
The structure of the table is:
CREATE TABLE mystats ( |
id int(10) UNSIGNED NOT NULL, |
stats blob NOT NULL, |
PRIMARY KEY (id) |
)
|
ENGINE = INNODB,
|
CHARACTER SET utf8, |
COLLATE utf8_general_ci, |
ROW_FORMAT=DYNAMIC; |
This table is about 44GB (with 25 million rows). For each row, the blob contains on average about 120 dynamic columns (out of a set of 317 possible elements).
The datatype of these columns is primarily INT or DOUBLE.
The query tested performs limited select and selects a variable number columns from the stats blob.
The result set of this query is 209076 rows. The only difference between the queries in this test are the number of COLUMN_GET clauses used.
I recorded the memory usage of the same query using 3, 10, 30, 60, 100, 150, 200, 317 COLUMN_GET clauses in the SELECT statement.
I'm trying to understand why COLUMN_GET uses so much memory. The query with 3 COLUMN_GET clauses uses about 40MB of memory, but with 317 clauses memory usage balloons up to near 4.4GB.
Using COLUMN_JSON (replacing the COLUMN_GET clauses) doesn't seem to use any noticeable amount of memory running with the same query.
The form of the query is:
SELECT COLUMN_GET(stats, <stat> as DOUBLE), ... FROM mystats LIMIT 209076; |
(where <stat> is the stat name as a string).
I'm not sure if this is a bug or expected behavior, but it appears anomalous to me.
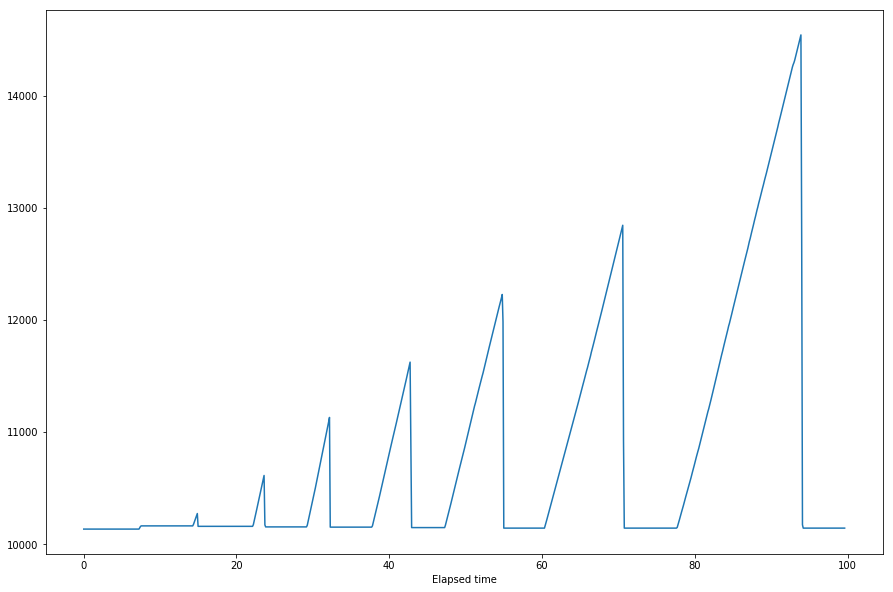
Attached is a quick plot of memory usage of the mysql process as these queries have been executed. The y-axis is Resident memory usage in MB.
The values at each local maxima are
Elapsed time
|
7.537 10162.422 (3 clauses)
|
14.871 10272.504 (10 clauses)
|
23.611 10611.875 (30 clauses)
|
32.176 11129.355 (60 clauses)
|
42.730 11622.684 (100 clauses)
|
54.795 12225.711 (150 clauses)
|
70.572 12843.094 (200 clauses)
|
93.901 14540.383 (317 clauses)
|
The idle periods average about 10148.24 MB