Details
-
Bug
-
Status: Closed (View Workflow)
-
 Critical
-
Resolution: Fixed
-
10.1.36, 10.2.17
-
Linux XXXXX 2.6.32-754.3.5.el6.x86_64 #1 SMP Tue Aug 14 20:46:41 UTC 2018 x86_64 x86_64 x86_64 GNU/Linux
mysql Ver 15.1 Distrib 10.2.17-MariaDB, for Linux (x86_64) using readline 5.1
$ rpm -qa | grep -i mariadb
MariaDB-shared-10.2.17-1.el6.x86_64
MariaDB-server-10.2.17-1.el6.x86_64
MariaDB-client-10.2.17-1.el6.x86_64
MariaDB-test-10.2.17-1.el6.x86_64
MariaDB-compat-10.2.17-1.el6.x86_64
MariaDB-common-10.2.17-1.el6.x86_64
MariaDB-devel-10.2.17-1.el6.x86_64
Linux XXXXX 2.6.32-754.3.5.el6.x86_64 #1 SMP Tue Aug 14 20:46:41 UTC 2018 x86_64 x86_64 x86_64 GNU/Linux mysql Ver 15.1 Distrib 10.2.17-MariaDB, for Linux (x86_64) using readline 5.1 $ rpm -qa | grep -i mariadb MariaDB-shared-10.2.17-1.el6.x86_64 MariaDB-server-10.2.17-1.el6.x86_64 MariaDB-client-10.2.17-1.el6.x86_64 MariaDB-test-10.2.17-1.el6.x86_64 MariaDB-compat-10.2.17-1.el6.x86_64 MariaDB-common-10.2.17-1.el6.x86_64 MariaDB-devel-10.2.17-1.el6.x86_64
Description
Experts,
After applying latest MariaDB patches on Replication master and Replication Slave, we are facing a strange issue.
Once per nearly 3 hours (random time) replication process at slave stopped with following errors
2018-09-04 6:33:28 140064771901184 [ERROR] Error reading packet from server: binlog truncated in the middle of event; consider out of disk space on master; the first event 'XXXXX-bin.000727' at 431628288, the last event read from 'XXXXX-bin.000728' at 399111340, the last byte read from 'XXXXX-bin.000728' at 399111359. (server_errno=1236)
2018-09-04 6:33:28 140064771901184 [ERROR] Slave I/O: Got fatal error 1236 from master when reading data from binary log: 'binlog truncated in the middle of event; consider out of disk space on master; the first event 'XXXXX-bin.000727' at 431628288, the last event read from 'XXXXX-bin.000728' at 399111340, the last byte read from 'XXXXX-bin.000728' at 399111359.', Internal MariaDB error code: 1236
This issue resolves when i submit command "stop slave; start slave;" .
This is something weird and strange because let's assume if problem persists on master replication server how it gone away by "stop slave; start slave;" simple command.
That make me uncomfortable and unconvinced.
thanks
Devang
Attachments

Issue Links
- blocks
-
-

- Open
-
Activity
Hello, Devang.
Could you share with us the master and slave server configuration?
Also what is the file system that the master configured to binlog on?
There was (maybe still is active) MDEV-14014 which looked as related to
NFS binlog configuration (on master).
Cheers,
Andrei
Hi Andrei,
This is from master :
#uname -a
Linux XXXXX 2.6.32-754.3.5.el6.x86_64 #1 SMP Tue Aug 14 20:46:41 UTC 2018 x86_64 x86_64 x86_64 GNU/Linux
File system is ext4
UUID=e13f8bb8-8b21-48b0-9e30-90dc95e6a6e8 / ext4 defaults 1 1
UUID=2c07a8f9-3f50-4c5c-ae41-fde3f6e6f9ae /boot ext4 defaults 1 2
UUID=69aad26b-de3b-42c4-bdad-5ad6252883fb /backup ext4 defaults 1 2
UUID=d3ad7f99-0efc-44c4-a9c3-39fb179c3460 /usr ext4 defaults 1 2
UUID=ead39aa9-3c87-48a3-871d-8104e19ce343 swap swap defaults 0 0
/dev/sda3 20G 16G 3.5G 82% /
tmpfs 16G 0 16G 0% /dev/shm
/dev/sda1 190M 39M 141M 22% /boot
/dev/sda6 242G 169G 61G 74% /backup
/dev/sda2 145G 91G 47G 66% /usr
my.cnf
datadir=/usr/sumdata/
expire_logs_days=3
cat /etc/exports
/usr/local/backups 10.10.10.0/24(rw,no_root_squash,async)
/usr/local/backups 10.20.20.0/24(rw,no_root_squash,async)
This is from slave:
- uname -a
Linux XXXXX 2.6.32-754.3.5.el6.x86_64 #1 SMP Tue Aug 14 20:46:41 UTC 2018 x86_64 x86_64 x86_64 GNU/Linux
- df -kh
Filesystem Size Used Avail Use% Mounted on
/dev/sda8 9.5G 1.5G 7.9G 16% /
tmpfs 7.8G 72K 7.8G 1% /dev/shm
/dev/sda2 193G 64G 119G 35% /backup1
/dev/sda11 295G 251G 30G 90% /data2
/dev/sda1 969M 42M 877M 5% /boot
/dev/sda3 193G 70G 113G 39% /data
/dev/sda6 20G 991M 18G 6% /home
/dev/sda10 4.7G 26M 4.5G 1% /opt
/dev/sda5 145G 19G 118G 14% /usr
/dev/sda7 15G 358M 14G 3% /var
#/etc/fstab
UUID=b6742119-e835-4c5e-bd6f-0292734bd0da / ext4 defaults 1 1
UUID=5771d6e8-7fe8-4315-add9-a5c7c840d6a8 /backup1 ext4 defaults 1 2
UUID=1d76a6e1-0530-499c-b71a-419dfa78c218 /data2 ext4 defaults 1 2
UUID=704a768e-f21b-4914-995e-2e22cd0bcfee /boot ext4 defaults 1 2
UUID=73c9f178-0e63-4414-b212-33b754741c28 /data ext4 defaults 1 2
UUID=7d4d60a3-4ed2-40b8-aa1c-088fc9d917a3 /home ext4 defaults 1 2
UUID=8162dac5-cf24-437e-965a-84ad689e1137 /opt ext4 defaults 1 2
UUID=ebb023d0-7bd1-4936-abe4-13ca17a19bfe /usr ext4 defaults 1 2
UUID=56470912-f17d-4b38-a1e7-13fdaa635b9e /var ext4 defaults 1 2
UUID=1e9525a2-f060-43af-95ed-ab5004793638 swap swap defaults 0 0
- cat /etc/exports
/backup1 10.10.10.0/24(rw,no_root_squash,async)
/usr/local/backups 10.10.10.0/24(rw,no_root_squash,async)
/usr/local/backups 10.20.20.0/24(rw,no_root_squash,async)
#cat /etc/my.cnf
datadir=/data
innodb_data_file_path=ibdata:2G:autoextend
-
- On master and slave BIN-Log are being stored in same "datadir"
I m not agree with you assumption related with "NFS BinLog" because it never been configured.
Please share if you need anything on this.
thanks
Devang
Thanks for the info. It certainly rules out the potential (never assumed ![]() ) relevance to NFS.
) relevance to NFS.
Let me ask you to describe the failure details answering to the following questions.
How easy is this reproducible, or what is the error approximate rate ?
How many slaves your master runs simultaneously?
What is a typical load on the master in number of connections and transaction per sec if you can estimate?
Also could you attach the master and slave error logs for searching for more details.
Thank you.
How easy is this reproducible, or what is the error approximate rate ?
Yes, in my environment error is coming once per 3 to 4 hours not fixes since i applied patch means more than 2 weeks.
How easy is this reproducible, or what is the error approximate rate ?
I m not sure how to reproduce this error that is why i contacted you otherwise i would share that details too.
Rate as i mentioned above once per 3 or 4 hours (not fixed) SLAVE PROCESS stops with this error.
When i manually gives stop slave; start slave command it starts smoothly from the same master pointer till next error took place.
What is a typical load on the master in number of connections and transaction per sec if you can estimate?
Master has moderate load "On master bin file size set to 1 GB and bin file rotates in average 2 to 3 days"
this may help you to understand transaction rate.
Please fill free to share anything on this.
thanks
Devang
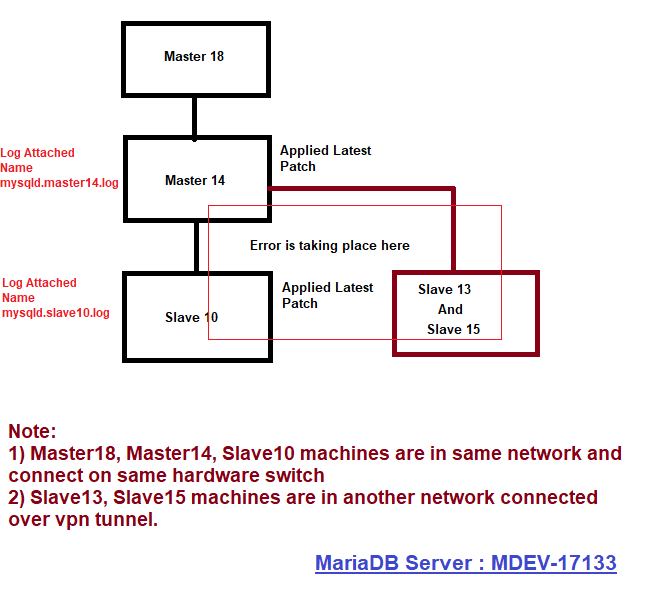
Please find log from MASTER replication server.
MASTER replication is doing partial replication from another MASTER replication.
Naming convention
This master = MASTER14
Master of MASTER14 = SLAVE18
SLAVE of MASTER14 = SLAVE10
Issue is noted between MASTER14 and SLAVE10 after applying patch.
Patch is not applied to SLAVE18 .
In summary this is three tier replication.
For better understanding of layout i have attached a diagram with this.
If you still need something please feel free to tell me.
thanks
Devang
mysqld-master14.log![]() mysqld-slave10.log
mysqld-slave10.log![]()
Thanks again.
Please find 2 questions in the following.
So I learned that there are 3 slaves connected the master.
I can't find from the master (14) error log whether they were connected to it (maybe --log-warnings is set to non-default 1, but again in my.cnf that you provided there is no custom setting to log_warnings) as #10 that saw the truncate error.
Could you please clarify (those slaves' error log must be telling), I am still trying to find out how many slaves your master runs simultaneously.
2018-09-01 5:38:44 140064772204288 [ERROR] Slave I/O: Got fatal error 1236 from master when reading data from binary log: 'binlog truncated in the middle of event; consider out of disk space on master; the first event 'MASTER14-bin.000710' at 52417, the last event read from 'MASTER14-bin.000712' at 1033405612, the last byte read from 'MASTER14-bin.000712' at 1033405631.', Internal MariaDB error code: 1236
2018-09-01 5:38:44 140064772204288 [Note] Slave I/O thread exiting, read up to log 'MASTER14-bin.000712', position 1033420800
So the last event read from 'MASTER14-bin.000712' at 1033405612. This means there are no more work for the applier thread with greater than the stopped position.
But the event applier SQL thread stopped later at a position greater than that:
2018-09-02 3:18:14 140064771901184 [Note] Slave SQL thread exiting, replication stopped in log 'MASTER14-bin.000712' at position 1033420800
1033405612 < 1033420800: do you have any idea how that would be possible, assuming the error log was not edited so no
records of the IO thread reconnecting is missing?
MariaDB [(none)]> show processlist;
----------------------------------------------------------------------------------------------------------------------------------------------------------------------------------------------------------------------------------------------------
| Id | User | Host | db | Command | Time | State | Info | Progress |
----------------------------------------------------------------------------------------------------------------------------------------------------------------------------------------------------------------------------------------------------
| 840571 | system user | NULL | Slave_IO | 448489 | Waiting for master to send event | NULL | 0.000 | |
| 840572 | system user | NULL | Slave_SQL | 1 | Slave has read all relay log; waiting for the slave I/O thread to update it | NULL | 0.000 | |
| 1437618 | XXXXX | 10.20.20.14:40782 | NULL | Binlog Dump | 42814 | Master has sent all binlog to slave; waiting for binlog to be updated | NULL | 0.000 |
| 1491926 | XXXXX | 10.20.20.11:47386 | NULL | Binlog Dump | 8610 | Master has sent all binlog to slave; waiting for binlog to be updated | NULL | 0.000 |
| 1505021 | XXXXX | 10.10.10.20:44786 | NULL | Binlog Dump | 89 | Writing to net | NULL | 0.000 |
----------------------------------------------------------------------------------------------------------------------------------------------------------------------------------------------------------------------------------------------------
Could you please clarify (those slaves' error log must be telling), I am still trying to find out how many slaves your master runs simultaneously.
There are 3 slaves connected to MASTER14, SLAVE10, SLAVE15, SLAVE13.
Sometimes if SLAVE FREEZE because of error need to wait till cron job issue command stop slave, start slave.
Cron job runs once per 5 minutes on every SLAVE machine.
You can also see entry of 3 SLAVES in SHOW PROCESSLIST at MASTER14.
One slave, SLAVE15 was down since 685983 i have just started so it is possible you can not see in log.
Respective IPs are
10.20.20.14 SLAVE13
10.20.20.11 SLAVE10
10.10.10.20 SLAVE15
2018-09-02 3:18:14 140064771901184 [Note] Slave SQL thread exiting, replication stopped in log 'MASTER14-bin.000712' at position 1033420800
1033405612 < 1033420800: do you have any idea how that would be possible, assuming the error log was not edited so no
records of the IO thread reconnecting is missing?
This is all puzzle for me too.
thanks
Devang
Above everything honestly speaking same set up was working fine before applying patch.
Without any such error.
Devang
Let me step back to
>>What is a typical load on the master+ in number of connections +and transaction per sec if you can estimate?
>Master has moderate load "On master bin file size set to 1 GB and bin file rotates in average 2 to 3 days"
>this may help you to understand transaction rate.
Sorry, the # of connection estimate is critical and can't be easily (if at all) learned from binlog. Maybe you have some
observations, please try to answer that.
As to 1GB data in 2 days - good to know, but again could you please find the 1st and the last GTID event in a binlog so we could know
the rate in trx per time unit which could help us to operate further.
To
>This is all puzzle for me too
Please make sure --log-warnings is at least 2 on master and the slaves.
I think we can be missing some data in the error log that would show up. E.g the fact that
a slave connected indeed is present with
2018-09-12 15:44:59 140558863075072 [Note] Start binlog_dump to slave_server(2), pos(master-bin.000001, 329)
and your master error log does not have any such record.
And to
>After applying latest MariaDB patches
what patches exactly do you mean?
To how come 1033405612 < 1033420800 actually I missed the 2nd of the 3 relevant records. Now I quote them all:
2018-09-01 5:38:44 140064772204288 [ERROR] Slave I/O: Got fatal error 1236 from master when reading data from binary log: 'binlog truncated in the middle of event; consider out of disk space on master; the first event 'MASTER14-bin.000710' at 52417, the last event read from 'MASTER14-bin.000712' at 1033405612, the last byte read from 'MASTER14-bin.000712' at 1033405631.', Internal MariaDB error code: 1236
2018-09-01 5:38:44 140064772204288 [Note] Slave I/O thread exiting, read up to log 'MASTER14-bin.000712', position 1033420800
2018-09-02 3:18:14 140064771901184 [Note] Slave SQL thread exiting, replication stopped in log 'MASTER14-bin.000712' at position 1033420800
As the 2nd line goes despite the error the IO thread managed to have read [1033405612 .. 1033420800] byte range.
I am checking the sources for how this could be possible.
Anyway, if you still have the 712th binlog, could you please paste output of
mysqbinlog --start-position=1033405612 --stop-position=1033420800
|
Wow !!
Something interesting
*
# mysqlbinlog --start-position=1033405612 --stop-position=1033420800 /usr/sumdata/XXXX14-bin.000712 > 712.sql
ERROR: Error in Log_event::read_log_event(): 'Found invalid event in binary log', data_len: 3145728, event_type: 0
ERROR: Could not read entry at offset 1033405612: Error in log format or read error.
*
Please share any further inputs?
thanks
Devang
Just to double-check that /usr/sumdata/XXXX14-bin.000712 is the master's binlog, I hope it is.
Could you hexdump it starting from 1033405612 for some 1KB?
Also do that in opposite direction that is 1KB before?
PFA attached 712.sql
mysqlbinlog --start-position=1033405612 --hexdump=TRUE /usr/sumdata/XXXXX-bin.000712 > 712.sql
Devang,
I got concerned with integrity of your slave error log.
For instance the following contiguous sequence of records
2018-09-02 3:18:14 140064771901184 [Note] Slave SQL thread exiting, replication stopped in log 'MASTER14-bin.000712' at position 1033420800
2018-09-02 3:18:17 140064771901184 [Note] Slave I/O thread: connected to master 'ruser@10.20.20.13:3306',replication started in log 'MASTER14-bin.000712' at position 1033420800
2018-09-02 11:30:07 140064771901184 [ERROR] Error reading packet from server: binlog truncated in the middle of event; consider out of disk space on master; the first event 'MASTER14-bin.000712' at 1033420800, the last event read from 'MASTER14-bin.000719' at 948122796, the last byte read from 'MASTER14-bin.000719' at 948122815. (server_errno=1236)
2018-09-02 11:30:07 140064771901184 [ERROR] Slave I/O: Got fatal error 1236 from master when reading data from binary log: 'binlog truncated in the middle of event; consider out of disk space on master; the first event 'MASTER14-bin.000712' at 1033420800, the last event read from 'MASTER14-bin.000719' at 948122796, the last byte read from 'MASTER14-bin.000719' at 948122815.', Internal MariaDB error code: 1236
2018-09-02 11:30:07 140064771901184 [Note] Slave I/O thread exiting, read up to log 'MASTER14-bin.000719', position 948137984
2018-09-02 22:10:35 140064772204288 [Note] Slave SQL thread exiting, replication stopped in log 'MASTER14-bin.000719' at position 948137984
infers the SQL thread was somewhere started in between of two exits.
And the log shies out to tell. Strange.
Let us restart from a clean sheet.
I already asked you to raise the log_warnings to 2. Then we wait of a first error recurrence and you send me once again the two logs, mysqlbinlog hexdump (dd) output,
also show global variables and show global status on either side, query log (if you have) which I will process as promptly as I can.
Sorry to remind, but you still owe me to answer
how many concurrent connections is run on master (precision of 10 is fine), and
what patches on what base you applied (are your server versions identical to some stable Github branches - 10.2.x ?) ?
Please clear this out.
Thank you for your contribution so far!
Andrei
But let's finish off 712.sql matter anyway.
mysqlbinlog seems is incapable to hexdump our range if event is corrupted (probably).
The file only shows an event
with offset 4 instead of what was requested by --start-offset.
Could you use dd or something to extract the ranges (1kB before and after) that I asked. You can combine into
one, and please report a command with parameters.
Thanks.
Dear Andrei,
Sorry for delay because i m from India it was too late reference to your last input.
Please find herewith data that you asked for.
I have update log_warnings=2 run-time on MASTER, while on SLAVE is restarted service.
On your question how i m applying patch to MariaDB , answer is i have setup repo and on that bases i m doing it manually as and when patch release to repo.
I am using command "yum update"
- cat /etc/yum.repos.d/mariadb-10-2.repo
- MariaDB 10.2 CentOS repository list - created 2017-10-25 16:00 UTC
- http://downloads.mariadb.org/mariadb/repositories/
[mariadb]
name = MariaDB
baseurl = http://yum.mariadb.org/10.2/centos6-amd64
gpgkey=https://yum.mariadb.org/RPM-GPG-KEY-MariaDB
gpgcheck=1
>>how many concurrent connections is run on master (precision of 10 is fine), and
Please see attached PROCESS list output.
On MASTER, all connections are mostly made from local server itself from one program only.
Occasionally, read only connections are made from another server.
I think we are very near to the issue and it is mostly related with MASTER Replication , not SLAVE so now on wards we need to focus only on MASTER, Correct ?
thanks
Devang SLAVE10-Variables.txt![]() SLAVE10-Status.txt
SLAVE10-Status.txt![]() MASTER14-Status.txt
MASTER14-Status.txt![]() MASTER14-Variables.txt
MASTER14-Variables.txt![]() MASTER14-Log.txt
MASTER14-Log.txt![]() MASTER14-Processes.txt
MASTER14-Processes.txt![]()
Hello, Devang.
Yes, it's the master side definitely. Thanks for setting log_warnings=2, I hope you meant to say
on slaves is also done.
Now I understand what you meant saying 'patches'. So you must be having 10.2.17 by an rpm package.
You said that this issue followed your upgrade ... from what version actually (which we may suspect as healthy)?
Sorry to remind you again, even before we have gotten another error recurrence, could you please
send me a hexdump for the binlog fragment.
I suggest you run 'dd' utility for that. I hope it's an easy exercise.
After reading through the global var:s setting I see you have
master_verify_checksum OFF
|
Could you please turn it ON?
Hi
- grep -i mariadb yum.log
Mar 10 23:13:50 Installed: MariaDB-common-10.2.13-1.el6.x86_64
Mar 10 23:13:51 Installed: MariaDB-compat-10.2.13-1.el6.x86_64
Mar 10 23:14:00 Installed: MariaDB-client-10.2.13-1.el6.x86_64
Mar 10 23:14:52 Installed: MariaDB-server-10.2.13-1.el6.x86_64
Mar 10 23:14:52 Installed: MariaDB-shared-10.2.13-1.el6.x86_64
Mar 10 23:14:54 Installed: MariaDB-devel-10.2.13-1.el6.x86_64
Mar 10 23:15:23 Installed: MariaDB-test-10.2.13-1.el6.x86_64
May 18 21:06:20 Updated: MariaDB-compat-10.2.15-1.el6.x86_64
May 18 21:06:20 Updated: MariaDB-common-10.2.15-1.el6.x86_64
May 18 21:06:34 Updated: MariaDB-client-10.2.15-1.el6.x86_64
May 18 21:07:51 Updated: MariaDB-server-10.2.15-1.el6.x86_64
May 18 21:07:53 Updated: MariaDB-devel-10.2.15-1.el6.x86_64
May 18 21:08:24 Updated: MariaDB-test-10.2.15-1.el6.x86_64
May 18 21:08:24 Updated: MariaDB-shared-10.2.15-1.el6.x86_64
Aug 03 21:06:08 Updated: MariaDB-common-10.2.16-1.el6.x86_64
Aug 03 21:06:09 Updated: MariaDB-compat-10.2.16-1.el6.x86_64
Aug 03 21:06:44 Updated: MariaDB-client-10.2.16-1.el6.x86_64
Aug 03 21:08:53 Updated: MariaDB-server-10.2.16-1.el6.x86_64
Aug 03 21:08:55 Updated: MariaDB-shared-10.2.16-1.el6.x86_64
Aug 03 21:09:26 Updated: MariaDB-test-10.2.16-1.el6.x86_64
Aug 03 21:09:29 Updated: MariaDB-devel-10.2.16-1.el6.x86_64
Aug 31 20:56:56 Updated: MariaDB-compat-10.2.17-1.el6.x86_64
Aug 31 20:56:56 Updated: MariaDB-common-10.2.17-1.el6.x86_64
Aug 31 20:57:07 Updated: MariaDB-client-10.2.17-1.el6.x86_64
Aug 31 20:58:13 Updated: MariaDB-server-10.2.17-1.el6.x86_64
Aug 31 20:58:45 Updated: MariaDB-test-10.2.17-1.el6.x86_64
Aug 31 20:58:48 Updated: MariaDB-devel-10.2.17-1.el6.x86_64
Aug 31 20:58:48 Updated: MariaDB-shared-10.2.17-1.el6.x86_64
This will give you more confidence .
Can you please suggest exact DD command ?
I m not sure about exact syntax
Meanwhile i have enable "master_verify_checksum" on MASTER14 run-time.
thanks
Devang
> Can you please suggest exact DD command ?
E.g this
dd bs=1 skip=$[1033405612 - 1] count=19 < MASTER14-bin.000712 > MASTER14-bin.000712.1033405612 .19_bytes.dump
will puts out 19 bytes of the last being unsuccessfully read event. The binlog from the master!
Again you did not reply to
> You said that this issue followed your upgrade ... from what version actually
Please do.
Thank you.
Hi Andrei
PFA said file
And i have yum log for mariadb since installed i guess you missed it
grep -i mariadb yum.log
Mar 10 23:13:50 Installed: MariaDB-common-10.2.13-1.el6.x86_64
Mar 10 23:13:51 Installed: MariaDB-compat-10.2.13-1.el6.x86_64
Mar 10 23:14:00 Installed: MariaDB-client-10.2.13-1.el6.x86_64
Mar 10 23:14:52 Installed: MariaDB-server-10.2.13-1.el6.x86_64
Mar 10 23:14:52 Installed: MariaDB-shared-10.2.13-1.el6.x86_64
Mar 10 23:14:54 Installed: MariaDB-devel-10.2.13-1.el6.x86_64
Mar 10 23:15:23 Installed: MariaDB-test-10.2.13-1.el6.x86_64
May 18 21:06:20 Updated: MariaDB-compat-10.2.15-1.el6.x86_64
May 18 21:06:20 Updated: MariaDB-common-10.2.15-1.el6.x86_64
May 18 21:06:34 Updated: MariaDB-client-10.2.15-1.el6.x86_64
May 18 21:07:51 Updated: MariaDB-server-10.2.15-1.el6.x86_64
May 18 21:07:53 Updated: MariaDB-devel-10.2.15-1.el6.x86_64
May 18 21:08:24 Updated: MariaDB-test-10.2.15-1.el6.x86_64
May 18 21:08:24 Updated: MariaDB-shared-10.2.15-1.el6.x86_64
Aug 03 21:06:08 Updated: MariaDB-common-10.2.16-1.el6.x86_64
Aug 03 21:06:09 Updated: MariaDB-compat-10.2.16-1.el6.x86_64
Aug 03 21:06:44 Updated: MariaDB-client-10.2.16-1.el6.x86_64
Aug 03 21:08:53 Updated: MariaDB-server-10.2.16-1.el6.x86_64
Aug 03 21:08:55 Updated: MariaDB-shared-10.2.16-1.el6.x86_64
Aug 03 21:09:26 Updated: MariaDB-test-10.2.16-1.el6.x86_64
Aug 03 21:09:29 Updated: MariaDB-devel-10.2.16-1.el6.x86_64
Aug 31 20:56:56 Updated: MariaDB-compat-10.2.17-1.el6.x86_64
Aug 31 20:56:56 Updated: MariaDB-common-10.2.17-1.el6.x86_64
Aug 31 20:57:07 Updated: MariaDB-client-10.2.17-1.el6.x86_64
Aug 31 20:58:13 Updated: MariaDB-server-10.2.17-1.el6.x86_64
Aug 31 20:58:45 Updated: MariaDB-test-10.2.17-1.el6.x86_64
Aug 31 20:58:48 Updated: MariaDB-devel-10.2.17-1.el6.x86_64
Aug 31 20:58:48 Updated: MariaDB-shared-10.2.17-1.el6.x86_64
MASTER14-bin.000712.1033405612.19_bytes.dump![]()
thanks
Devang
I got the answer. Thanks for spelling it out (never was familiar with yum log).
The dump shows the event's header is corrupted. There's nothing to struggle for having the current data.
Let's resume when it come back with error logs hopefully saying much more.
Andrei,
No worries i will share error log tomorrow my morning without forget hopefully it may have something for us.
thanks
Devang
Andrei,
It is not a good news still issue persists.
Please find here with attached 2 logs files showing same.
SLAVE10.log - 2018-09-13 10:56:21
But against this error i can not see any suspicious message in MASTER14.log.
For you notes, time on both servers are 100% sync means if something happens on SLAVE10 at 10.56.21 and we are suspecting something to log at MASTER14 , NO it was not there.
Now, you are the only hope on this.
Also, can you please suggest any best way to check DATA INTEGRITY BETWEEN MASTER14 AND SLAVE10, my guess it would LOST because of this issue. What you say on this ?
worrying more
thanks
Devang MASTER14.log![]() SLAVE10.log
SLAVE10.log![]()
Devang, thanks for more verbose data!
The first error recurrence is actually at
2018-09-13 0:54:47 139720503559936 [ERROR] Slave I/O: Got fatal error 1236 from master when reading data from binary log: 'binlog truncated in the middle of event; consider out of disk space on master; the first event 'XXXXX14-bin.000761' at 180213418, the last event read from 'XXXXX14-bin.000761' at 566564012, the last byte read from 'XXXXX14-bin.000761' at 566564031.', Internal MariaDB error code: 1236
2018-09-13 0:54:47 139720503559936 [Note] Slave I/O thread exiting, read up to log 'XXXXX14-bin.000761', position 566579200
2018-09-13 0:55:01 139720503256832 [Note] Error reading relay log event: slave SQL thread was killed
2018-09-13 0:55:01 139720503256832 [Note] Slave SQL thread exiting, replication stopped in log 'XXXXX14-bin.000761' at position 566579200
2018-09-13 0:55:01 139720503559936 [Note] Slave I/O thread: connected to master 'repluser@10.20.20.13:3306',replication started in log 'XXXXX14-bin.000761' at position 566579200
2018-09-13 0:55:01 139720502953728 [Note] Slave SQL thread initialized, starting replication in log 'XXXXX14-bin.000761' at position 566579200, relay log './XXXXX10-relay-bin.000136' position: 386366338
We don't know yet what caused incorrect read on the master when it was attempting to send the last event read from 'XXXXX14-bin.000761' at 566564012. This remains to be our main concern.
And it apparently stands separately from another puzzling part which is about consistency of your data.It all looks like on the slave
your jump over the failed-to-be-sent event. The next time the IO thread of slave resumes not from where it had to
which is 566564012, but from an offset left by the error message. I don't have any other explanation but CHANGE-MASTER is executed
with master_log_pos := 566579200.
So please find out what commands were run on slave to make it to connect not from what is expected.
Also notice that
@@global.gtid_strict_mode = OFF |
in your settings which does not to catch this skip esp if it was not planned by your. I recommend to always set it ON if you're concerned with
data consistency.
To the main part of what is causing the "truncate" error, could you gzip and upload to Jira
'XXXXX14-bin.000761' log? It's enough for me to have its head part ending at least at 566564012 + 1024 byte (the last event start + 1 KB).
If you can't do that then I will ask you to run 3 commands:
1. mysqlbinlog --start-position=start_pos --stop-position=566564012
where start_pos value you will have to find yourself as the offset (position) of a 100th event
in the file before the failed one. Run mysqlbinlog | less, search for ^at 566564012 to locate the event and then search for some 100th '^at any-number' upwards which will set you at the start-position event (the best if it would be GTID event).
2. mysqlbinlog -start-position=566564012
This command most probably will fail the last event could be corrupted, and if that's the case then
3. dd skip=566564012 bs=1 count=1024 < XXXXX14-bin.000761 > 566564012.dump
I am waiting for your results,
Andrei
Dear Andrei
Once we got error we are passing stop slave; start slave; and again for few hours (till next error) comes replication works fine.
No command for change in pointer.
I m trying to attached complete bin file let's MASTER14-bin.000761.zip.001![]() MASTER14-bin.000761.zip.002
MASTER14-bin.000761.zip.002![]() MASTER14-bin.000761.zip.003
MASTER14-bin.000761.zip.003![]() MASTER14-bin.000761.zip.004
MASTER14-bin.000761.zip.004![]() MASTER14-bin.000761.zip.005
MASTER14-bin.000761.zip.005![]() MASTER14-bin.000761.zip.006
MASTER14-bin.000761.zip.006![]() MASTER14-bin.000761.zip.013
MASTER14-bin.000761.zip.013![]() MASTER14-bin.000761.zip.012
MASTER14-bin.000761.zip.012![]() MASTER14-bin.000761.zip.011
MASTER14-bin.000761.zip.011![]() MASTER14-bin.000761.zip.010
MASTER14-bin.000761.zip.010![]() MASTER14-bin.000761.zip.009
MASTER14-bin.000761.zip.009![]() MASTER14-bin.000761.zip.008
MASTER14-bin.000761.zip.008![]() MASTER14-bin.000761.zip.007
MASTER14-bin.000761.zip.007![]()
MASTER14-bin.000761.zip.013![]() MASTER14-bin.000761.zip.012
MASTER14-bin.000761.zip.012![]() MASTER14-bin.000761.zip.011
MASTER14-bin.000761.zip.011![]() MASTER14-bin.000761.zip.010
MASTER14-bin.000761.zip.010![]() MASTER14-bin.000761.zip.009
MASTER14-bin.000761.zip.009![]() MASTER14-bin.000761.zip.008
MASTER14-bin.000761.zip.008![]() MASTER14-bin.000761.zip.007
MASTER14-bin.000761.zip.007![]() MASTER14-bin.000761.zip.006
MASTER14-bin.000761.zip.006![]() MASTER14-bin.000761.zip.005
MASTER14-bin.000761.zip.005![]() MASTER14-bin.000761.zip.004
MASTER14-bin.000761.zip.004![]() MASTER14-bin.000761.zip.003
MASTER14-bin.000761.zip.003![]() MASTER14-bin.000761.zip.002
MASTER14-bin.000761.zip.002![]()
Andrei
I have attached complete BIN Log for your reference and analysis
Files are MASTER14-bin.000761.zip.001 to MASTER14-bin.000761.zip.013.
Waiting for your inputs.
thanks
Devang
Is there any heading unindexed MASTER14-bin.000761.zip ?
I can't process them -
_> unzip MASTER14-bin.000761.zip.001
Archive: MASTER14-bin.000761.zip.001
End-of-central-directory signature not found. Either this file is not
a zipfile, or it constitutes one disk of a multi-part archive._
> No command for change in pointer.
Thanks for this bit of certainty. I think I am coming really close to the source of the issue, but got stuck
in unziping your bundle. There's no "master" zip file that should be fed to unzip.
MASTER14-bin.000761.zip.001![]() MASTER14-bin.000761.zip.002
MASTER14-bin.000761.zip.002![]() MASTER14-bin.000761.zip.003
MASTER14-bin.000761.zip.003![]() MASTER14-bin.000761.zip.004
MASTER14-bin.000761.zip.004![]() MASTER14-bin.000761.zip.005
MASTER14-bin.000761.zip.005![]() MASTER14-bin.000761.zip.006
MASTER14-bin.000761.zip.006![]()
I have uploaded 001 to 006 again.
When you extract file you will get on tgz (tar gzip file)
please check and let me know
All files should have same size 10MB except last one.
thanks
Devang
Devang, thanks for uploading but I still can't figure out how to "unzip". Please describe how to process them. Thank you.
> p7zip -d MASTER14-bin.000761.zip.001
/usr/bin/p7zip: MASTER14-bin.000761.zip.001: unknown suffix
And this method which must be the right one does not work either:
> ls
|
MASTER14-bin.000761.zip.001 MASTER14-bin.000761.zip.006 MASTER14-bin.000761.zip.011
|
MASTER14-bin.000761.zip.002 MASTER14-bin.000761.zip.007 MASTER14-bin.000761.zip.012
|
MASTER14-bin.000761.zip.003 MASTER14-bin.000761.zip.008 MASTER14-bin.000761.zip.013
|
MASTER14-bin.000761.zip.004 MASTER14-bin.000761.zip.009
|
MASTER14-bin.000761.zip.005 MASTER14-bin.000761.zip.010
|
> 7z e MASTER14-bin.000761.zip.001
|
|
|
7-Zip [64] 16.02 : Copyright (c) 1999-2016 Igor Pavlov : 2016-05-21
|
p7zip Version 16.02 (locale=en_US.UTF-8,Utf16=on,HugeFiles=on,64 bits,20 CPUs Intel(R) Xeon(R) CPU E5-2630 v4 @ 2.20GHz (406F1),ASM,AES-NI)
|
|
|
Scanning the drive for archives:
|
1 file, 10485760 bytes (10 MiB)
|
|
|
Extracting archive: MASTER14-bin.000761.zip.001
|
|
|
MASTER14-bin.000761.zip
|
ERRORS:
|
Unexpected end of archive
|
|
|
--
|
Path = MASTER14-bin.000761.zip.001
|
Type = Split
|
Physical Size = 10485760
|
Volumes = 13
|
Total Physical Size = 127565279
|
----
|
Path = MASTER14-bin.000761.zip
|
Size = 127565279
|
--
|
Path = MASTER14-bin.000761.zip
|
Type = zip
|
ERRORS:
|
Unexpected end of archive
|
Physical Size = 4294967347
|
|
|
ERROR: CRC Failed : MASTER14-bin.000761.tgz
|
|
|
Sub items Errors: 1
|
|
|
Archives with Errors: 1
|
|
|
Open Errors: 1
|
|
The same for 1..6 second upload:
> for f in MASTER14-bin.000761.zip.00*; do md5sum $f; done
|
f3afd717763b80df65f8fb9ef59a1814 MASTER14-bin.000761.zip.001
|
9c96fd6dd340e74d6c9ab7bbd3457854 MASTER14-bin.000761.zip.002
|
e9b1a4d4b3bb10aed6ad49e07b5bd0fe MASTER14-bin.000761.zip.003
|
7e5583f3ceae53d1342758938e5288f8 MASTER14-bin.000761.zip.004
|
b4cae487e51db15523c158239e236646 MASTER14-bin.000761.zip.005
|
b8b5eb40465516bb04cebf4848ffd310 MASTER14-bin.000761.zip.006
|
> 7z e MASTER14-bin.000761.zip.001
|
|
|
7-Zip [64] 16.02 : Copyright (c) 1999-2016 Igor Pavlov : 2016-05-21
|
p7zip Version 16.02 (locale=en_US.UTF-8,Utf16=on,HugeFiles=on,64 bits,20 CPUs Intel(R) Xeon(R) CPU E5-2630 v4 @ 2.20GHz (406F1),ASM,AES-NI)
|
|
|
Scanning the drive for archives:
|
1 file, 10485760 bytes (10 MiB)
|
|
|
Extracting archive: MASTER14-bin.000761.zip.001
|
|
|
MASTER14-bin.000761.zip
|
ERRORS:
|
Unexpected end of archive
|
|
|
--
|
Path = MASTER14-bin.000761.zip.001
|
Type = Split
|
Physical Size = 10485760
|
Volumes = 6
|
Total Physical Size = 62914560
|
----
|
Path = MASTER14-bin.000761.zip
|
Size = 62914560
|
--
|
Path = MASTER14-bin.000761.zip
|
Type = zip
|
ERRORS:
|
Unexpected end of archive
|
Physical Size = 127565152
|
|
|
ERROR: Data Error : MASTER14-bin.000761.tgz
|
|
|
Sub items Errors: 1
|
|
|
Archives with Errors: 1
|
|
|
Open Errors: 1
|
|
It would be more productive if you
0. compared md5sums against your files
1. tested the unzipping yourselves , and
2. pasted me commands that you run.
Thank you.
Let's try last time else i will run command those you have suggested,
On windows machine i can see following outcome.
"C:\Program Files\7-Zip\7z.exe" l MASTER14-bin.000761.zip.001
7-Zip 18.05 (x64) : Copyright (c) 1999-2018 Igor Pavlov : 2018-04-30
Scanning the drive for archives:
1 file, 10485760 bytes (10 MiB)
Listing archive: MASTER14-bin.000761.zip.001
–
Path = MASTER14-bin.000761.zip.001
Type = Split
Physical Size = 10485760
Volumes = 13
Total Physical Size = 127565279
Path = MASTER14-bin.000761.zip
Size = 127565279
–
Path = MASTER14-bin.000761.zip
Type = zip
Physical Size = 127565279
Date Time Attr Size Compressed Name
------------------- ----- ------------ ------------ ------------------------
2018-09-14 17:29:44 ....A 128151413 127565099 MASTER14-bin.000761.tgz
------------------- ----- ------------ ------------ ------------------------
2018-09-14 17:29:44 128151413 127565099 1 files
------------------- ----- ------------ ------------ ------------------------
2018-09-14 17:29:44 128151413 127565099 1 files
Archives: 1
Volumes: 13
Total archives size: 127565279
My guess is following commands should run perfectly
p7zip is same as 7z.exe.
1) p7zip l MASTER14-bin.000761.zip.001
2) p7zip x MASTER14-bin.000761.zip.001
plz share your findings
thanks
Devang
Let's stick to 1-6 archive. Apparently something is wrong with either uploaded files
or there is incompatibility of our versions of 7z. Look -
> 7z l MASTER14-bin.000761.zip.001
|
|
|
7-Zip [64] 16.02 : Copyright (c) 1999-2016 Igor Pavlov : 2016-05-21
|
p7zip Version 16.02 (locale=en_US.UTF-8,Utf16=on,HugeFiles=on,64 bits,20 CPUs Intel(R) Xeon(R) CPU E5-2630 v4 @ 2.20GHz (406F1),ASM,AES-NI)
|
|
|
Scanning the drive for archives:
|
1 file, 10485760 bytes (10 MiB)
|
|
|
Listing archive: MASTER14-bin.000761.zip.001
|
|
|
--
|
Path = MASTER14-bin.000761.zip.001
|
Type = Split
|
Physical Size = 10485760
|
Volumes = 6
|
Total Physical Size = 62914560
|
----
|
Path = MASTER14-bin.000761.zip
|
Size = 62914560
|
--
|
Path = MASTER14-bin.000761.zip
|
Type = zip
|
ERRORS:
|
Unexpected end of archive
|
|
Can you compress with a regular zip? Or do that on a linux machine (where your servers are running)?
MASTER14-bin.000761.zip.007![]() MASTER14-bin.000761.zip.008
MASTER14-bin.000761.zip.008![]() MASTER14-bin.000761.zip.009
MASTER14-bin.000761.zip.009![]() MASTER14-bin.000761.zip.010
MASTER14-bin.000761.zip.010![]() MASTER14-bin.000761.zip.011
MASTER14-bin.000761.zip.011![]() MASTER14-bin.000761.zip.012
MASTER14-bin.000761.zip.012![]() MASTER14-bin.000761.zip.013
MASTER14-bin.000761.zip.013![]()
There are total 13 segment of file.
You need to download all and try to extract
I have re-uploaded 7 to 13 number segment.
Please try again meantime i m downloading "split" segment from server and try to share with you, i m confident that will surely work
thanks
Devang
> I have re-uploaded 7 to 13 number segment.
Do you mean they complete the 1-6 bundle? Assuming that and trying..
Finally unzipped. Indeed the reason was missed 7-13 and something corrupted in the earlier 1-13. I also see an event's start as expected
# at 566579200
|
#180913 10:54:51 server id 14 end_log_pos 566579242 CRC32 0x4859a6cf GTID 0-1
|
4-1523115111
|
|
which is a sign this is the file and it's in good shape. Turning to analysis now, thanks for helping!
Devang,
As some intermediate results, I can explain mismatch between the two error log lines:
the last byte read from 'XXXXX14-bin.000761' at 566564031.
Slave SQL thread exiting, replication stopped in log 'XXXXX14-bin.000761' at position 566579200
Indeed the slave has received all bytes up to 566579200, despite the claimed 566564031 in
the first line. That was wrong report. This also means there should be no threat of
data inconsistency. There are no gaps in received stream as the IO thread resumes from the actual
last byte which is 566579200. But you have to restart the slave from time to time meanwhile.
Now I am trying to identify where the master dump thread gets confused at reading from binlog.
Unfortunately there's not much details in the logs that 10.2.17 can print out.
If only I could add up few diagnostic messages the case would be resolved..
Would it be possible for you to try out a patched 10.2.17 that would leave extra info in the error log?
This would streamline fixing enormously.
Would it be possible for you to try out a patched 10.2.17 that would leave extra info in the error log?
This would streamline fixing enormously.
*>> No, my management would not allow or agree for this
>> Even after this incident, they started chattering against my suggestion for moving to MariaDB and leaving
>> MySQL.
>> Fact is we were using MySQL since more than 12 years and we just switched to MariaDB in March-2018 you can also see in yum log.
>> Within nearly 6 months our major DOWNFALL , replication starts stopping without any reason.
>> Such issue we never faced in MySQL
>> Anyways when MariaDB yum repo will have fix against this issue i can encourage them to apply it to fix this issue.
>> So again sorry, NO intermediate patch of fixes
>> If you have any other solution i am happy to adopt it.
*
being expert on technical things is easy,
talking technical things is moderate,
explaining technical things to world is tough.
hope you understand.
thanks
Devang
> hope you understand
Pretty much. I asked before I've analyzed it through and with really tiny bit of hope
(as if yours is a business installation then I know the answer).
Your help was incredible, and now I think I have gotten what's happening to switch to
testing it. I really hope to come up with a solution really soon.
Should i wait for your research result or downgrade to previous version ?
One thing is sure once i will downgrade i do not know when i will get energy and trust back to apply newer patch to MariaDB.
Please guide and advice further.
thanks
Devang
I have a patch by now to be sent for reviewing today. It will take some time (days or couple of weeks) until it will show up into a new release.
Consider to downgrade meanwhile if failures are frequent (like I said earlier it must be safe to restart slave upon such failure, so a script could do that as well).
5b735e8f09c is pushed to 10.1.
To sum up the case,
according to logs analysis the Dump thread attempted to read again data which
was already sent. The reason of regressed read turns out in an _my_b_cache_read()
early exit branch which missed to distinguish between total zero size read (e.g
ineffective read when Count argument is zero) from a case when the
requested amount of data is fully read out by sole accessing the cache's
file. In the latter case such then effective reading was not
reflected in the cache's state to screw the cache's state.
Fixed with a check introduced of whether the file reading was effective prior to
early exit. When this is the case conduct standard cache state change to
account the actual read size.
Notice the bug can show up also as an error to read binlog event e.g
through BINLOG_GTID_POS() (of MDEV-16886).
Dear Andrei,
I was following you and all the communication or action carried out under this ticket.
Thanks a lot for your initiatives and actions taken to resolve it.
Can you suggest next action because i m now confused with version for which i have reported issue and version showing in FIXED both are quite unmatching i.e. reported ver was 10.2.17 and fixed ver 10.1.37 ?
thanks
Devang
Devang, thank you for a great assistance! I will let you know when the current patch branch 10.1 is going
to be merged to 10.2.
Cheers, Andrei
https://jira.mariadb.org/secure/Dashboard.jspa promises the next release on Nov 2.
Andrei
It is 10-Nov but i did not found updates of Maria DB when i tried YUM DOWNLOAD command on CentOS 6.10.
please confirm
thanks
Devang
Devang,
I see the release has been delayed for 3 days by now:
https://jira.mariadb.org/projects/MDEV/versions/23207
because some of builders have not completed yet.
I may look into the latest http://hasky.askmonty.org/archive/10.2/build-22746/ which includes the current bug fixes
in packages that are available.
Cheers,
Andrei.
Dear Andrei Elkin [ elkin ]
One thing i noticed which may help you further , i m not sure how near i m but i observed this behavior when MASTER does not have anything left to send to SLAVE.
I might be wrong but it surely help you.
thanks for looking into.
Devang